
Unlocking student success is paramount in education, and our performance dashboard equips educators with essential insights. From analyzing passed and failed students to delving into topic-wise performance and mark distributions, educators gain actionable data to refine teaching strategies and foster academic growth. Dive into comprehensive analyses for targeted interventions and enhanced learning outcomes.
Screen 1: Top-Wise Performance
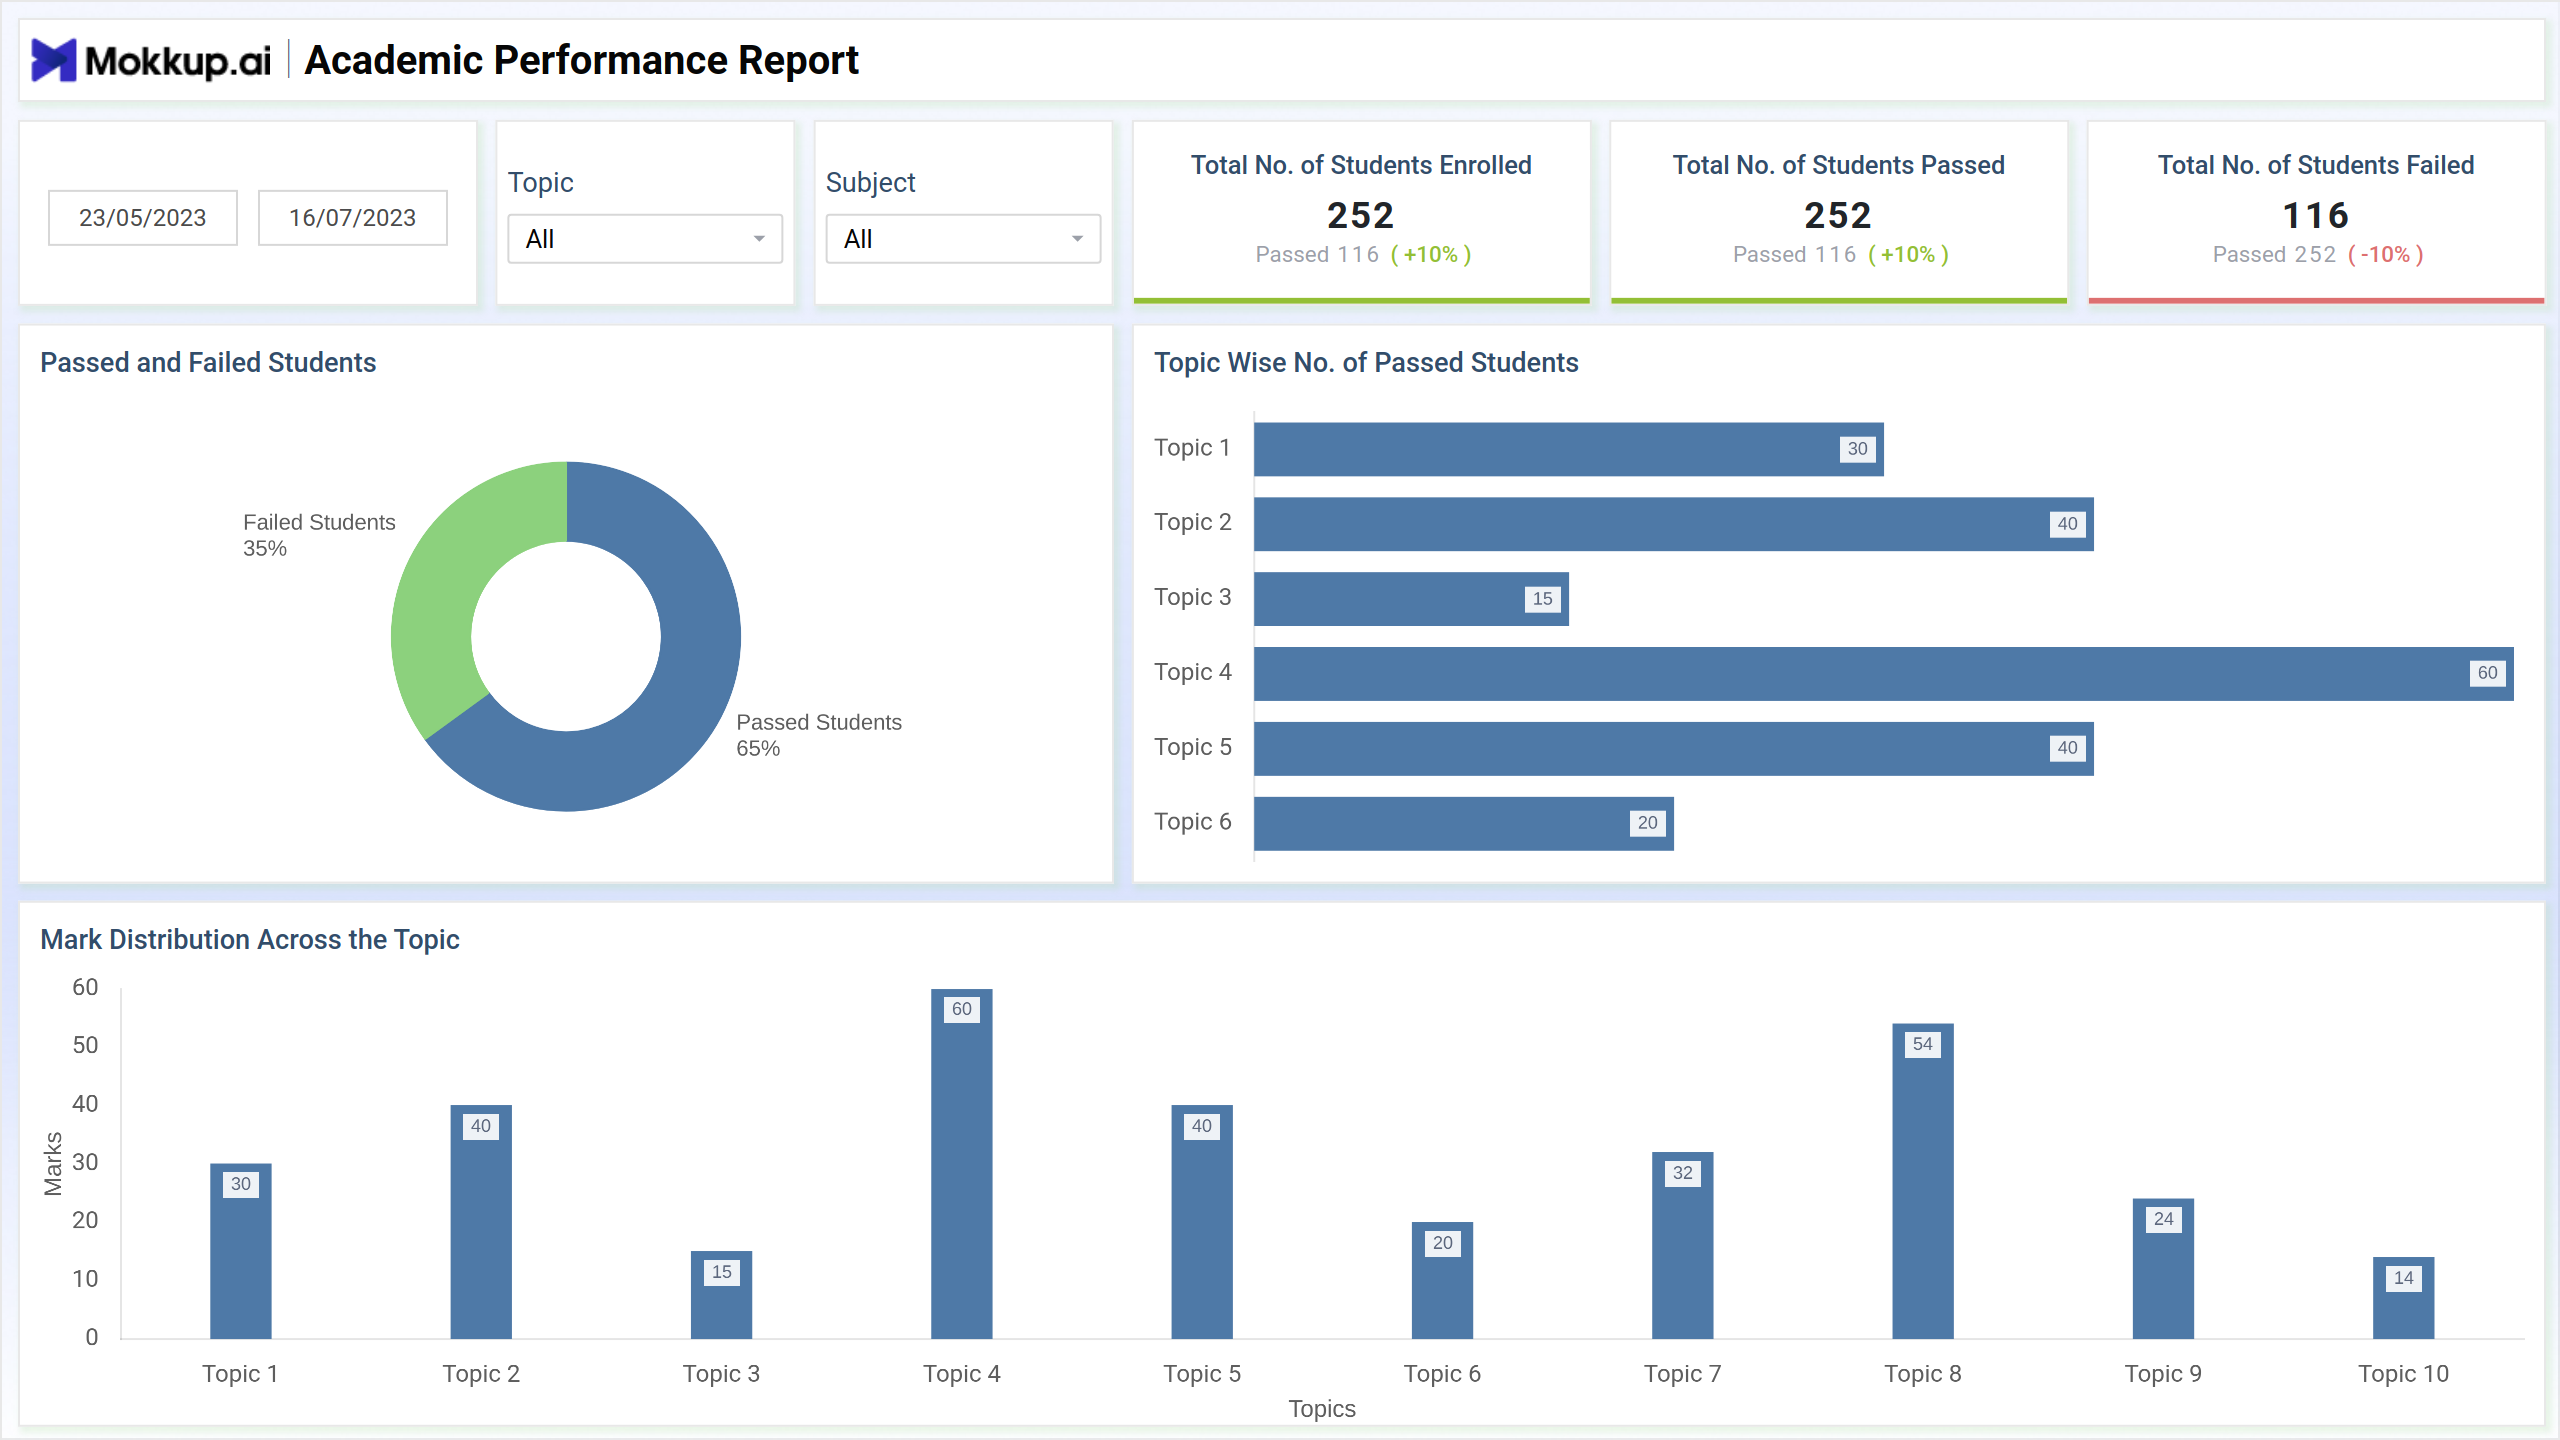
The performance dashboard provides a comprehensive overview of student achievements and outcomes, encompassing critical metrics such as passed and failed students, the topic-wise distribution of passed students, and the distribution of marks across various topics. Through this dashboard, educators and administrators gain valuable insights into student performance trends, allowing for targeted interventions and curriculum enhancements to address areas of strength and improvement. With detailed analyses of student success rates and mark distributions, educators can make informed decisions to optimize learning outcomes and support student success across diverse subject areas.
Key Terms to consider:
- Passed and failed students: The dashboard displays the number of students who passed and failed.
- Topic-wise number of passed students: Users can see the breakdown of passed students by topic.
- Mark distribution across the topic: The dashboard visualizes the distribution of marks across different topics.
Screen 2: Key Topic Results
The screen offers a comprehensive analysis of student performance, incorporating key metrics and insights essential for educators and administrators. From detailing the distribution of questions based on difficulty levels to providing an overview of average scores achieved by students, and presenting a summarized table of performance indicators, this tool empowers users with actionable data to enhance teaching and learning outcomes. Users can delve into the difficulty levels of questions across various topics and assess the average performance of students, while also identifying the top and bottom scores attained, enabling targeted interventions and strategic decision-making to support student success and academic growth.
Key Terms to consider:
- Distribution of number of questions based on difficulties: The dashboard illustrates the distribution of questions categorized by difficulty levels.
- Average score: Users can view the average score achieved by students on assessments or exams.
- Summary table: A summarized table provides an overview of key metrics and performance indicators.
- Question difficulty of different topics: Users can assess the difficulty levels of questions across various topics.
- Average score of students: The dashboard displays the average score attained by students on assessments or exams.
- Top score: Users can identify the highest score achieved by any student.
- Bottom score: The dashboard highlights the lowest score attained by any student.
Screen 3: High Level Summary
The screen offers educators and administrators a comprehensive insight into student achievements and outcomes across various subjects and assessments. With features such as the average score of each subject and a concise summary table showcasing key metrics and performance indicators, users can gain a holistic understanding of student performance trends. Additionally, the dashboard provides valuable insights into the pass and fail percentages, allowing educators to track student success rates and identify areas requiring improvement or intervention. By also presenting the total number of students enrolled and highlighting the top scoring subject, educators can make informed decisions to enhance teaching strategies and curriculum design, ultimately fostering student success and academic excellence.
Key Terms to consider:
- Average score of each subject: The dashboard presents the average score attained by students in each individual subject.
- Summary table: A concise summary table provides an overview of key metrics and performance indicators.
- Pass percentage: Users can track the percentage of students who have successfully passed assessments or exams.
- Fail percentage: The dashboard displays the percentage of students who have failed assessments or exams.
- Number of students enrolled: Users can view the total number of students enrolled in the course or program.
- Top-scoring subject: The dashboard identifies the subject in which students achieved the highest average score.
Dashboard Template Insights
Our performance dashboard provides educators with vital insights into student success. By analyzing pass rates, topic-wise performance, and mark distributions, educators can tailor teaching strategies for academic growth. With detailed summaries and insights, educators can track performance trends and ensure every student receives the support they need to thrive academically.
Conclusion
In conclusion, our performance dashboard offers educators and administrators invaluable insights into student achievements and trends. By analyzing critical metrics like pass/fail rates, topic-wise performance, and mark distributions, educators can refine teaching strategies and enhance learning outcomes. Empower your institution with actionable data to support student success and academic excellence.