What is a Customer Journey Dashboard?
The Customer Journey dashboard template enables users to carefully map and grasp every consumer interaction with a company product. The ones listed below, which consumers experience during their engagement journey, are fully visualized in this hierarchical framework.
Benefits of a Customer Journey Dashboard
A dashboard for customer journey is a powerful tool that helps businesses visualize and understand how different customers interact with their brands across various touchpoints. Here are the key benefits:
- Get a holistic view of customer experience through the marketing funnel.
- Quickly spot stages where customers disengage or face issues.
- Real-time insights and KPIs drive faster decisions backed by data.
- Understand customer behavior and preferences for better personalization.
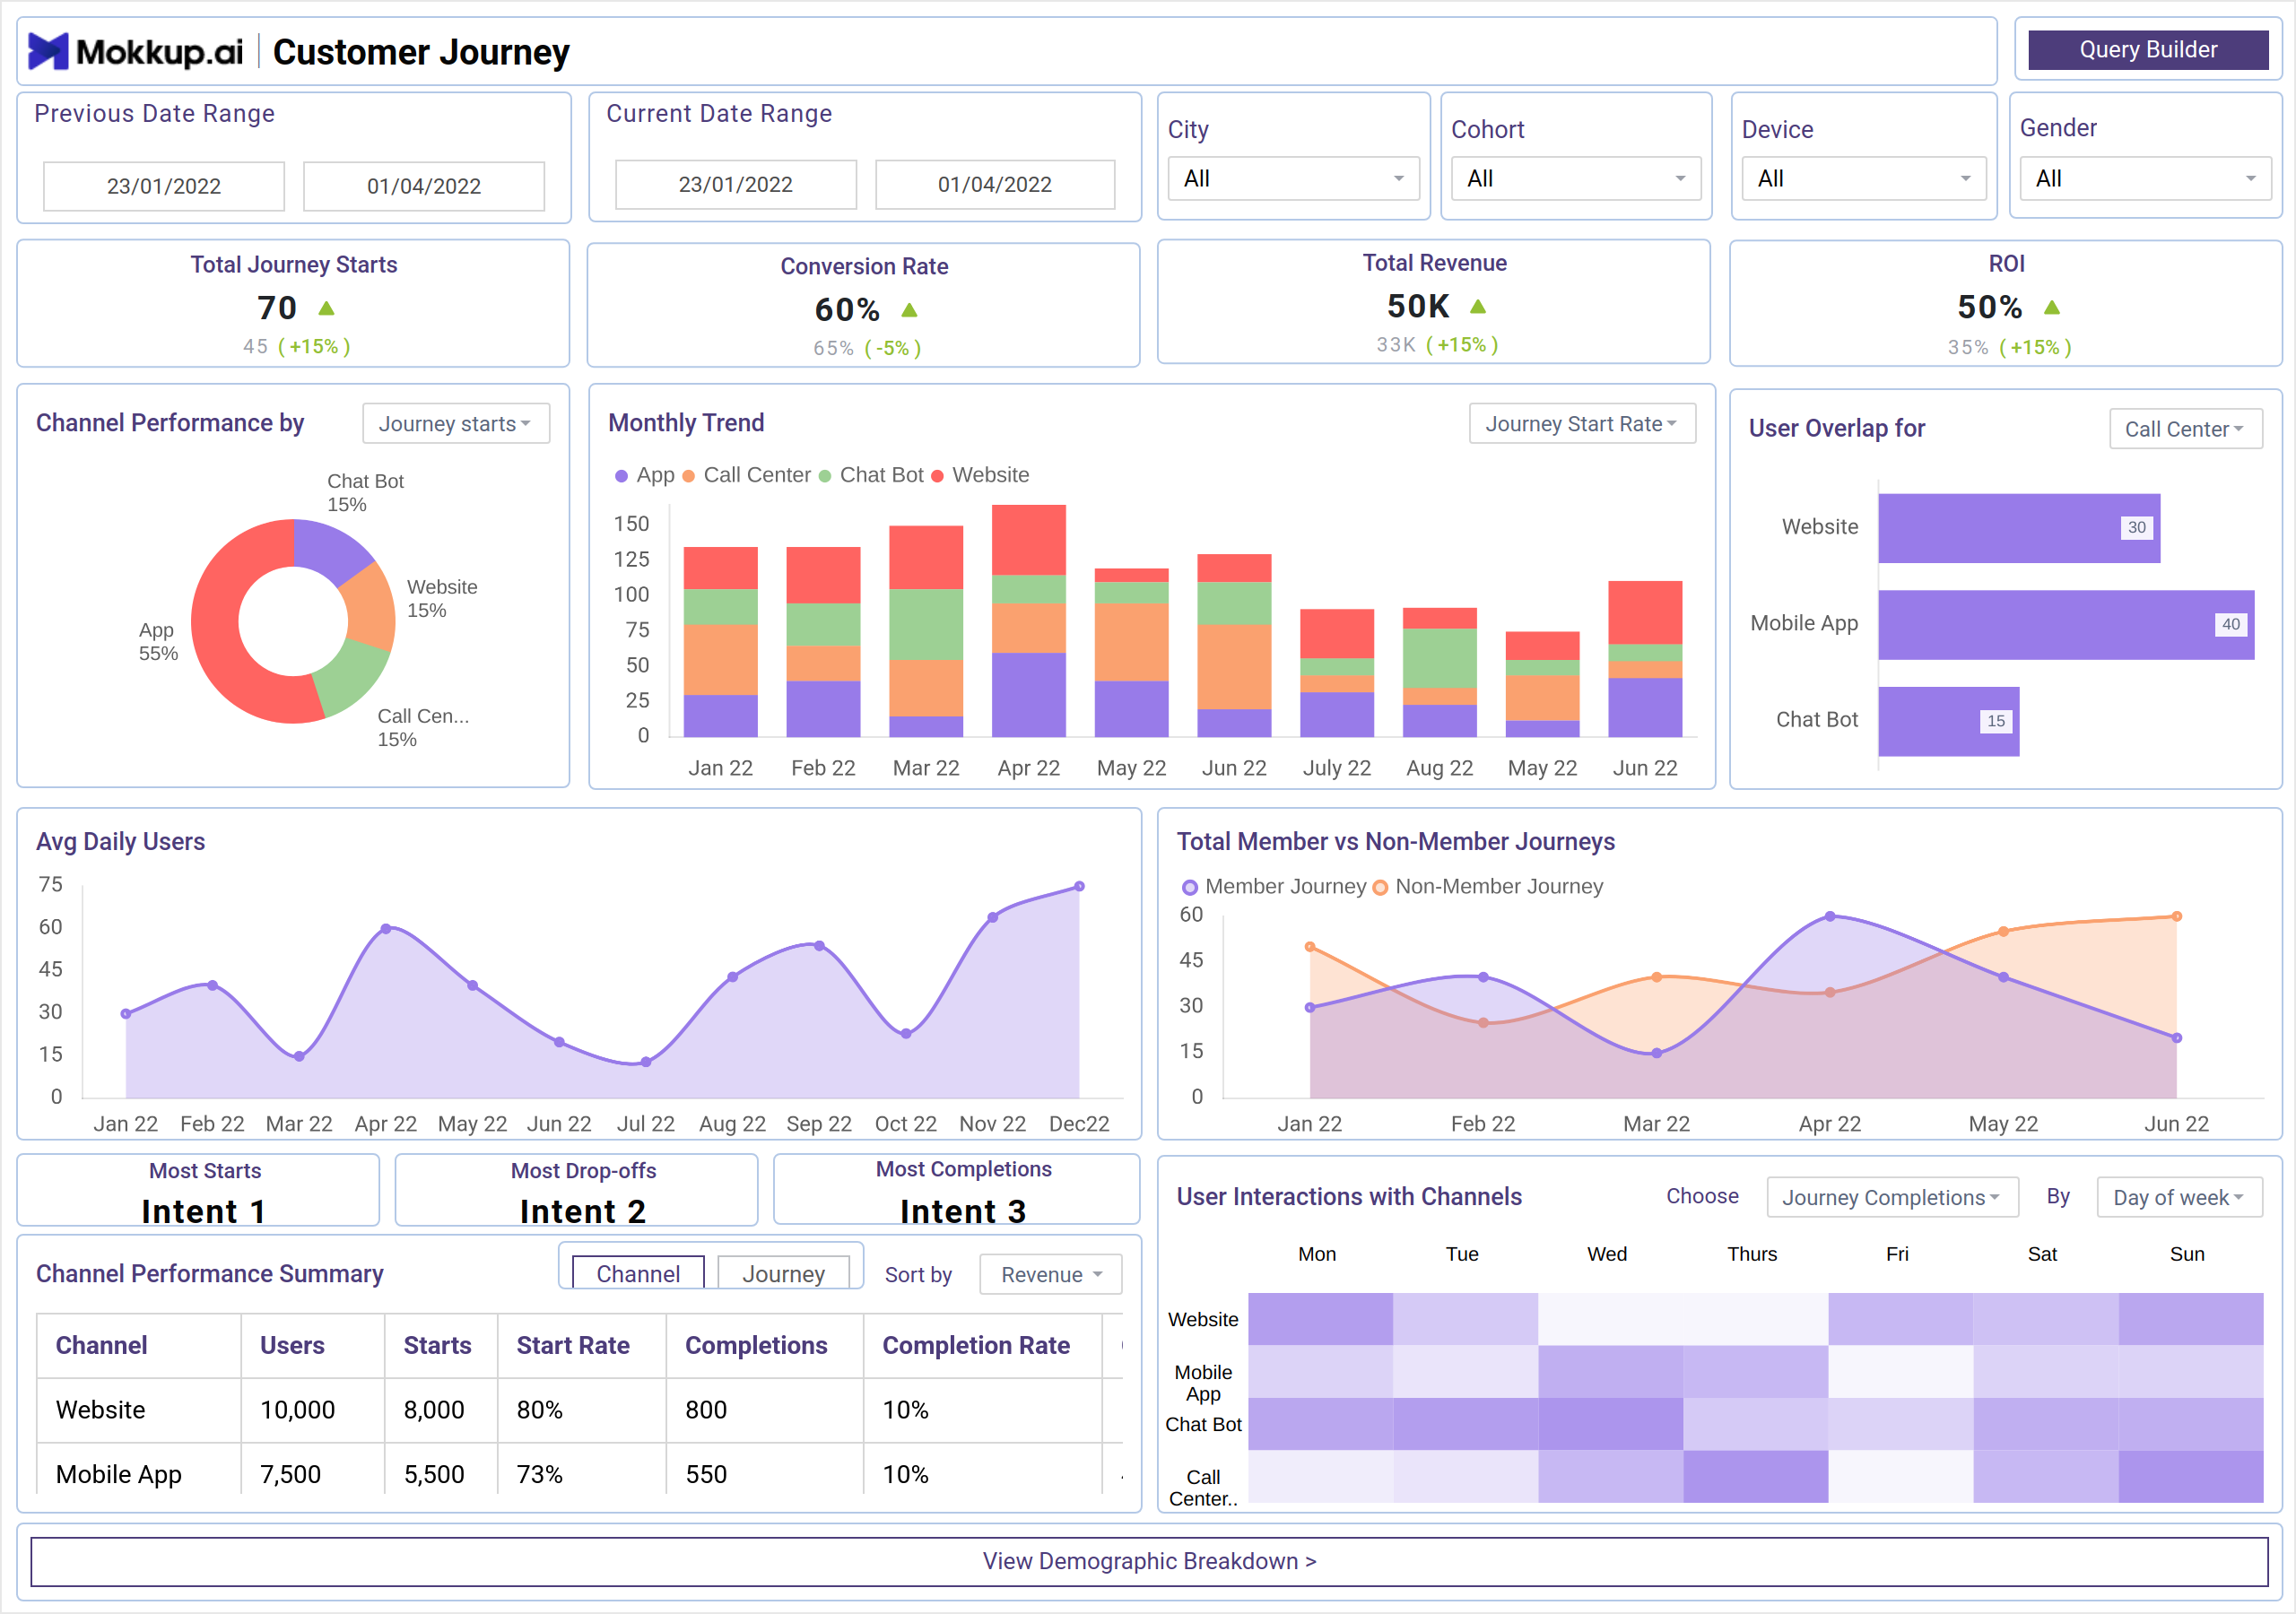
Customer Journey Dashboard Example
The customer journey analytics dashboard typically consists of sections that track key customer journey stages, such as awareness, consideration, purchase, and retention. The dashboard is highly customizable, allowing users to choose the specific metrics they want to focus on, such as traffic sources, conversion rates, customer engagement, and retention metrics. Filters are integrated to refine data based on parameters like date range, customer demographics, or marketing channel, ensuring that insights are tailored to specific needs.
How to Analyze Data in Customer Journey Dashboards
To analyze a Customer Journey Dashboard, identify drop-off points, track conversion rates between stages, and segment users by channel, device, or behavior. Measure time between touchpoints to spot friction and overlay attribution to find high-performing channels. This can be similar to the GA4 customer journey dashboard, which visually represents the entire customer journey.
You can use cohort analysis to detect patterns and compare journeys of high-value users. Look for trends over time, set benchmarks, and tie insights back to revenue or retention. This helps pinpoint bottlenecks and optimize the journey for better engagement and conversions.
KPIs to Track in Customer Journey Dashboards
From this customer journey tracking dashboard, you can track KPIs like:
- Cohort - Grouping users based on common characteristics or behaviors to analyze trends, track performance, and improve user experience over time.
- Conversion Rate - It depicts the percentage of users who have taken a desired action, such as purchasing, to evaluate the effectiveness of marketing campaigns or sales efforts.
- ROI - Measuring the Return on Investment to assess the profitability of a particular business or marketing efforts.
- Journey Completion Rate - Evaluating the percentage of users who complete a predefined journey or sequence of actions on a website or app.
- Query Builder - Utilizing a query builder tool to create customized queries for extracting specific information from a database or dataset.
How to Create a Customer Journey Dashboard
You can create the best customer journey dashboards by using the drag-and-drop capabilities of Mokkup or by simply using a ready-to-use template. You just need to plug in your data and export it however you like. Here’s how to do it:
1. Create or Log in to Your Mokkup Account
To access the dashboard templates, sign up on Mokkup.ai using your email. If you already have an account, just log in and jump right in.
2. Choose and Customize Your Dashboard
Head to the Templates section and select the customer journey dashboard. Use the drag-and-drop editor to modify metrics, apply demographic filters, or add elements that align with your reporting needs.
3. Export to Your BI Tool
Once your dashboard is set, use the BI Tool Export feature to move it to Power BI or Tableau for deeper insights. You can also download it as a PDF, PNG, or JPEG, embed it where needed, or share it with your team to get started with customer journey visualization.
Note: This is a Pro template. To use and customize this dashboard wireframe, you’ll need a Pro subscription on Mokkup. Upgrade anytime to unlock full access.
Frequently Asked Questions
1. Why is a Customer Journey Dashboard important?
It gives a holistic view of the customer lifecycle, highlights drop-off points, and reveals which touchpoints or channels drive the most value.
2. Can small businesses use a Customer Journey Dashboard?
Absolutely. Even with basic tools like Google Analytics, CRM reports, and spreadsheets, small businesses can start mapping journeys and identifying improvement areas.