
What is Business Intelligence Implementation?
Business Intelligence (BI) implementation is the process of setting up tools and systems. These tools help businesses turn raw data into useful insights through visualization. The process starts with strategic planning. where, the organization sets goals and identifies key performance indicators (KPIs). It also decides which data sources will connect to databases or CRM platforms.
After that, they combine data from different sources into one system. This ensures that all important information is ready for analysis. They then organize this data in a data warehouse or cloud storage, making it easily accessible for reporting and analysis.
Once the data is set up, BI tools such as Tableau or Power BI are used for creating dashboards and generating reports that display key metrics and trends in a visual representation.
Table of Contents
- Why is Business Intelligence Important for Your Organization?
- Key Benefits of Implementing Business Intelligence
- Enhancing Business Intelligence Through Data Analysis Tools
- Business Intelligence Implementation Algorithm
- What Are the Costs and Key Factors Influencing BI Implementation?
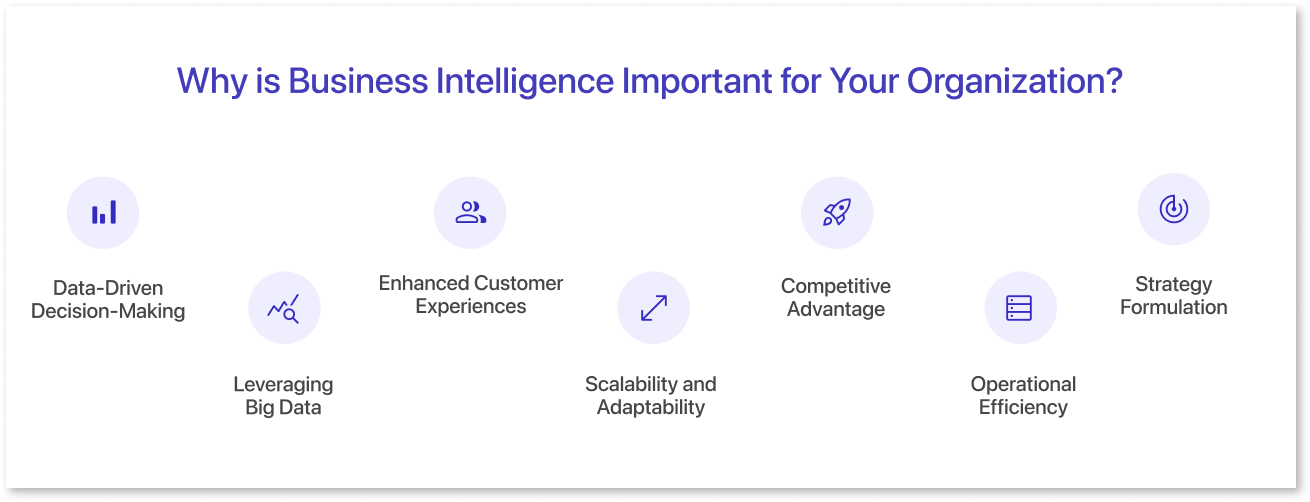
Why is Business Intelligence Important for Your Organization?
The word "Business Intelligence" refers to a number of processes that collect, store, and analyze information about business activities. For example, Amazon uses business intelligence to track what customers buy. They adjust recommendations, inventory, and prices to increase sales and keep customers happy. BI also improves teamwork by ensuring that everyone has access to the same data. This makes decision-making easier.
Coca-Cola uses business intelligence to watch their operations around the world. This helps them improve logistics and reduce costs. This ensures their products are always in stock where needed.
Business owners are increasingly turning to Business Intelligence (BI) to maintain their competitive edge, contributing to the growth of the global BI market. This market has expanded from USD 29.42 billion in 2023 to an expected USD 63.76 billion by 2032. This shows a compound annual growth rate (CAGR) of 9.0%. (Source: Fortune Business Insights)
Business intelligence (BI) is important for companies. BI tools and big data analytics help companies analyze large amounts of data. They also streamline operations and create tailored consumer strategies.
Companies can use these data insights to enhance supply networks, increase consumer loyalty, and respond quickly to market changes. BI additionally helps with strategy planning by identifying potential growth possibilities and challenges.
The BI implementation cost varies based on factors like customer needs, deployment options, and customization. Onsite services cost around $200,000 annually, while cloud-based Business Intelligence solutions average $125,000 per year. Budgeting for BI implementation and calculating ROI is essential to maximize benefits. (Source: Dresner Advisory Services)
Key Benefits of Implementing Business Intelligence
Implementing Business Intelligence (BI) provides many benefits that can greatly improve the way companies function and make decisions. By using data, organizations can get important insights, reduce operations, and improve overall performance.
Here are some of the primary benefits that come with successful BI implementation:
1. Real-Time Data Access:
In our advanced world, waiting for weekly or bi-weekly reports can lead to missed opportunities. It can also delay important opinions. With BI, you can quickly access important data. This helps you make smart business decisions and respond fast to potential problems.
2. Unified Data View
Often, various departments keep fragmented data, making it difficult to get an overall view of the organization. BI implementation creates a single source of truth, allowing all teams to collaborate and make informed data-driven choices.
3. Improved Visibility
It can be difficult to sort through a large number of figures. BI gives you a clear view of your organization's operations. This helps you focus on important areas and procedures that need attention.
4. Boosted Efficiency
BI allows you to identify areas where employees are not performing well, minimize unnecessary positions, and optimize workflows. You can additionally evaluate the impact of changes and modify strategies to improve overall performance.
5. Better Customer Insights
Understanding customer behavior and purchasing habits is important for improving products and services. BI provides deeper insights into customer preferences, allowing you to customize your services accordingly.
6. Sales Trend Analysis
With access to real-time and historical sales data, you can see trends in your market. This helps you predict how different sectors will perform. You can also find new opportunities to boost revenue.
BI does more than just track internal operations; it also allows you to compare your performance to competitors. This helps you find areas where you are falling behind. You can then create ways to win over your clients.
Enhancing Business Intelligence Through Data Analysis Tools

Business Intelligence (BI) uses a number of visualization techniques to transform raw data into useful insights. Here's an overview of popular BI visualization tools:
- Tableau: Is known for its impressive visualizations and user-friendly interface. It lets users create interactive dashboards and detailed visual analytics. This makes complex data simple to understand quickly.
- Power BI: Allows you to create reports with a drag-and-drop interface and provides multiple data visualization options.
- Looker: Google's Looker integrates easily with BigQuery and other databases, allowing for real-time data analysis and custom visualizations suited to specific business requirements. It's especially handy for teams looking for deeper data exploration with embedded analytics capabilities.
- Qlik Sense: Uses its Associative Engine to help users find connections and insights. Other tools might miss these insights. This tool is ideal for businesses wanting to uncover hidden data relationships and patterns.
- Mokkup.ai: Mokkup makes BI development easier and lets users create dashboard wireframes without needing advanced design skills. This helps gather early feedback and get client approvals faster. It also ensures the use of BI best practices in the dashboard design process.
Each of these tools brings unique characteristics to BI visualization by allowing organizations to confidently make data-driven decisions.
Business Intelligence Implementation Algorithm
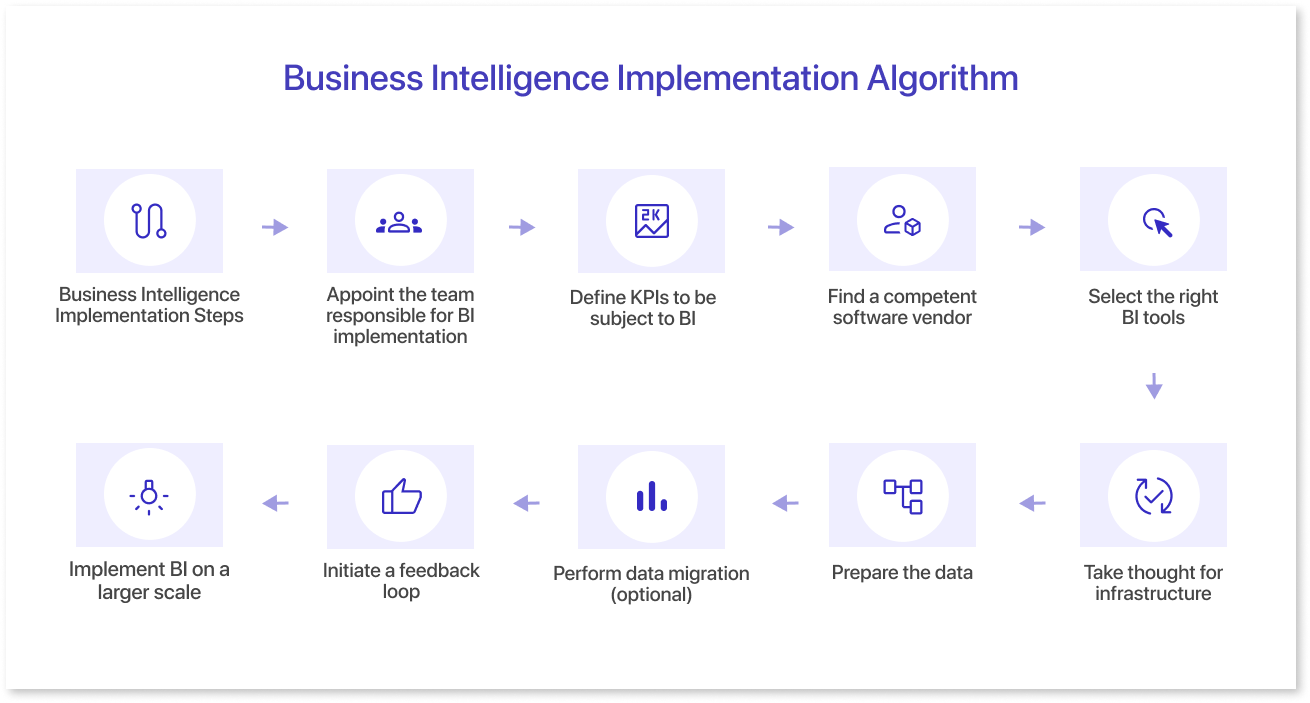
Before starting a BI implementation, you should have a clear goal for what you want to achieve with data insights. Establishing a solid foundation promotes an easy workflow and maximizes the value of your business intelligence solution.
Key Steps in BI Implementation:
- Form a Dedicated Team: Gather a team with data analysts, business analysts, IT experts, and subject matter experts to manage the BI implementation.
- Identify Key Performance Indicators (KPIs): Determine the important metrics that will measure the organization's performance and guide decision-making.
- Pick a Good BI Software Vendor: Compare different providers. Look at their prices, scalability, ease of use, and support.
- Choose the Right BI Tools: Pick data visualization tools that match the business's needs and the key performance indicators (KPIs). Consider factors like data visualization capabilities, reporting features, and integration with existing platforms.
- Prepare the Data: Cleanse, process, and integrate data from diverse sources to ensure its quality and consistency.
- Perform Data Migration (Optional): If needed, transfer old data into the new BI system. This helps with long-term analysis and finding trends.
- Assess and Implement BI Infrastructure: Evaluate the organization's IT infrastructure, including hardware, software, and network capacity, to verify it can support the BI workload. Once ready, roll out the BI solution to relevant users and provide training and support.
- Create a Feedback Loop: Regularly collect feedback from users to identify areas for improvement. Use feedback to improve the BI solution and its value.
By following these steps and regularly checking the BI implementation, organizations can use data to make better decisions. This helps them improve operations and gain a competitive edge.
What Are the Costs and Key Factors Influencing BI Implementation?
Several factors affect the cost and time of a BI implementation, including how complex the project is, the Business Intelligence platform chosen, data quality, and the need for customization. Here's a summary of what drives costs and time in a BI data analytics project.
1. Project Scope and Complexity:
Larger projects with different data sources and complex data connections need more time and resources. This can lead to higher costs. Complex BI solutions can take several months to over a year for full implementation. This time depends on the data architecture and reporting needs.
2. Selection of BI Tools and Software:
The cost of using BI platforms like Power BI, Tableau, or Qlik depends on the number of users, features, and how they're hosted. High-end platforms may cost more up front, but they provide extensive analytical capabilities.
3. Data Integration and Quality:
Data integration from multiple sources can be costly and time-consuming, especially when the data is inconsistent or siloed. Extensive data cleansing might be necessary, increasing labor and software costs and potentially delaying the project by weeks or months.
4. Customization and Dashboard Creation:
Customization is essential for aligning BI solutions with business requirements, such as creating personalized dashboards and reports. Customized solutions that provide relevant KPIs and insights require more development time, which raises both costs and project duration. Creating custom dashboards for specific departments or goals can take several weeks, depending on their complexity.
5. Data Governance and Security:
Strong data governance is essential for maintaining data integrity and regulatory compliance. Setting up governance frameworks during BI implementation helps reduce future costs related to data breaches or compliance issues. Industries such as healthcare and finance face higher costs due to strict security and certification requirements.
6. Scalability and Flexibility:
Investing in a flexible, scalable BI system may cost more initially, but it saves money in the long run. Scalable BI platforms may grow with the business, removing the need for costly upgrades or changes later on.
7. Training and User Adoption:
Effective BI usage throughout the organization is dependent on user training, which adds time and money. Training expenses range from one-time courses to on-going support. Low adoption can require further training or system changes, raising both costs and project deadlines.
8. Project Management and Maintenance:
Having a dedicated project management team is crucial for a successful BI implementation. Additionally, ongoing maintenance, upgrades, and support are essential to ensure the BI platform functions smoothly, particularly in environments with dynamic data needs.
Final Thoughts
BI solutions can transform how businesses operate, offering valuable insights, promoting data-driven decisions, and gaining a competitive edge. Business Intelligence tools use predictive analytics to provide decision-makers and business users with a wide range of insights. By including data from various sources, including social media.
These tools provide clear information that is easy to understand. They help organizations make smart decisions based on accurate forecasts and trends. This leads to better planning and improved efficiency in operations. For those considering a BI implementation, Mokkup.ai stands out as an ideal option.
Prompt it. Wireframe it with Mokkup.ai.
