
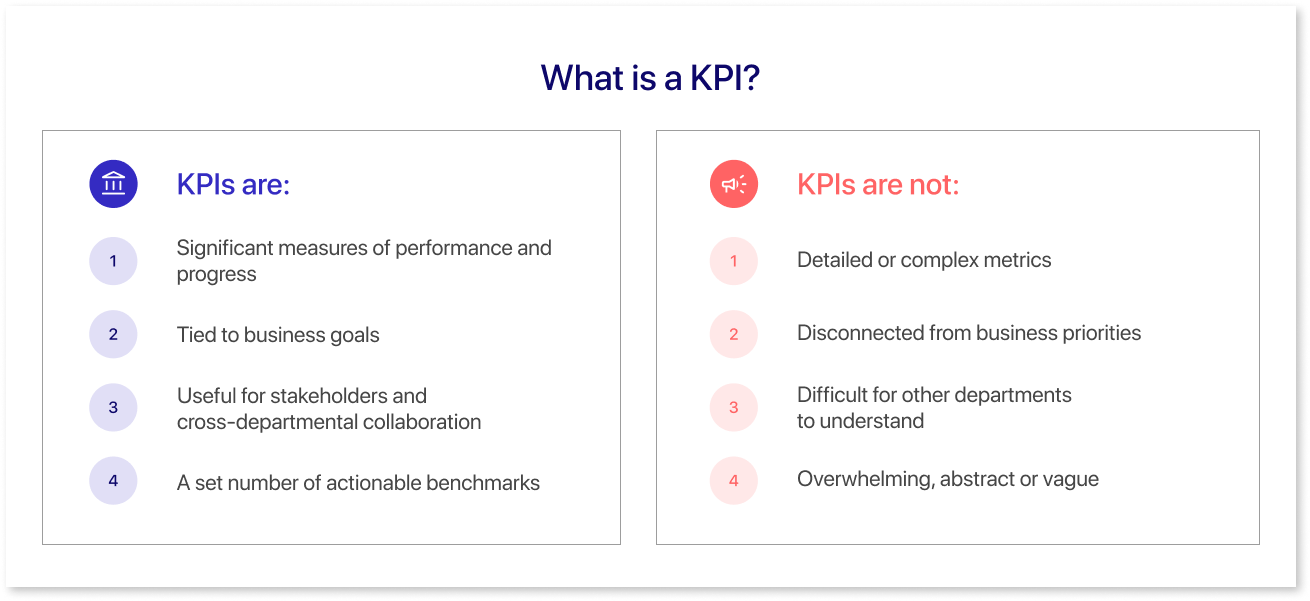
Key performance indicators (KPIs) have emerged as indispensable tools in this pursuit, offering a quantifiable means to measure and evaluate the success of various business activities. But what is KPI? Organizations use measurable values to assess and track the effectiveness and performance of various aspects of their operations.
These indicators provide a quantifiable way to gauge progress toward organizational goals, measure specific activities' success, and identify improvement areas. KPIs vary across industries and business functions, encompassing metrics related to financial performance, customer satisfaction, operational efficiency, employee productivity, and more.
As businesses increasingly recognize the pivotal role of customer satisfaction in their overall success, understanding the importance of customer service KPIs becomes paramount. Let's get to the bottom of understanding the top ten customer service KPIs.
Table of Contents
- Customer Satisfaction (CSAT)
- Net Promoter Score (NPS)
- First Response Time (FRT)
- Average Resolution Time (ART)
- Customer Retention Rate (CRR)
The types of Customer Service KPIs
Key Performance Indicators, or KPIs, are like road signs for businesses – they guide the way and show how well things are going. Now, let's take a closer look at the different types of KPIs. Think of them as categories or groups, each telling a unique part of the business story.
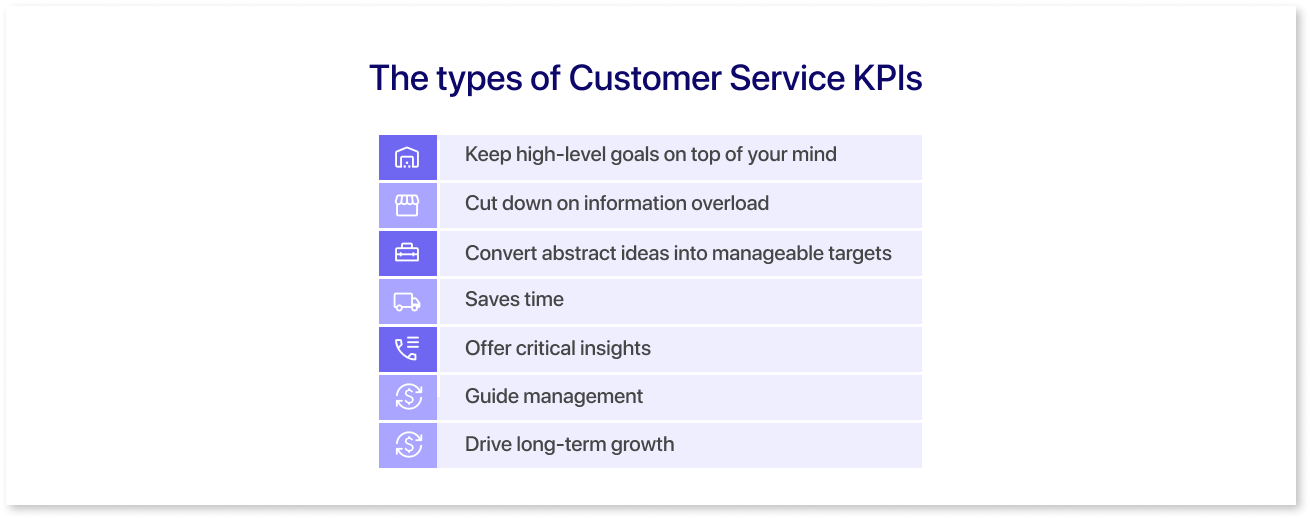
From money matters to happy customers and smooth operations, these types of KPIs help companies figure out what's working well and what might need extra attention.
1. Customer Satisfaction (CSAT)
Customer satisfaction (CSAT) is like a happiness meter for businesses. It tells them how satisfied customers are with their products or services. To calculate CSAT, companies often ask customers to rate their satisfaction on a scale, usually from 1 to 5 or 1 to 10.
Now, why is CSAT so crucial? Think of it as a guide for businesses to know how well they meet customer expectations. Companies can make innovative improvements by understanding what makes customers happy or not-so-happy. It's like listening to customers and using their feedback to improve things.
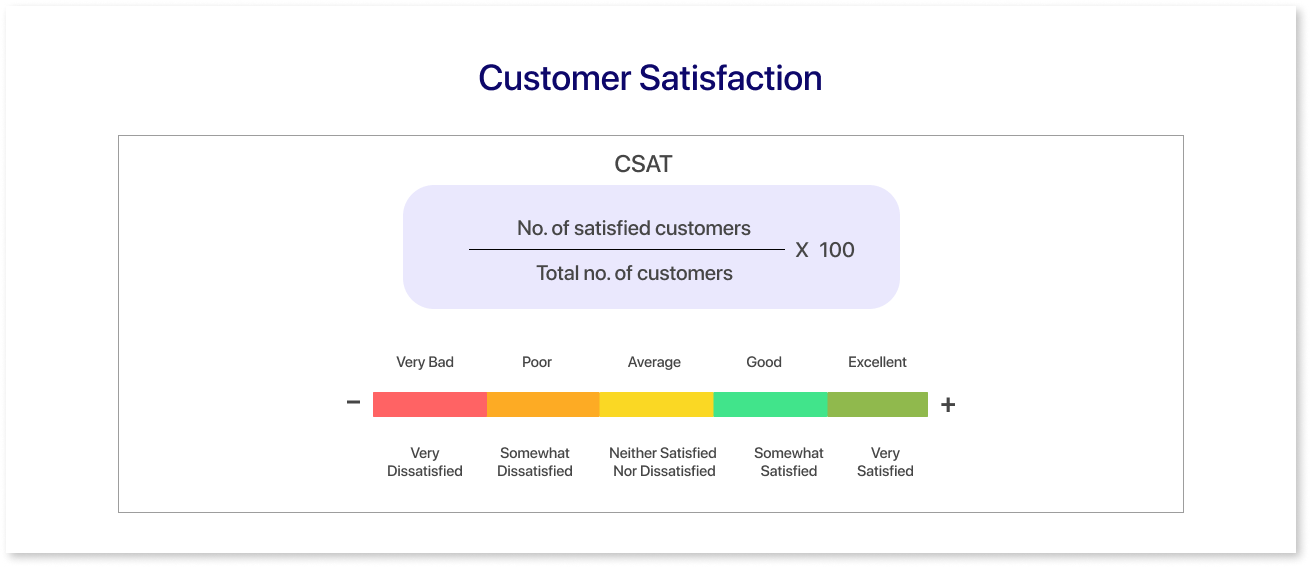
In business, keeping customers happy is like a golden rule. CSAT is a way for companies to measure how well they follow that rule. It's not just about numbers; it's about ensuring customers have the best experience possible.
So, when businesses see a CSAT score, it's a signal to take action and make changes that will make customers even happier. It's a win-win: customers get what they want, and businesses improve and grow.
Additionally, AHT, FCR, and service level are essential measures that direct operations toward providing outstanding customer service. These are call center kpis. Customer satisfaction is directly reflected in CSAT, which shows how well companies are satisfying the demands of their customers.
2. Net Promoter Score (NPS)
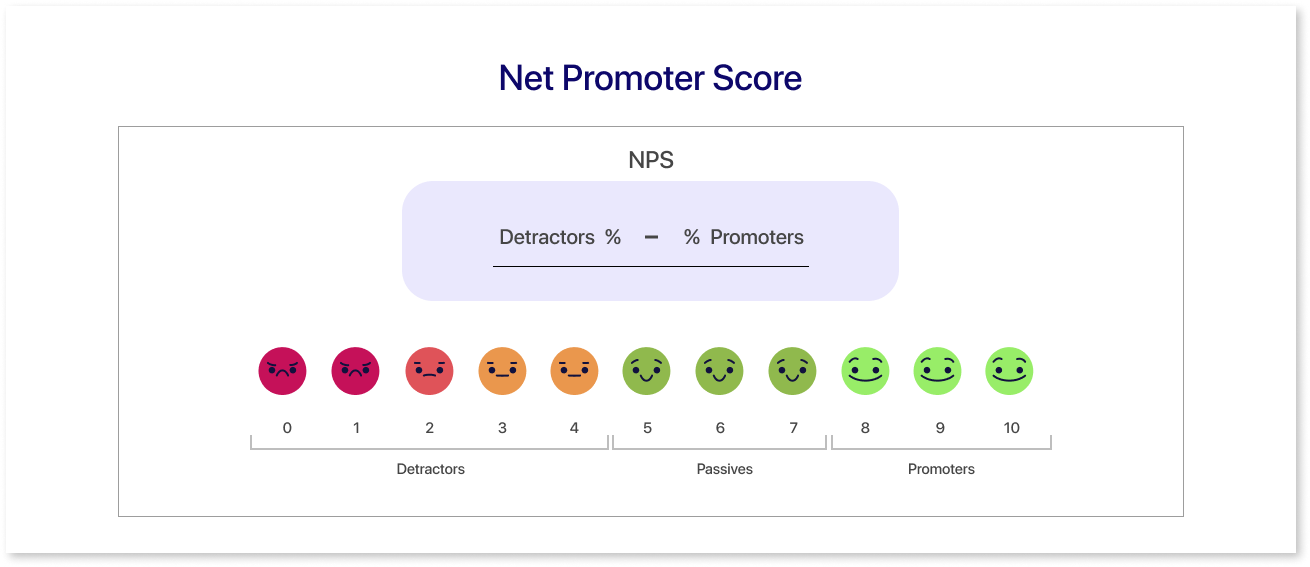
The Net Promoter Score (NPS) is like a magic number that tells businesses how much their customers love them. It's a simple way to determine if people would recommend a company to their friends. The key question in NPS surveys is often, "How likely are you to recommend us to a friend?" Customers give a score from 0 to 10.
In Net Promoter Score (NPS), customers can be categorized into three groups based on their responses to the question, "How likely are you to recommend us to a friend?"
- Detractors are customers who give scores between 0 and 6. They require proactive outreach to motigate brand damage. And are also unsatisfied and might even share negative feedback, posing a risk to a company's reputation.
- Passives are those who give scores of 7 or 8. They are suscepticle to competitive offering. They are satisfied but not overly enthusiastic and may easily switch to competitors.
- Promoters are the happiest customers, giving scores of 9 or 10. They're loyal and likely to repurchase from you. They are like brand ambassadors, enthusiastic about the company, and likely to recommend it to others. The NPS is calculated by subtracting the percentage of detractors from the percentage of promoters.

For businesses, a high NPS means customers are happy and likely to stay, bring in more customers, and keep the business growing. It's like having a fan club that boosts success.
3. First Response Time (FRT)
First Response Time (FRT) measures how quickly a company responds to a customer's inquiry or problem. Imagine you send a message, and FRT is the time it takes for the company to swoop in and help.
To calculate FRT, you clock the customer effort score to reach out to when they get the first response. The quicker, the better! A fast FRT leaves customers feeling heard and cared for.
The formula to calculate rhe first response time is:
Time of response - Time of customer request = (# Minutes/houres/days) First response time
Now, why does FRT matter so much? Well, in the world of customer experience, speed is like a secret weapon. Customers love quick solutions, and a speedy first response makes them happy. To reduce FRT, companies use smart tactics like having well-trained support teams, using automation for instant replies, and prioritizing urgent inquiries.
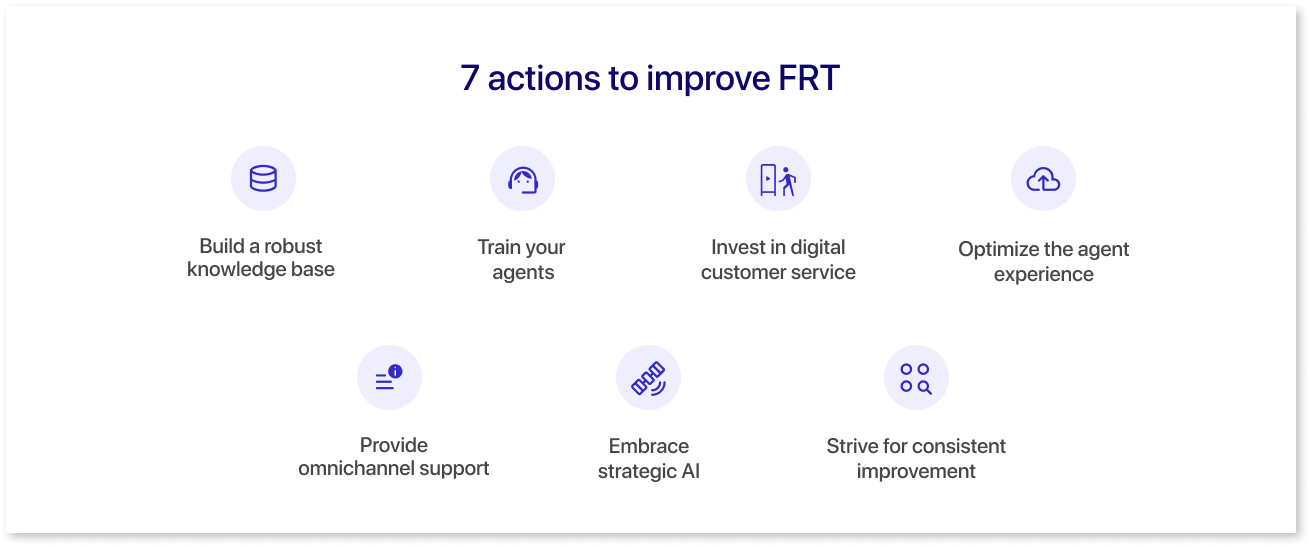
Think of FRT as the speed dial for customer satisfaction. When companies nail it, they win customers' hearts and loyalty. It's saying, "We're here for you, fast and efficient!"
4. Average Resolution Time (ART)
Average Resolution Time (ART) is like the clock that ticks from when you report a problem to when it's fixed. It measures how long it takes for a company to solve an issue once a customer brings it up. To calculate ART, you add up the time it takes to resolve different issues and divide it by the total number of issues. The lower the ART, the faster the company is at fixing things.
The formula to measure the average resolution time is:
Average Time to Resolution = Sum of all times to resolution/total # of cases resolved
Now, why does ART matter so much? Well, it's like the superhero of customer satisfaction. When issues get fixed quickly, customers are happy. Long resolution times can make customers frustrated and dissatisfied.
Improving ART is like making a customer service team more efficient. Companies use tactics like better training, using advanced tools, and having expert support staff to speed up the resolution process. It's a bit like having a team of problem-solving wizards.
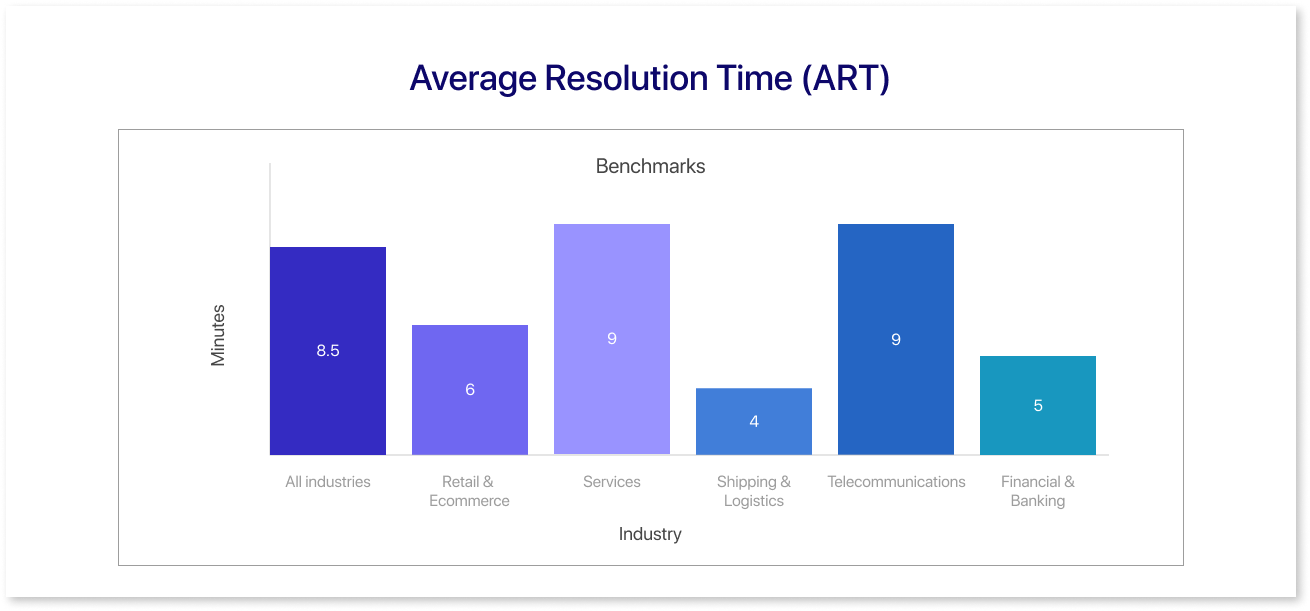
In customer service industries, such as retail or hospitality, quickly addressing concerns can turn a potentially harmful experience into a positive one. In healthcare, timely issue resolution is critical for patient satisfaction and well-being. The finance sector benefits from a fast ART to promptly address customer inquiries and resolve transaction discrepancies.
Regardless of the industry, a low Average Resolution Time is a universal indicator of efficient customer service level agreement. Companies prioritizing minimizing ART demonstrate a commitment to providing timely solutions, contributing significantly to overall customer experience and loyalty.
5. Customer Retention Rate (CRR)
The customer retention rate (CRR) is like the loyalty score for a business. It shows how good a company is at keeping customers happy and sticking around. To figure out CRR, you compare how many customers stay over a period to how many were there at the beginning. The higher the CRR, the better a company keeps its customers.
Customer Retention Rate = [(CECN) / CS] x 100
CE number of customers at the end of the period measured
CN-number of new customers during the period CS-number of customer when the measured period began
CS = number of customer when the measured period began
OR
CRR = [E-N/S] x 100
E = number of customers at the end of the period measured
N-number of new customers during the period
S = number of customer when the measured period began
Customer retention rate (CRR) is the heartbeat of a business's customer-centric strategy (CE), representing its effectiveness in keeping customers happy and loyal. By calculating CRR, companies gain insights into customer numbers (CN) over time, comparing the retained customers to the total customer base.
A high CRR signifies successful customer satisfaction (CS) efforts and a strong connection between the business and its customers. Maintaining a positive CRR involves a careful blend of excellent customer support, personalized engagement, and responsive strategies to address customer needs. Through this ongoing commitment, businesses can cultivate a loyal customer base, ensuring sustained success and fostering a positive customer experience (CE) that encourages customers to stay for the long haul.
Now, why is CRR so important? Calculating CRR is pretty straightforward: you take the number of customers at the end, minus any new ones, and divide it by the number of customers at the start. This gives the percentage of customers a business has retained.
To boost CRR, companies use smart strategies. They focus on excellent customer service dashboard, offer loyalty programs, and listen to customer feedback. It's like building a friendship with customers to make them want to stick around.
Final Thoughts
The impact of effective customer service optimization, fueled by accurate KPI tracking, extends beyond increasing customer loyalty and reducing support costs; it also contributes to overall revenue growth.
In conclusion, the significance of key performance indicators (KPIs) cannot be overstated in pursuing organizational success. Mokkup.ai emerges as a valuable ally in this journey by simplifying the process of selecting and integrating relevant KPIs into dashboard designs, thereby fostering seamless and consistent performance tracking.
Prompt it. Wireframe it with Mokkup.ai.
