
KPIs serve as the compass guiding retailers through the intricate maze of consumer behavior, supply chain management, inventory control, and overall operational efficiency. These performance metrics offer invaluable insights into various aspects of the retail industry, enabling businesses to make informed decisions, identify areas of improvement, and capitalize on emerging opportunities.
This introduction explores some of the most important KPIs for the retail industry analysis, delving into their significance, measurement methods, and how they impact overall success. From sales and customer retention to inventory turnover and online engagement, we will uncover the key metrics for the retail industry that empower retailers to not only survive but thrive in today's fast-paced and consumer-driven market. Whether you are a seasoned retail veteran or an aspiring entrepreneur, understanding and leveraging these KPIs will undoubtedly be instrumental in shaping the future of your retail venture. So, let's dive in and discover the crucial KPIs that will transform your retail business into a competitive force to be reckoned with.
Table of Contents
What is a Retail KPI?
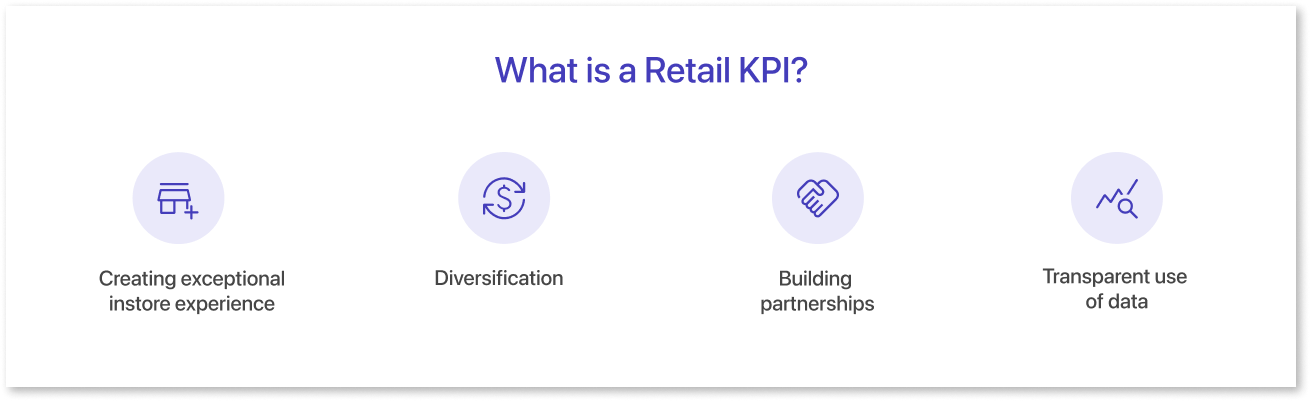
A KPI is a Key Performance Indicator that enables organizations and teams to measure their objectives in order to attain the intended outcomes. Retail KPI is a quantifiable and measurable metric used to evaluate the performance of a retail business. These are performance metrics that can be utilized in a variety of methods to track and monitor retail performance.
It is simple to lose sight of strategic objectives and their progress while managing a retail business's day-to-day operations. Retail business owners and executives may not observe a gradual decline in performance until it is too late to remedy the situation.
Therefore, it is essential to monitor the essential retail KPIs. They are used to determine if a retail business is on the correct track to achieving its objectives and the overall business strategy. In addition, they assist you in conducting benchmarking to identify areas for improvement and develop a more effective retail strategic plan to achieve your business objectives.
Using Mokkup.ai’s templates for KPIs in the retail industry is the most efficient process to create your perfect dashboard. Firstly, users can browse through a diverse range of pre-designed templates tailored specifically for retail analytics. These templates encompass a wide array of key performance indicators (KPIs) crucial for the retail sector, such as sales performance, inventory turnover, customer acquisition costs, and more. Users can easily customize these templates to align with their specific business needs by inputting their data and adjusting visual elements to match their brand identity. With Mokkup.ai's user-friendly interface and intuitive features, retailers can swiftly create comprehensive KPI dashboard wireframes that provide valuable insights, enabling them to make informed decisions and drive growth in their retail operations.
Retail KPI Examples
Retail KPIs For Understanding Sales Metrics
Sales generate revenue, making them one of the most essential and fundamental metrics to monitor. Modern retail sales are quite complicated due to the fact that they can be generated through a variety of channels, and several factors are involved.
1. Sales Per Square Foot
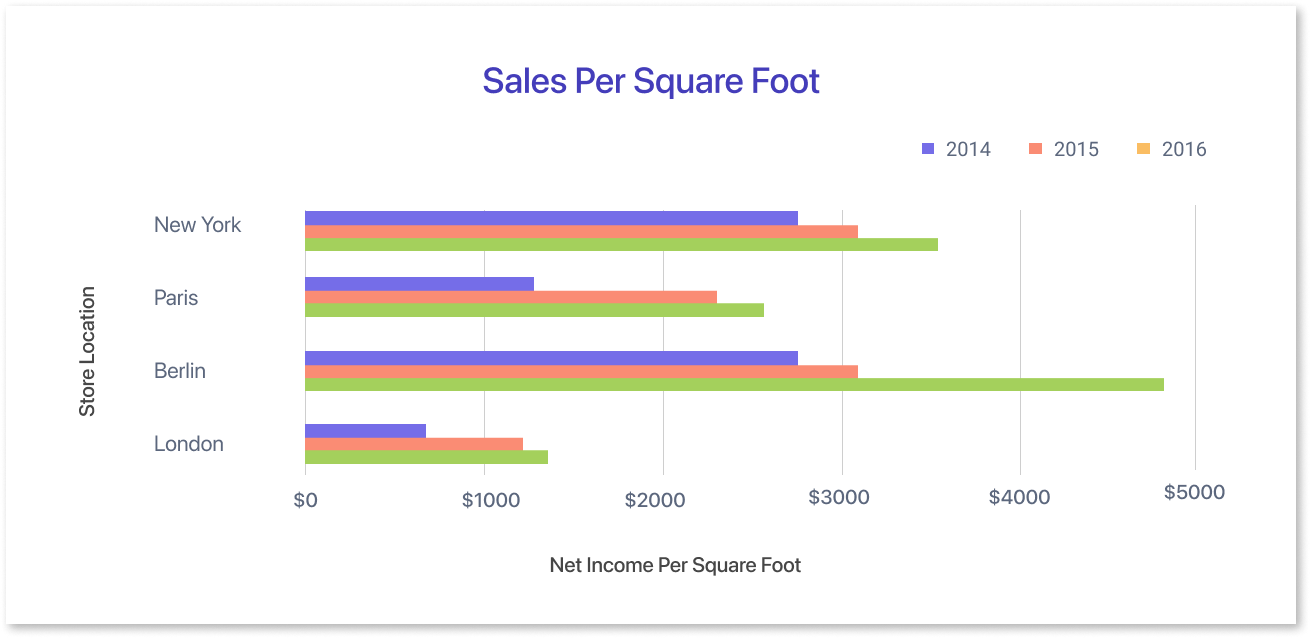
Sales per square foot is a key performance indicator used to assess the efficiency of a retail store in generating revenue relative to its retail space. Product presentation is of utmost importance to proprietors of brick-and-mortar stores. This metric is essential for assessing the effectiveness of merchandising strategies and the store's retail space utilization.
This can be determined by dividing your net sales by the sales area. By measuring sales per square foot, you can evaluate the efficacy of your merchandising strategies and make data-driven decisions to enhance the store's layout and product selection.
Formula: Total Sales / Total Selling Area
2. Sales Per Employee
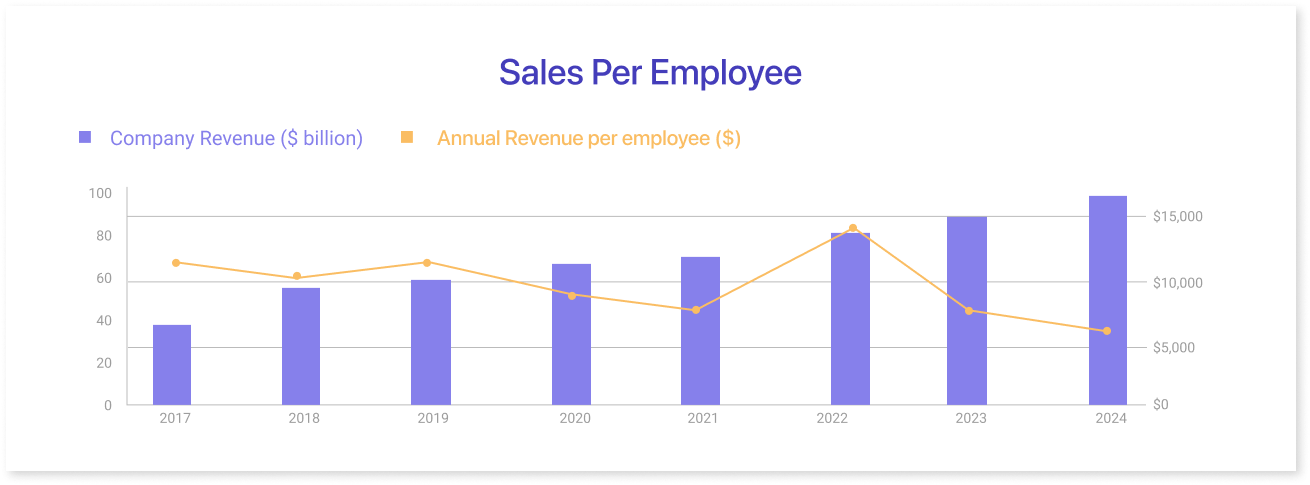
Keeping note of sales per employee enables you to monitor employee performance, investment, and revenue generated by the staff. This retail metric's data can assist with training, compensation, promotions, and hiring decisions.
Formula: Net revenue/number of employees
3. Conversion Rate
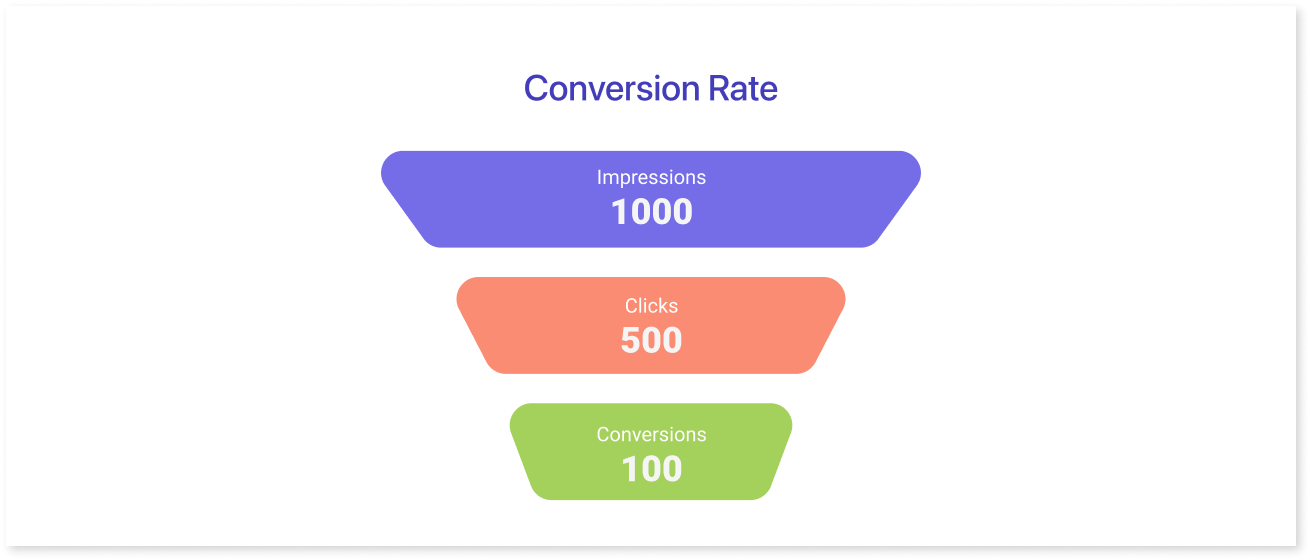
Every customer who enters your store or visits your website incurs expenses and has the potential to increase your revenue. It is essential to track the number of visits that result in sales.
This can be calculated by dividing the total number of transactions by the total number of visitors. This provides insight into the effectiveness of your sales process.
Formula: (Number of Transactions / Number of Visitors) * 100
These are the main performance indicators associated with Sales. If you maintain track of actual sales, you can determine how much revenue is coming in and make appropriate business decisions.
Retail KPIs For Understanding Customers' Behavior
Retail businesses depend on customers and need to keep them satisfied. Customer behavior determines just how successful a particular retail business is. Depending on your business, there are a few important customer success metrics to look at.
4. Foot Traffic
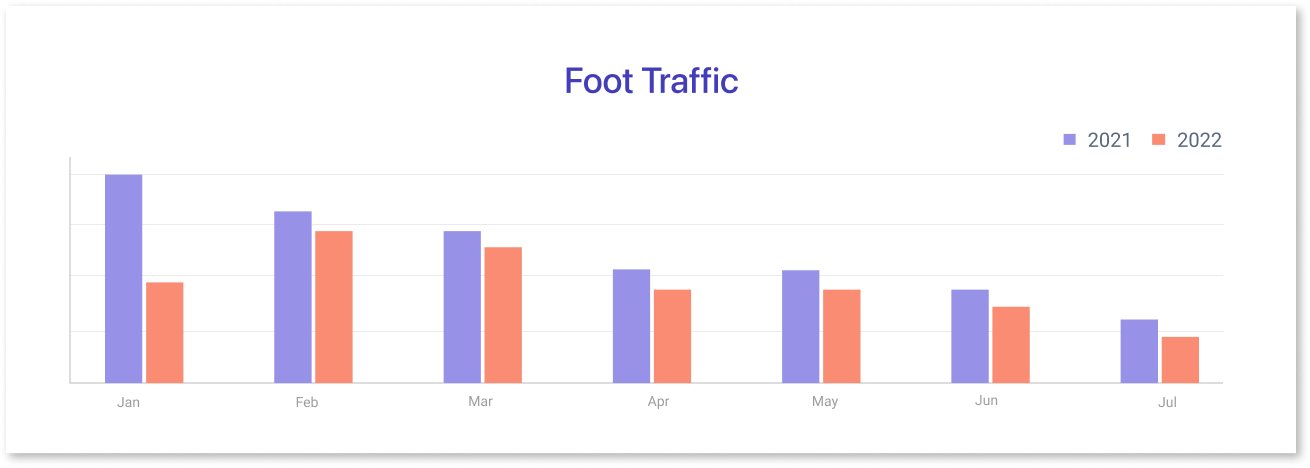
This tallies the number of customers who enter your establishment. Foot traffic helps determine the success of specific locations, advertising campaigns, and products. If you establish a branch in a location that does not receive as much foot traffic as other locations, it may not be the best location for your business.
In terms of consumer behavior and response, foot traffic provides a wealth of information. This article does an excellent job of explaining foot traffic and the numerous methods for measuring it.
Formula: Number of Visitors or People Count
5. Customer Retention Rate
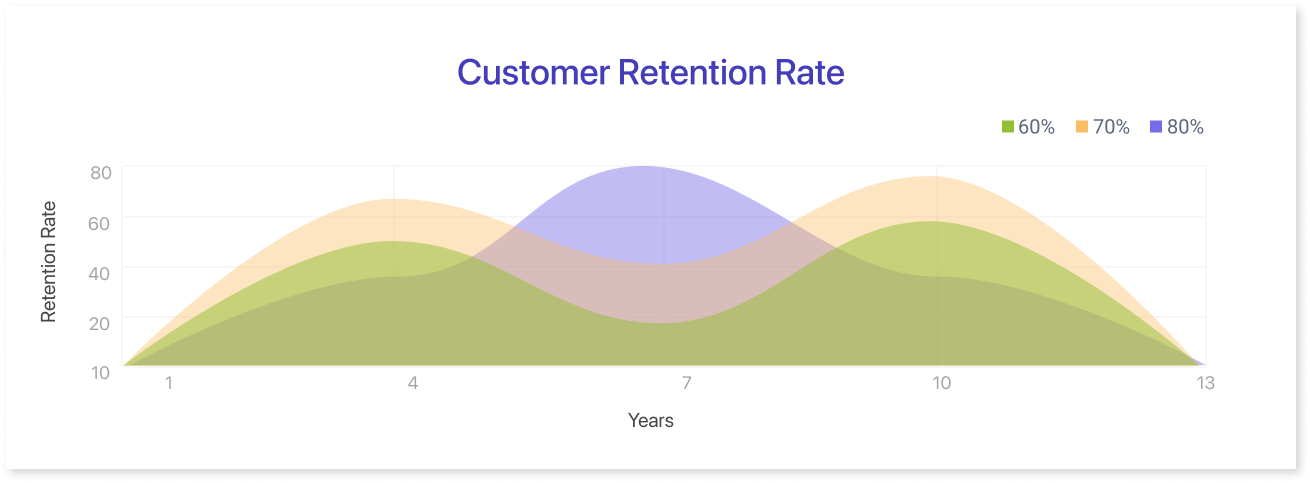
Most business proprietors are aware that repeat customers are the backbone of any retail establishment. New consumers are the most expensive to acquire, and they may not always return.
Therefore, it is essential to monitor customer retention rates. It assesses your company's ability to retain customers and assists you in making the best decisions to improve retention.
Formula: Total number of customers at the end of a period/ total number of customers at the start* 100 (do not count NEW customers in that period).
6. Customer Satisfaction
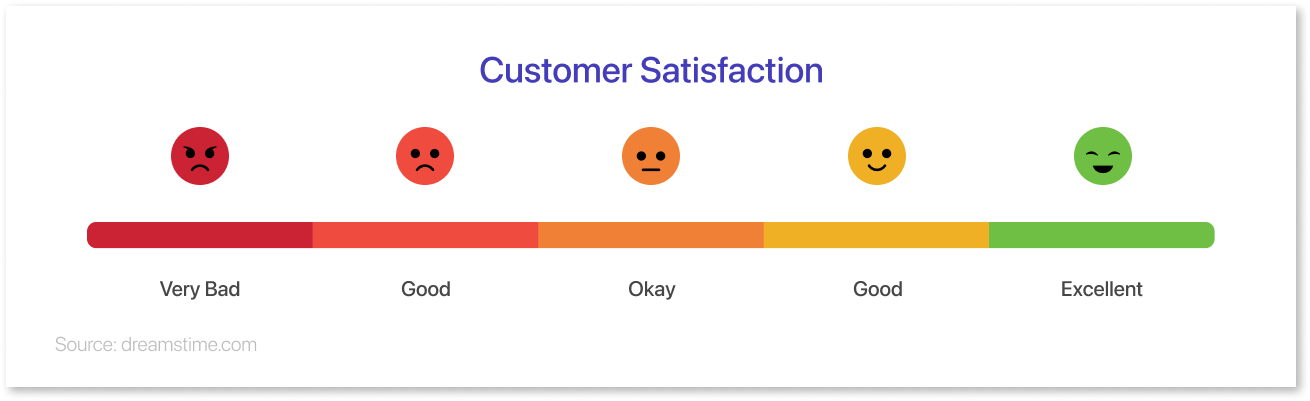
This metric correlates with customer retention because the level of service and the quality of the products sold have a direct impact on customer retention and foot traffic. This can be measured with the Net Promoter Score (NPS) and regular post-transaction surveys.
Additionally, you can examine your website's analytics to obtain valuable insight into customer behavior. On the platform, you can monitor bounce rates, dwell periods, and other comparable metrics.
Formula: (Sum of All Customer Ratings / Number of Customers) * 100
Retail KPIs For Understanding Inventory Performance
Every retail establishment must maintain sufficient inventory to meet customer demand. Inventory is one of the most important and costly investments for retail businesses, making its management essential. Here are some essential inventory KPIs to monitor:
7. Inventory Turnover
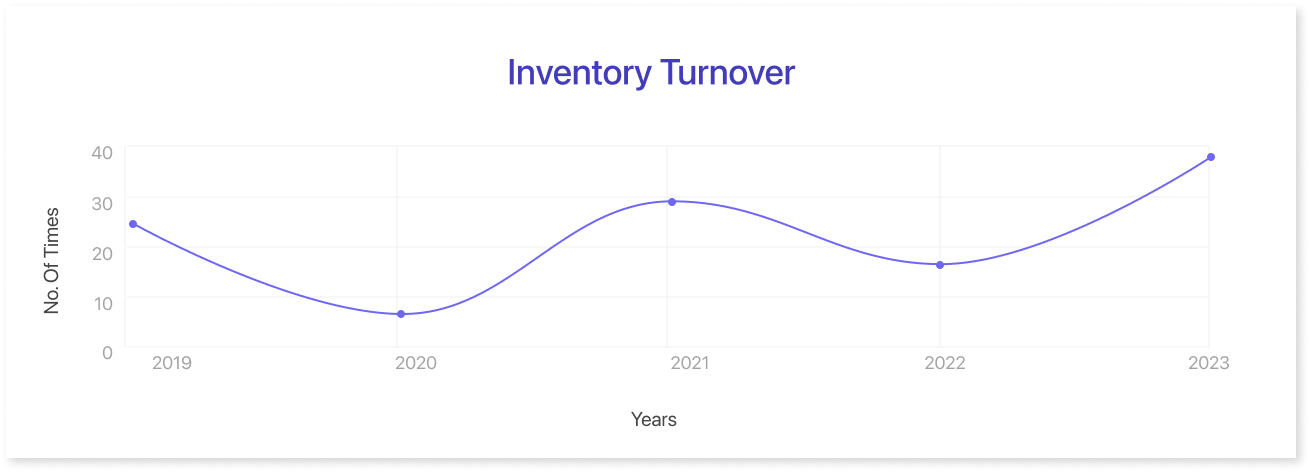
You can calculate inventory turnover using the following formula: The ratio of the cost of products sold to the average inventory.
This will provide a distinct picture of how much inventory is consumed during a given period. The lower this number, the greater the risk of deadstock or excess. If this number is too high, you may not be able to meet demand because you do not have enough products in stock.
Formula: Cost of Goods Sold (COGS) / Average Inventory Value
[Note: COGS can be found in the income statement, and Average Inventory Value is (Opening Inventory + Closing Inventory) / 2]
8. Gross Margin Return on Investment (GMROI)
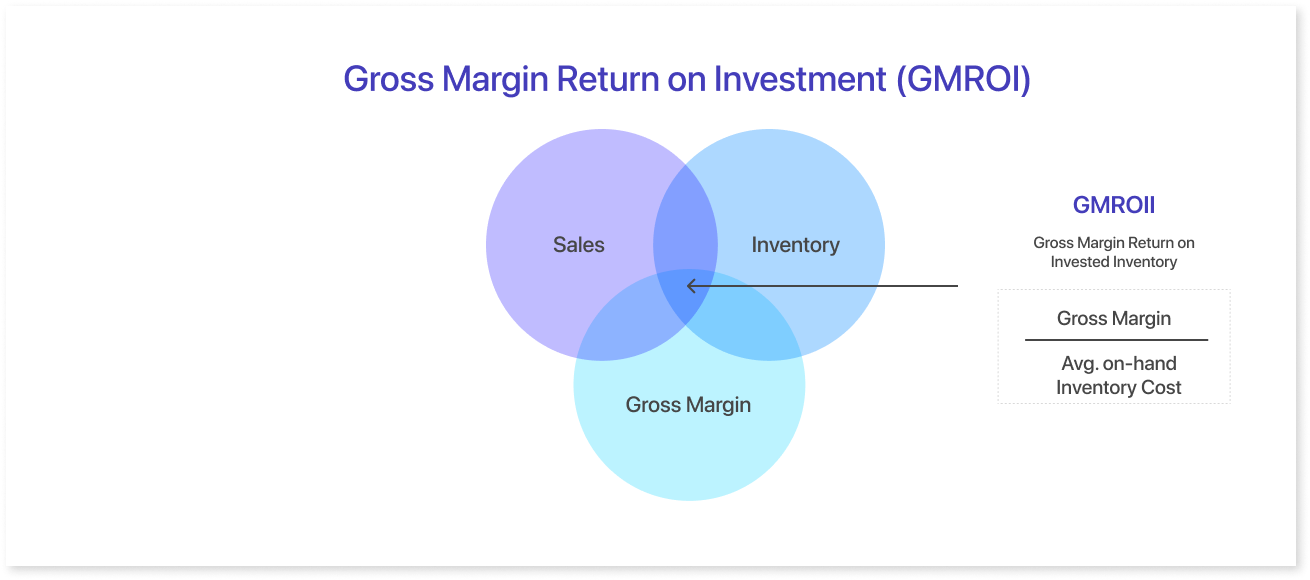
GMROI reveals the true worth of your inventory. It informs you of how much revenue your inventory has generated over a specified time period, which can help you determine whether or not your business is profitable.
As these metric measures distinct products and categories, it is straightforward to determine which products are profitable and which are not. Here is a comprehensive description and formulation of GMROI.
Formula: Gross Profit / Average Inventory Cost
9. Sell-Through
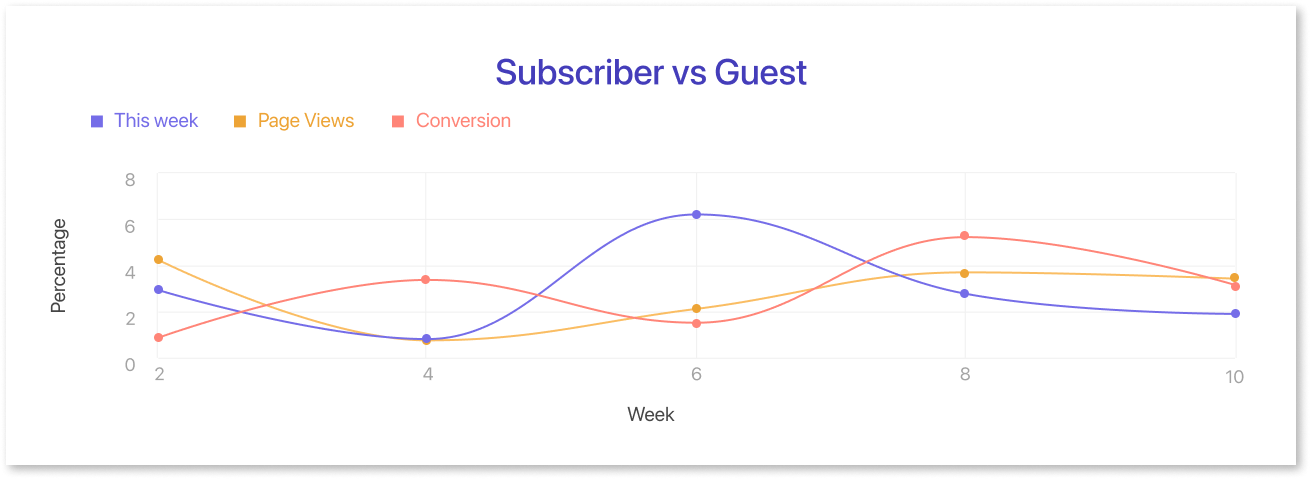
The sell-through percentage is calculated by dividing the number of units sold by the starting inventory and multiplying the result by 100.
This provides an indication of how much of your inventory is being sold in comparison to how much you initially purchased. In addition, it will help you determine which products are performing well and which may require additional consideration.
Formula: (Number of Units Sold / Initial Number of Units Available for Sale) * 100
10. Shrinkage
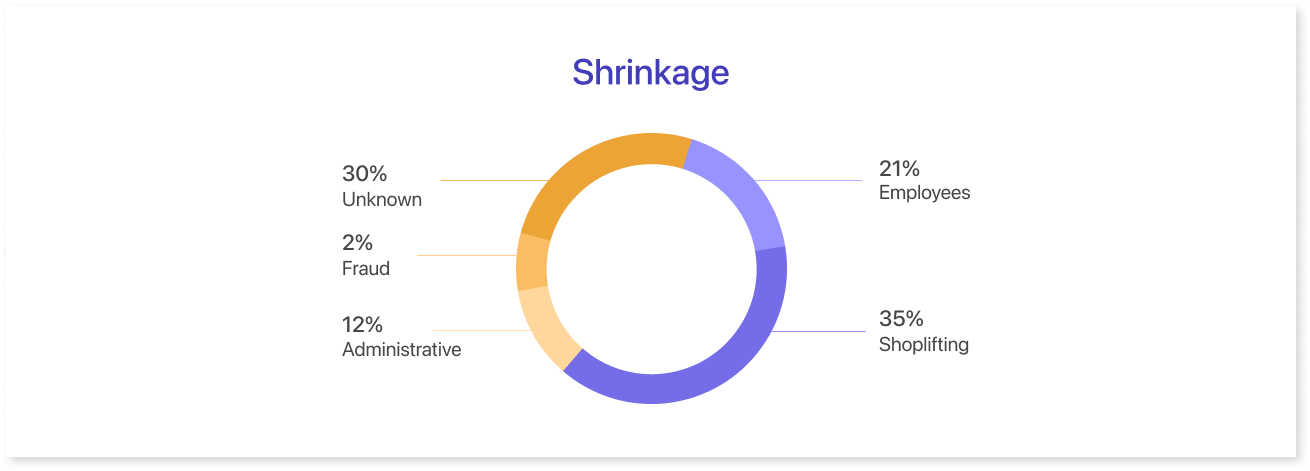
In retail, shrinkage is utilized as a key performance indicator (KPI) to measure the amount of inventory that is lost or taken during normal business operations. It is determined by dividing inventory losses by the quantity of inventory that should be on hand.
There are numerous causes of shrinkage, including larceny, administrative errors, and damage. High levels of attrition can have a substantial effect on a retailer's bottom line, as it represents revenue that could have been reinvested in the business.
Formula: Shrinkage = (Value of Inventory Loss / Total Sales) * 100
[Note: Inventory loss can be due to theft, damage, or other factors]
Retail KPIs For Understanding Transactional Data
The only thing that matters is money, and business owners want to maintain track of it. You desire to understand your profit margins, return on investment, investments, etc. The following key performance indicators (KPIs) provide insight into how much money your business earns or spends:
11. Gross and Net Profit
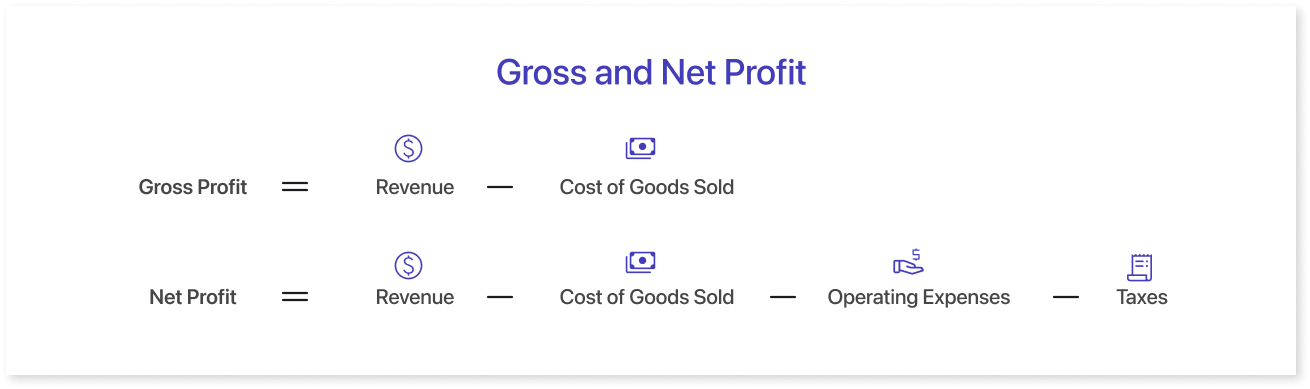
Gross profit indicates the amount of money a business has earned after deducting product creation and sales costs. Profit earned after deducting all business expenses is the net profit.
Formula: Gross profit = Total revenue - The Cost Of Goods Sold (COGS)
Net profit = Gross Profit - Operating Expenses - Other Business Expenses - Taxes - Interest on Debt + Other Income
Each provides insight into your income and expenses. The data from these metrics can assist you in allocating resources, planning cost reductions, and implementing appropriate business strategies.
12. Average Transaction Value
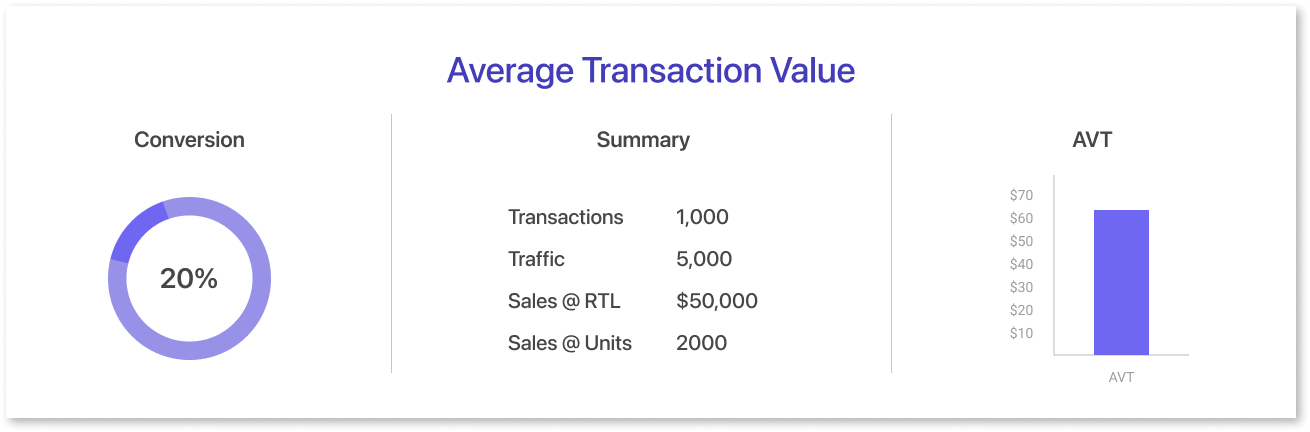
This retail metric indicates the average amount consumers spend on your products. A high transaction value indicates that customers purchase more expensive products.
A low value indicates that your customers purchase fewer items or lower-priced products. This offers insight into the character of your customer's interactions with your company and can inform pricing and product strategies.
Formula: Total Sales Revenue / Number of Transactions
It is also advisable to monitor the expense and profit of each sales lead. It can provide insight into how various categories of leads move through your sales cycle and translate into revenue.
This metric will also help you determine where your marketing campaigns need to be optimized to attract more prospects at a lower cost.
eCommerce KPIs
Have you considered starting an eCommerce line of business? For a retail business, this is no longer a question but a necessity.
Here are three important eCommerce KPIs that you should be tracking:
13. Cost per Acquisition (CPA)
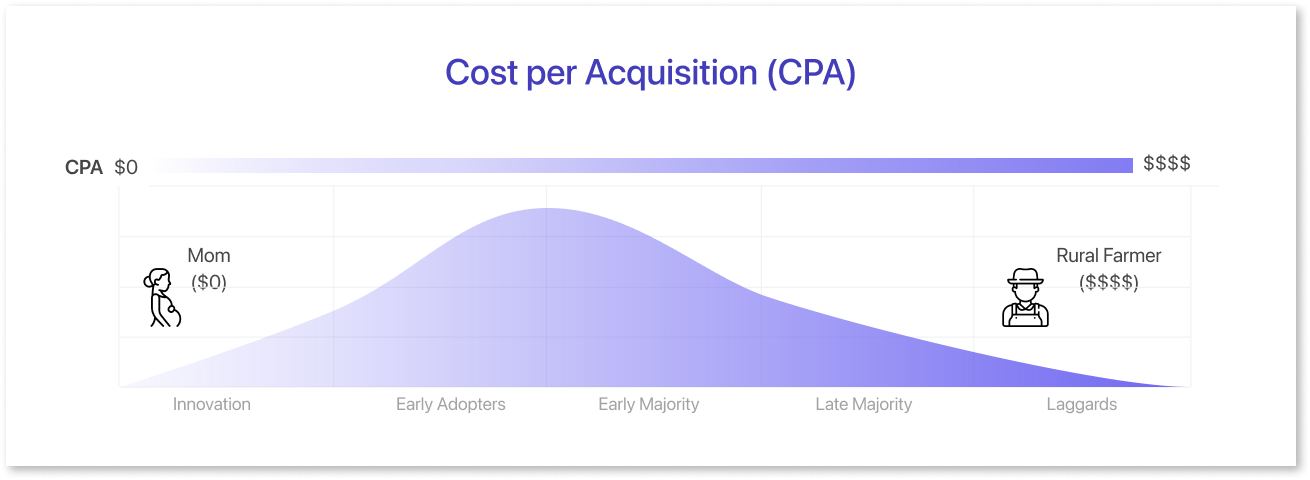
CPA is the quantity spent on advertising and marketing to acquire a new customer. This metric is essential because it helps you determine the profitability of your marketing campaigns and the cost of acquiring new customers.
Formula: Total Marketing Cost / Number of New Customers Acquired
14. Cart Abandonment Rate
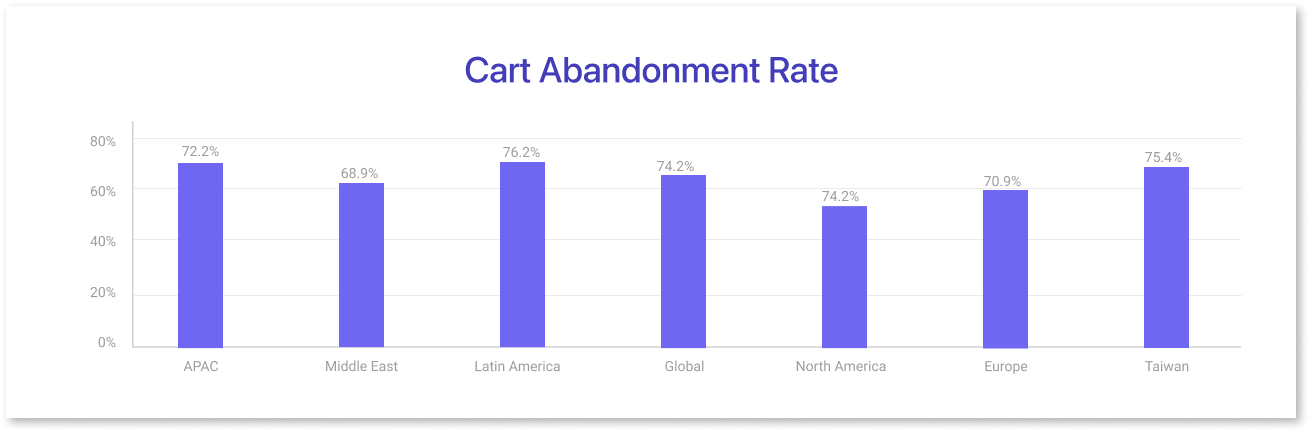
The cart abandonment rate is the proportion of customers who place items in their shopping cart but then exit the website without completing the transaction.
This metric is essential because it provides insight into the customer experience and can assist in identifying purchase barriers. You can increase sales and revenue by enhancing the purchasing process and lowering the cart abandonment rate.
Formula: (Number of Carts Abandoned / Number of Carts Created) * 100
15. Customer Lifetime Value (CLV)
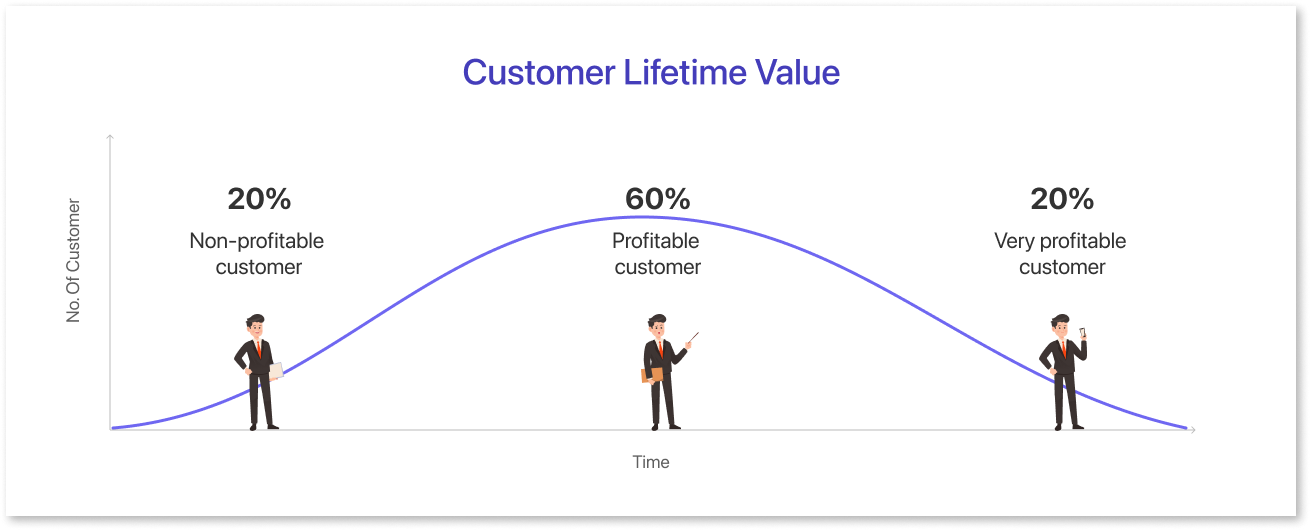
CLV is the total amount a customer is anticipated to spend on your products or services over their lifetime.
This metric is essential because it enables you to comprehend your consumers' worth and make data-driven decisions regarding customer retention and loyalty programs.
Formula: (Average Revenue per Customer per Year * Average Customer Lifespan) - Customer Acquisition Cost
How to Track Retail KPIs With Mokkup.ai?
Mokkup.ai offers pre-made templates that can be used to create dashboards and reports. They are a great way to save time and effort when creating retail KPI dashboards, as you can customize them to your specific needs.
There are many mokkup templates available for the retail industry, covering a wide range of KPIs. Some of the most common KPIs tracked in the retail industry dashboards include:
- ROI (Return on Investment): This metric measures how much profit a retailer makes from its investments. It is calculated by dividing the net profit by the total investment. A high ROI indicates that a retailer is making good use of its resources.
- Back Order Rate: This metric measures the percentage of orders that cannot be fulfilled because the product is not in stock. A high back order rate can indicate that a retailer is not managing its inventory effectively.
- Lost Revenue: This metric measures the amount of revenue that is lost due to factors such as out-of-stock products, customer returns, and fraud. A high lost revenue rate can indicate that a retailer is not optimizing its sales opportunities.
- Sell-Through Rate: This metric measures the percentage of products that are sold from inventory. A high sell-through rate indicates that a retailer is effectively managing its inventory and meeting customer demand.
- Rate of Return (Inbound): This metric measures the percentage of returned products to a retailer. A high rate of return can indicate that a retailer is selling products that are not meeting customer expectations.
To use a mokkup template for KPIs in the retail industry, you will need to:
- Choose a mokkup template that covers the KPIs you want to track.
- Customize the template to your specific needs.
- Share the template with your team or stakeholders.
Mokkups are a great way to create professional-looking dashboard wireframes that can help you track your KPIs and make informed decisions about your business.
Summing Up
In conclusion, key performance indicators (KPIs) play a critical role in guiding the success and growth of retail industries. By focusing on the right customer acquisition metrics, retailers can gain valuable insights into their performance, customer behavior, and overall business health. Some of the crucial KPIs for the retail market include sales conversion rate, customer retention rate, inventory turnover, average transaction value, and gross profit margin, among others. These KPIs help retailers to make informed decisions, optimize operations, enhance customer experiences, and stay competitive in a dynamic market. Moreover, by regularly monitoring and analyzing these KPIs, retailers can identify trends, spot opportunities, and address challenges promptly, leading to improved efficiency, increased profitability, and sustained business growth. Embracing a data-driven approach and leveraging these essential KPIs will empower retailers to thrive in an ever-evolving industry and better meet the demands of their customers in the long run.
Prompt it. Wireframe it with Mokkup.ai.
