
What Are E-commerce KPIs?
The Key Performance Indicators (KPIs) serve as the compass that guides online businesses toward growth, profitability, and customer satisfaction. By tracking and analyzing these metrics, e-commerce companies can gain valuable insights into their performance, identify areas for improvement, and make informed strategic decisions. In this article, we will explore the importance and purpose of e-commerce KPIs, shedding light on why they are essential for online businesses.
Ecommerce KPIs are metrics used to assess and evaluate an e-commerce business's performance and success. These KPIs provide helpful information about the online store's operations, customer behavior, and financial health.
Table of Contents
- Which E-commerce KPIs Should You Focus on?
- How to Choose Which E-Commerce KPIs to Measure?
- Top 15 KPIs for Ecommerce KPIs
- The Best Tools for Tracking E-commerce Analytics
Which E-commerce KPIs Should You Focus on?
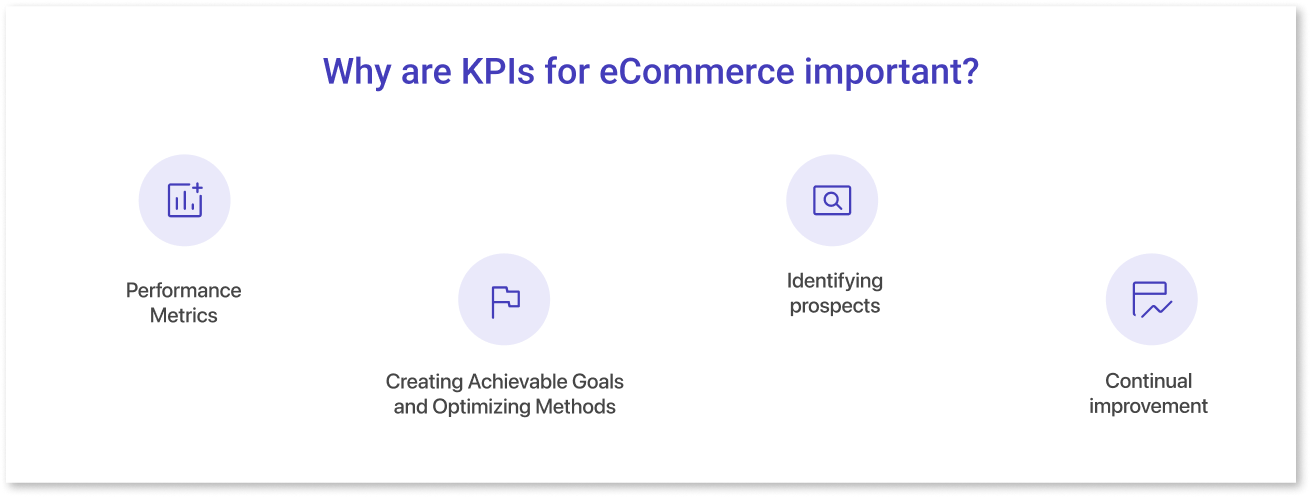
E-commerce key performance indicators help you determine where to focus your efforts and provide insights into how to solve difficulties. Finally, they will assist you in deciding what changes you need to make to increase your customer base and earn more money. Some points are briefly explained below:
- Performance Metrics: E-commerce KPIs allow organizations to track and measure performance accurately. Online merchants can get a clear view of their business health by tracking key indicators. Monitoring metrics like conversion rates, average order value, and customer acquisition cost helps identify areas that need attention and improvement.
- Creating Achievable Goals and Optimizing Methods: These indicators enable firms to set realistic goals and align their efforts to meet them. E-commerce organizations can make data-driven decisions to refine marketing efforts, improve website usability, expand product offers, and optimize supply chain management by identifying underperforming areas.
- Identifying Prospects: Online businesses can identify the most profitable client categories, customize marketing efforts to target specific demographics, and execute tactics to promote customer loyalty and repeat purchases by studying customer acquisition, retention, and lifetime value metrics.
- Continual Improvement: Businesses can spot trends, recognize patterns, and quantify the impact of implemented changes by frequently monitoring and evaluating these indicators. This iterative strategy enables e-commerce businesses to constantly fine-tune their strategies, optimize performance, and stay ahead of the competition.
KPIs provide actionable insights that help with educated decision-making. Businesses may discover bottlenecks, optimize user experience, and allocate resources effectively by measuring indicators such as cart abandonment rates, website traffic sources, and return on advertising spend. These data-driven decisions result in enhanced efficiency, lower expenses, and higher revenue.
How to Choose Which E-Commerce KPIs to Measure?
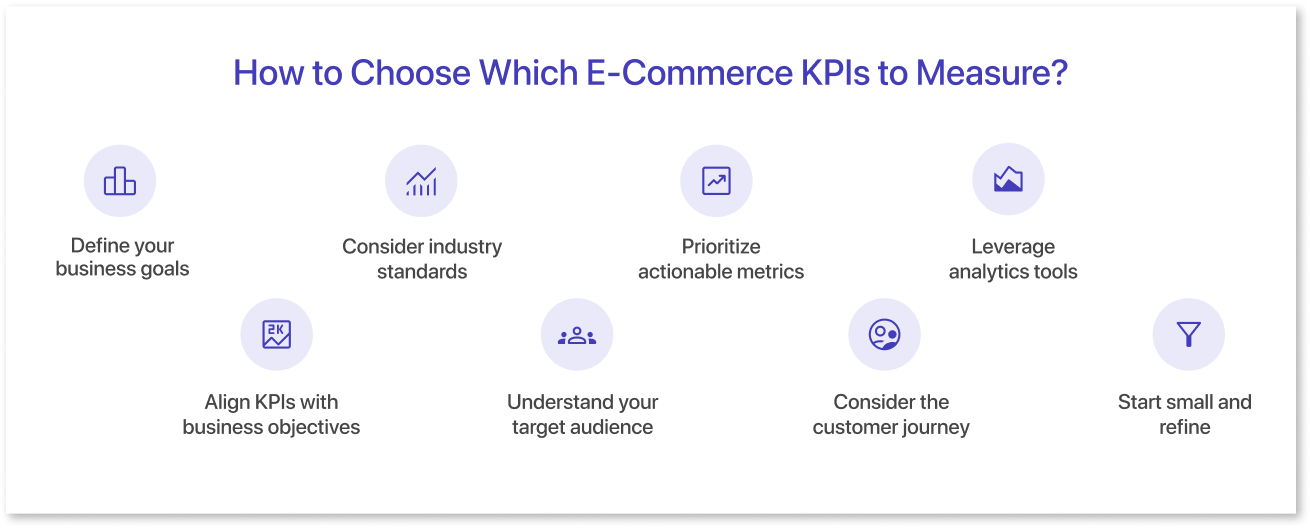
Choosing the right KPIs for your e-commerce business is crucial for effectively measuring your performance and making informed decisions. Here are some steps to help you select the appropriate KPIs:
- Define your business goals: Start by clearly defining your overall business objectives. What do you want to achieve with your e-commerce store? Such as increasing sales revenue, improving customer retention, expanding market share, or enhancing operational efficiency.
- Align KPIs with business objectives: Once you have defined your business goals, identify the specific areas or metrics that directly contribute to those goals. For key metrics example, if your goal is to increase sales revenue, relevant KPIs may include conversion rate, average order value, or revenue per customer.
- Consider industry standards: Research industry benchmarks and standards to gain insights into common KPIs similar to e-commerce business. This can provide a baseline for comparison and help you identify areas where you may need to improve.
- Understand your target audience: Analyze your target audience and customer behavior to determine which KPIs are most relevant. For instance, if your e-commerce business targets a younger demographic, metrics related to social media engagement or mobile traffic may be more important.
- Prioritize actionable metrics: Focus on KPIs that provide actionable insights and enable you to make meaningful changes. Choose metrics that can be influenced and improved through strategic decisions and actions. Avoid vanity metrics that may look impressive but don't directly impact your business outcomes.
- Consider the customer journey: Evaluate the different stages of the customer journey, from awareness to purchase and beyond. Identify key touchpoints and interactions critical to your e-commerce business's success. Then select KPIs that help you monitor and optimize those touchpoints, such as click-through rates, cart abandonment rates, or customer lifetime value.
- Leverage analytics tools: Use analytics tools like Google Analytics, Shopify, or other specialized e-commerce platforms to collect and analyze data. If your e-commerce store is built on Shopify, it offers detailed analysis with preconfigured ecommerce KPI dashboards and reports, helping you track key metrics efficiently and make informed business decisions.
- Start small and refine: It's better to start with a few key KPIs initially and gradually expand your tracking as you gain insights and experience. Monitor the selected KPIs consistently and refine your measurement strategy based on the results and your evolving business needs.web
Remember that the selection of KPIs should be tailored to your specific e-commerce business and its unique objectives. Regularly evaluate and adjust your KPIs as your business evolves and new goals emerge.
Top 15 KPIs for Ecommerce KPIs
We've pulled together some high-level ecommerce KPI examples that most top online retailers will closely watch. These metrics provide insights to indicate the success of most e-commerce businesses, regardless of their online maturity.
1) Website Traffic
Website traffic is a vital metric for online businesses, as it directly correlates with potential customers and sales. It refers to the number of people who visit your website within a specific timeframe. High website traffic indicates that your website is reaching a wider audience, increasing the chances of attracting potential customers and generating sales.
To calculate website traffic, you can use the following formula:
Website Traffic = Unique Visitors + Returning Visitors
2) Page views per visit (PV/V)
Page views per visit or PV/V is a crucial metric for online businesses. It measures the average number of pages a visitor views during a single visit to your website. A high PV/V indicates that visitors are engaging with your content and exploring different pages, which is a good sign for your business. It can also indicate that your marketing efforts are driving quality traffic to your site.
Formula:
Page Views Per Visit = Total Page Views / Total Visits
3) Conversion Rates
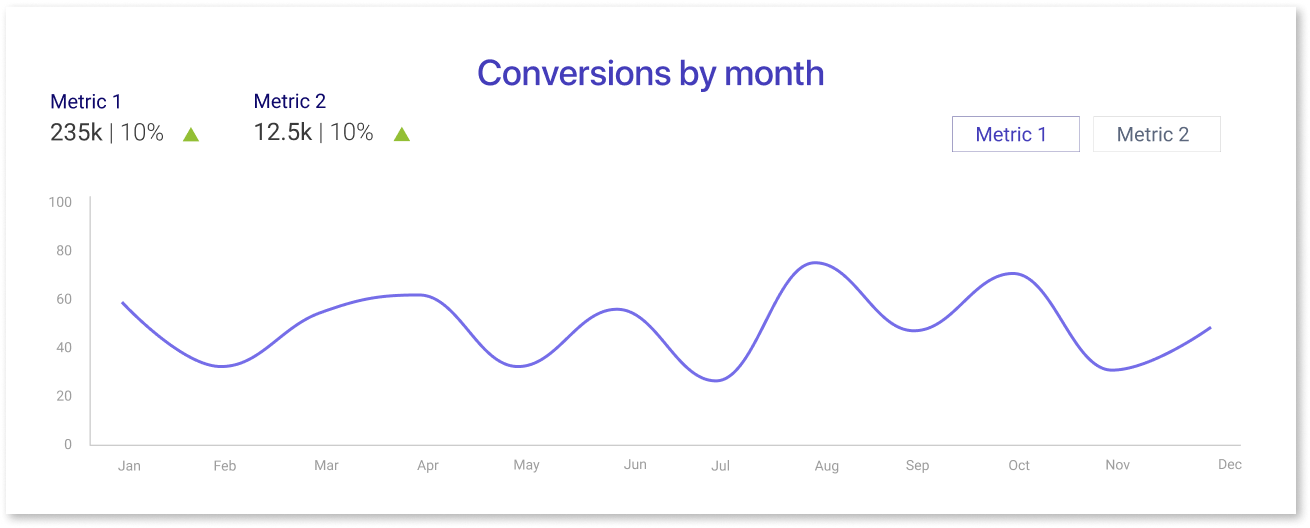
Conversion rates show how many people in your target market complete the desired action, like clicking a social media link, appearing in Google search results, or making a purchase on your website.Track KPIs like newsletter sign-ups, account creations, loyalty program enrollments, and product purchases to assess website engagement and drive conversions. These actions are key steps in moving customers closer to making a purchase.
Monitor ecommerce conversion rates when updating your website or third-party listings to assess content performance and account for traffic fluctuations. These rates can also help identify issues like product cannibalization with new product lines.
Conversion Rate = (Conversions ÷ Visitors) x 100
4) Customer Acquisition Cost (CAC)
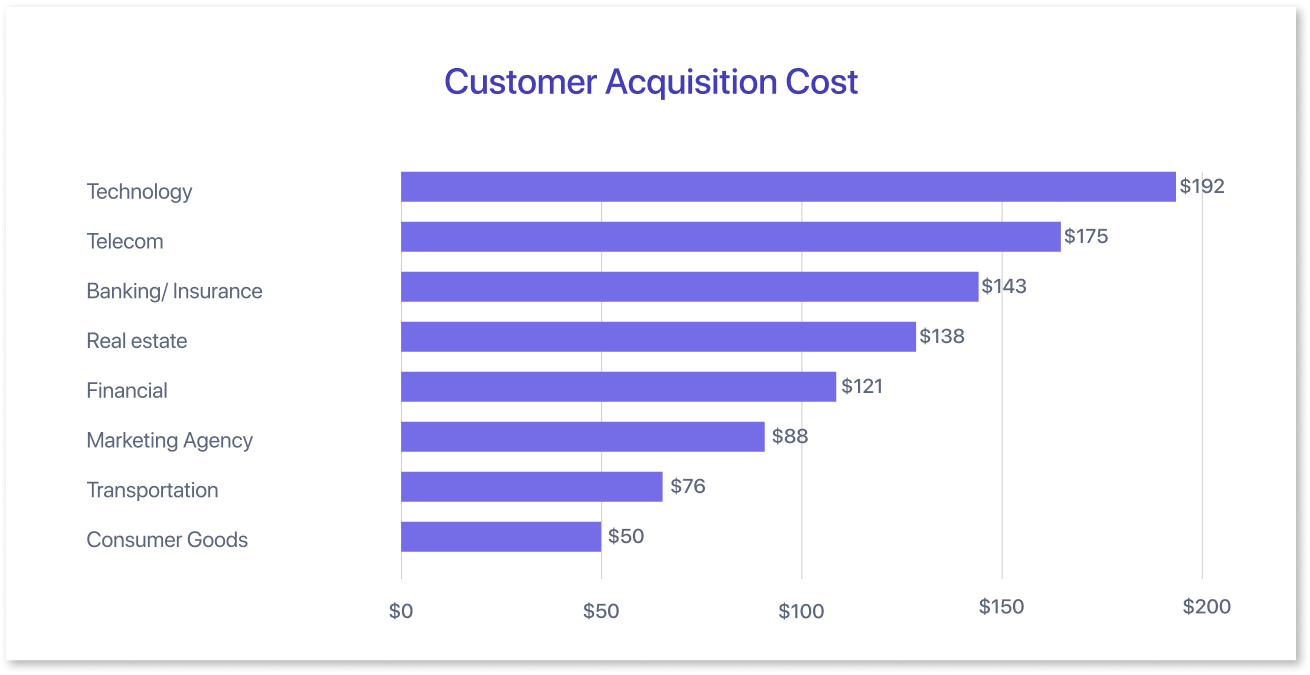
CAC indicates how much you must pay to gain a single new customer. To calculate CAC, divide the amount of money spent on acquiring new customers (often the majority of your marketing expenses) by the number of consumers acquired within the same period.
CAC = Cost of customer acquisition ÷ customers acquired
5) Cost per Acquisition (CPA)
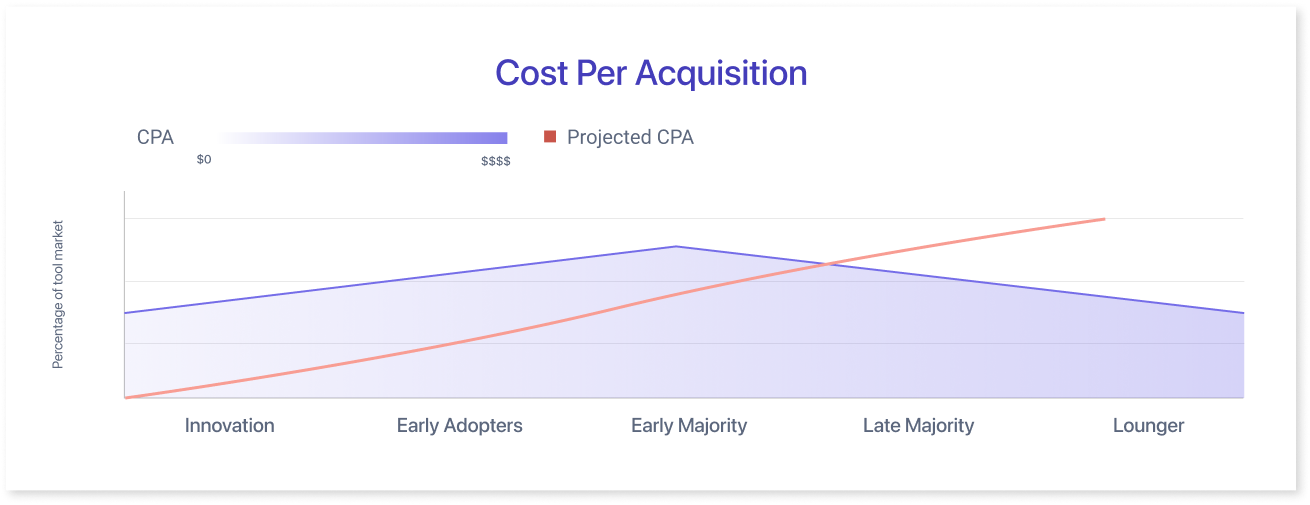
This is similar to the above CAC KPI. However, CPA considers the expense of gaining new leads and non-paying users as well as the cost of acquiring paying consumers. Simply divide the total cost of purchasing by the number of conversions obtained to determine.
CPA = Costs of conversion acquisition ÷ number of conversions
6) Average Order Value (AOV)
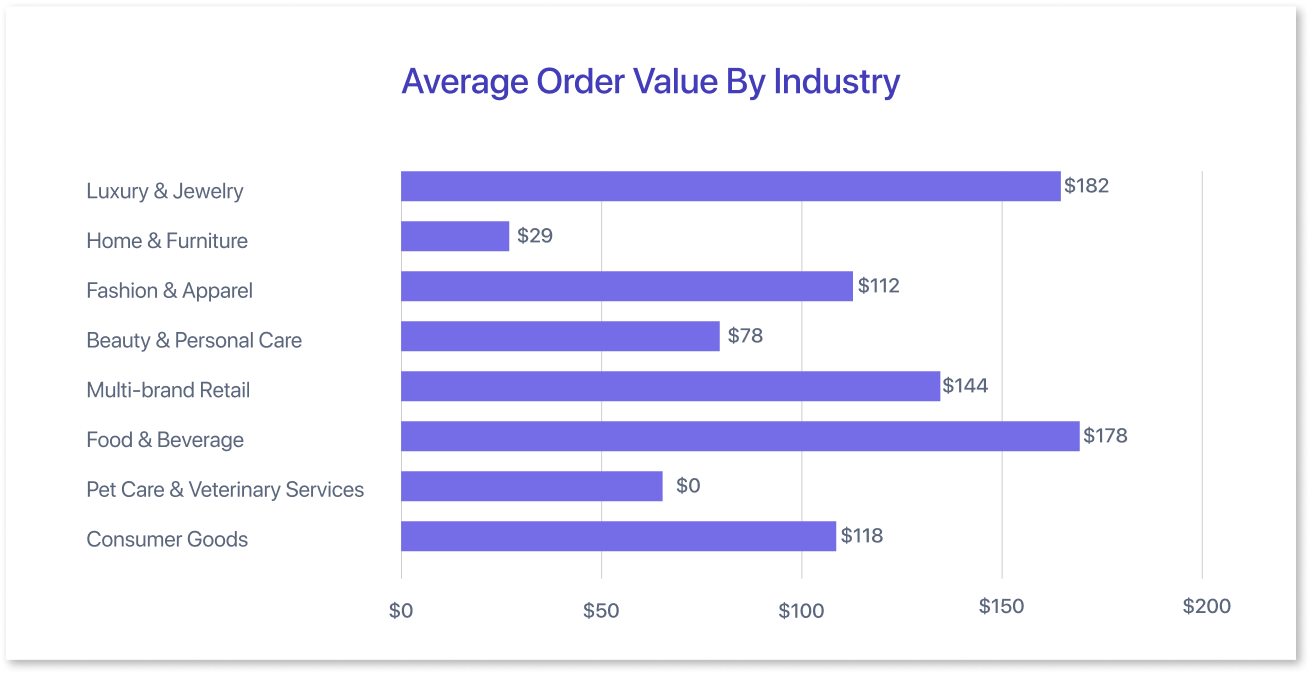
AOV is a vital metric for e-commerce businesses because it reveals how much each customer spends on average when they make a purchase. It's calculated by dividing the total revenue generated by the total number of orders placed within a specific period. By tracking AOV, businesses can assess customer value, evaluate marketing effectiveness, and optimize sales strategies to increase revenue and profitability.
Formula:
AOV = Total Revenue / Total Number of Orders
7) Customer Lifetime Value (CLTV)
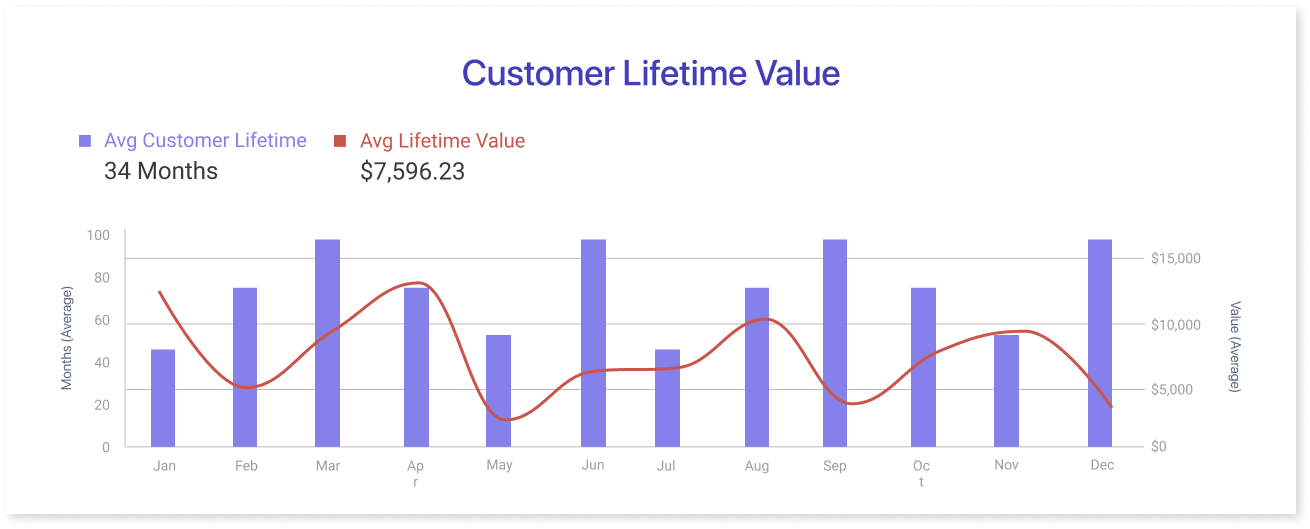
CLTV is a crucial metric for e-commerce businesses. It measures the total revenue a customer generates over their entire relationship with a company. Essentially, it tells you how much a customer is worth to your business. CLTV is important because it helps you understand the long-term value of your customers. By knowing the CLTV, you can make informed decisions about marketing, customer service, and product development. For example, you might focus on retaining high-CLTV customers or developing new products that appeal to them.
The CLTV formula:
CLTV = Average order value * Average number of orders per customer * Customer lifetime in months
8) Product Performance KPIs
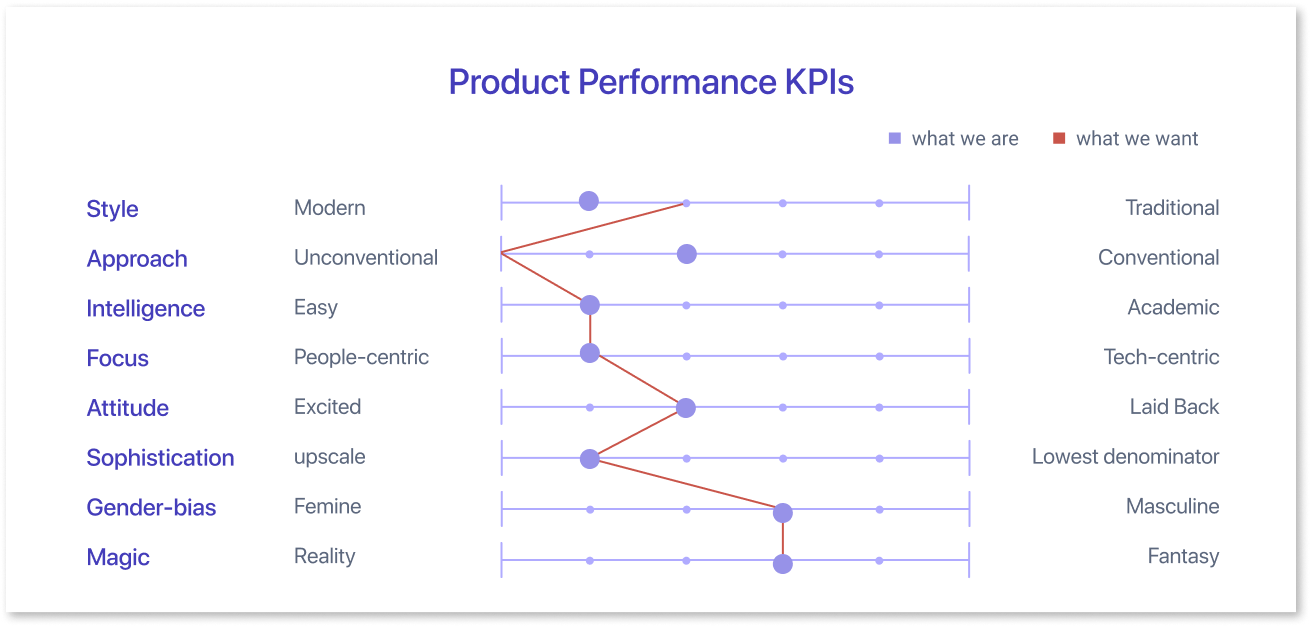
Focusing on product-level KPIs helps you understand how each item contributes to your overall sales. Metrics like sales per product, views per product, or seasonal trends provide deeper insights for e-commerce managers. You can also consider category-specific KPIs to assess group performance. However, using multiple attribution platforms can make it challenging to determine if your products are converting traffic at higher rates or if the performance varies by source.
9) Cohort Analysis
Cohort analysis is a powerful tool for e-commerce businesses to track customer behavior and identify trends over time. It involves grouping customers based on shared characteristics, such as when they first made a purchase, and then analyzing their behavior over a specific period. By examining cohorts, businesses can gain valuable insights into customer loyalty, repeat purchase rates, and the effectiveness of marketing campaigns.
One common metric used in cohort analysis is the repeat-customer rate, which measures the percentage of customers who make a second purchase after their initial order.
10) Net Promoter Score
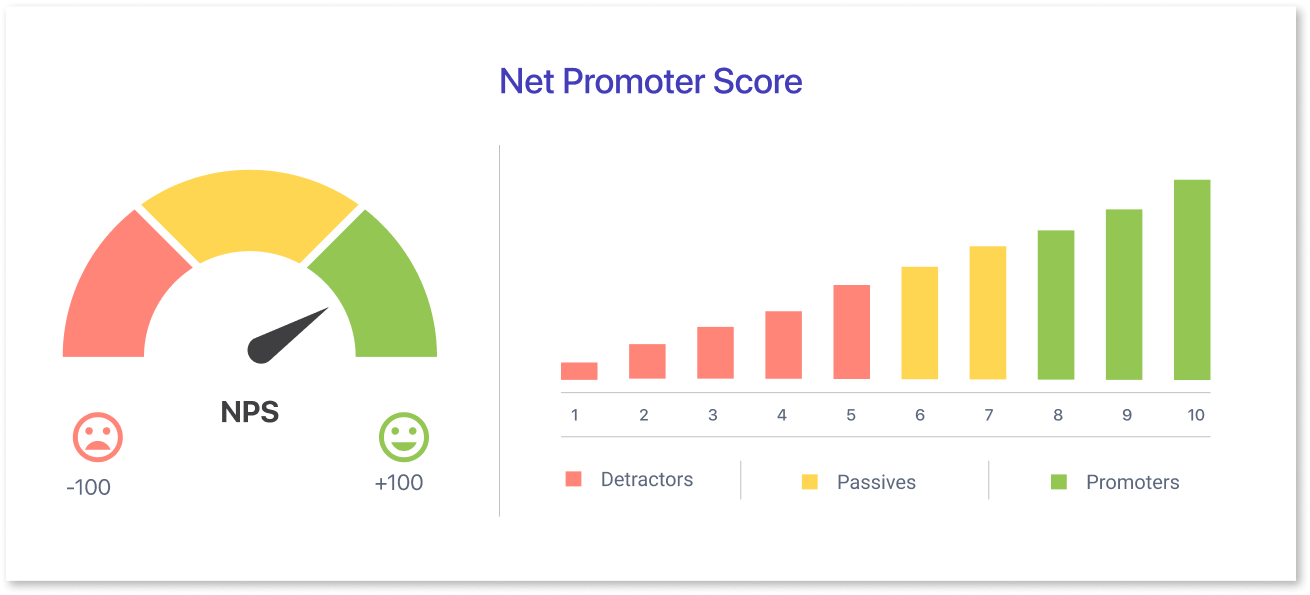
Most of the e-commerce indicators we've examined thus far are concerned with the financial element of producing revenue and profit. Net Promoter Score is an essential ecommerce performance metrics that measures the customer experience from a different angle. The following equation can be used to calculate your NPS:
NPS = % of Promoters – % of Detractors
11) Cost of Goods Sold (COGS)
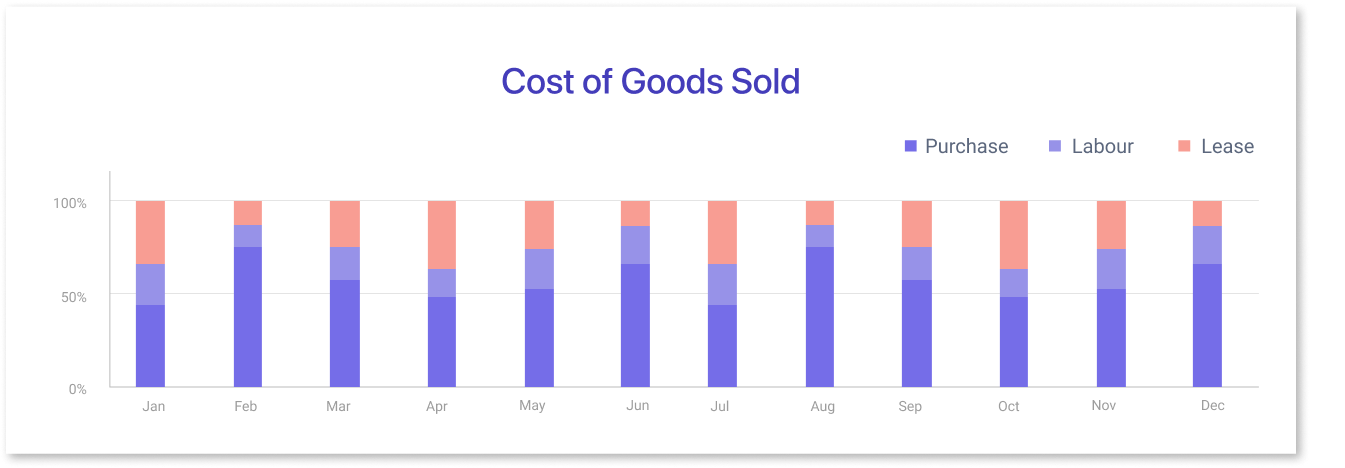
COGS is a critical measure for all sizes of online businesses. It is an assessment of the direct expenses associated with creating the goods that you sell, also known as the 'cost of sales.'
It is a retail performance statistic that assists online retailers in understanding their manufacturing and production expenses. It does not account for overhead or marketing expenses. It is important to note that COGS will vary based on the accounting standards utilized in the computation.
COGS = Beginning Inventory + Sales − Ending Inventory
12) Return on Ad Spend (ROAS)
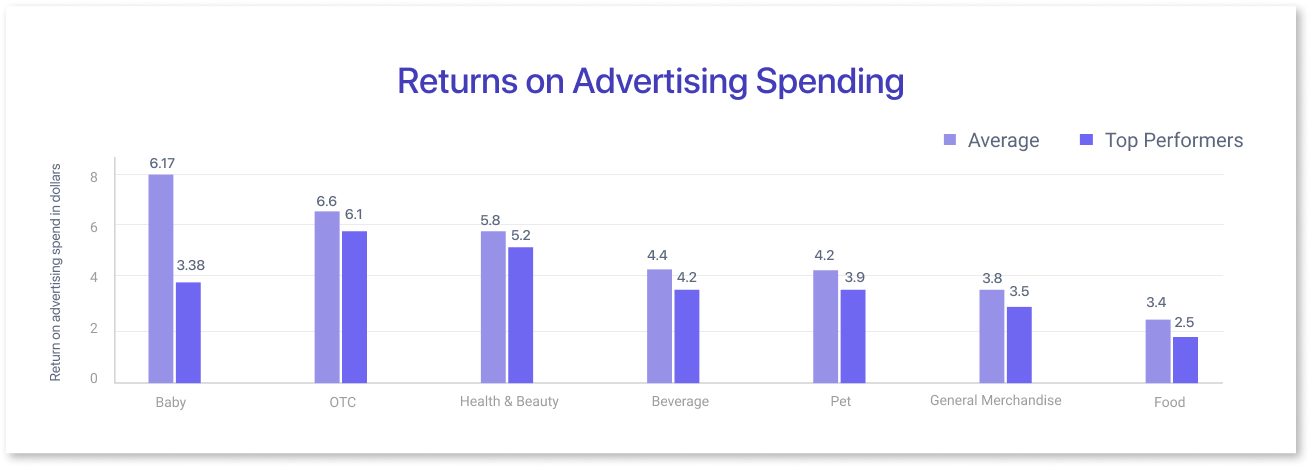
Return on ad spend (ROAS) is an important e-commerce indicator that digital marketers must monitor closely. It is comparable KPI to the previously described cost per acquisition, but there is a significant difference between the two. ROAS is particularly tied to ad income, whereas the cost per acquisition relates to the overall cost required to acquire a customer. Because of ROAS feeding directly into CPA, these e-commerce KPIs are related.
ROAS = Total sales / Total ad spend
13) Shopping Cart Abandonment Rate (SCAR)
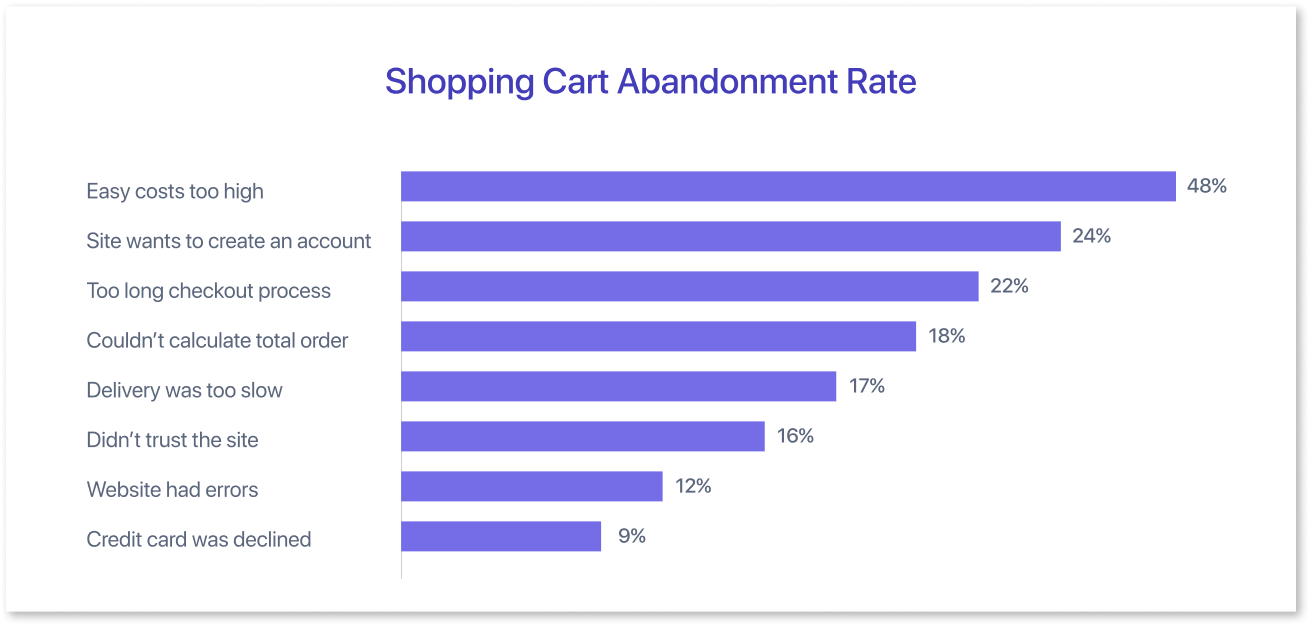
Because so many customers abandon their shopping carts, the shopping cart abandonment rate (SCAR) is an important e-commerce KPI to monitor. A high percentage of shopping cart abandonment will harm your organization, regardless of whether your focus is on sales, customer experience, or branding. Simply divide the number of sales in your store by the number of carts created and multiply by 100 to obtain your abandonment rate percentage.
SCAR = (Sales ÷ Carts) x 100
14) Net Profit
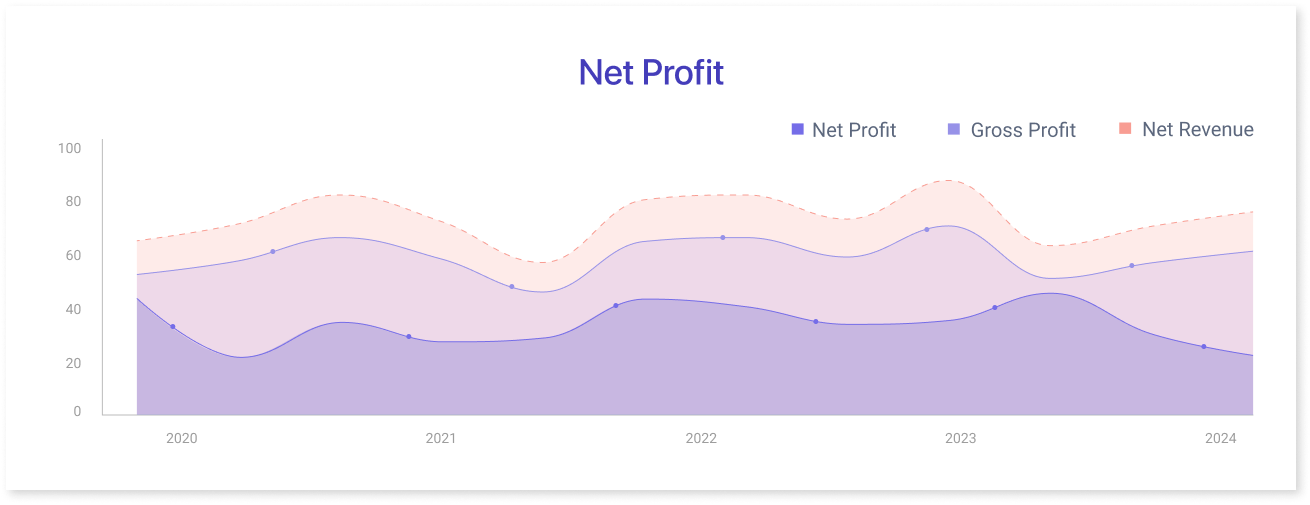
Net profit is often ignored when e-commerce performance measures are considered. However, it is a clear, important sign of the overall health of an e-commerce store. Profitability is an important milestone for startups. Knowing how much money you make will tell you how much money you have to spend on marketing, customer service, and other growth efforts.
Net profit = total revenue – total expenses
15) Gross Profit
Gross profit is a crucial metric for e-commerce businesses as it directly measures the profitability of their product sales. It's calculated by subtracting the cost of goods sold (COGS) from total revenue. Essentially, it shows how much money a company makes from selling products after accounting for the direct costs involved in producing and selling them.
Formula:
Gross Profit = Total Revenue - Cost of Goods Sold (COGS)
The Best Tools for Tracking E-commerce Analytics
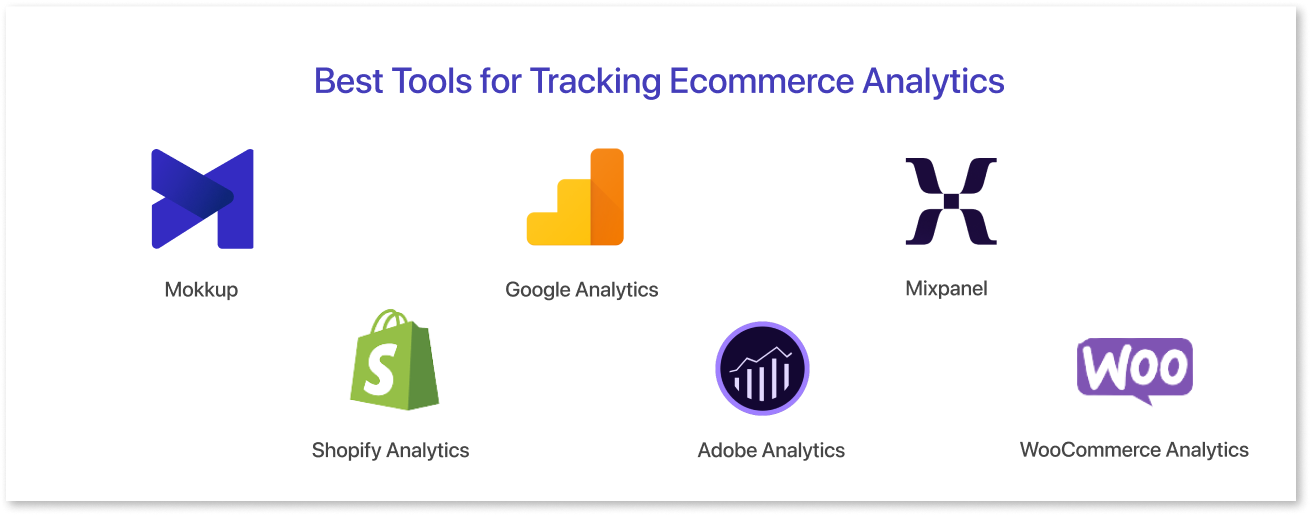
Many top tools track e-commerce analytics, offering insights to help you make data-driven decisions and optimize your store. Here are some of the best options:
1. Mokkup:
Mokkup provides a variety of e-commerce dashboard wireframe templates, allowing users to select and customize the one that best suits their business needs. This flexibility enables stakeholders to provide valuable feedback on key metrics they want to track, which can then be refined into the final dashboard. Also, the dashboard demo feature, allowing users to preview and interact with their customized e-commerce templates before finalizing the design. With its intuitive drag-and-drop functionality, Mokkup’s user-friendly interface makes customizing e-commerce templates a seamless process.
The platform offers a comprehensive gallery of templates, including multi-channel analytics, sales forecasting, and product insights, empowering businesses to measure, analyze, and their performance management. Although Mokkup focuses on dashboard wireframing, for graph and chart creator, users can effortlessly generate custom visualizations to track and analyze key e-commerce metrics.
2. Google Analytics:
Google Analytics is a widely used and powerful analytics tool. It provides in-depth data on website traffic, user behavior, conversion rates, and much more. You can track e-commerce-specific metrics, set up goals and funnels, and gain valuable insights into your customers' journey on your website.
3. Mixpanel:
Mixpanel is a robust analytics platform that focuses on event tracking and user behavior analysis. It enables you to monitor and analyze user actions and events within your e-commerce site. Mixpanel offers advanced segmentation, funnel analysis, and retention analytics to help you optimize your sales funnels and increase conversions.
4. Shopify Analytics:
If you are using Shopify as your e-commerce platform, it provides built-in analytics features. Shopify Analytics offers a range of reports and metrics to track sales, customer behavior, and marketing campaigns. You can gain insights into key performance indicators specific to your Shopify store and make data-driven decisions to grow your business.
5. Adobe Analytics:
Adobe Analytics is a comprehensive enterprise-level analytics solution. It provides deep insights into user behavior, segmentation, and attribution. Adobe Analytics offers advanced features for tracking and analyzing e-commerce data, integrating with other Adobe Marketing Cloud tools for a holistic marketing analytics solution.
6. WooCommerce Analytics:
If you have an e-commerce store built on the WooCommerce platform, you can leverage WooCommerce Analytics. It provides store owners with detailed reports on sales, revenue, customer behavior, and product performance. WooCommerce Analytics allows you to track and optimize your store's performance directly within the WooCommerce dashboard examples.
Conclusion
KPIs are essential for e-commerce success. They provide insights into performance, highlight areas for improvement, and help make informed decisions by analyzing metrics like conversion rate, average order value, and customer lifetime value. Monitoring these KPIs helps gauge marketing effectiveness, website usability, and overall strategy.
KPIs also aid in setting goals, tracking progress, and making data-driven decisions, enabling businesses to adjust strategies and benchmark against industry standards. In the competitive e-commerce landscape, using KPIs is key to optimizing operations and enhancing customer experience.
Prompt it. Wireframe it with Mokkup.ai.
