
Have you ever wondered how those cool and organized dashboards are created? Well, you're in the right place! Creating a wireframe is the first step to building a user-friendly and efficient dashboard. But don't worry if you're new to all this – we're here to break it down for you in simple terms.
Wireframing is a crucial step in the UI/UX design process. It allows designers to quickly and easily experiment with different layouts and designs without having to commit to a final product. This is especially important in recent years, as users are expecting more and more from the products and services they use.
In this blog, we'll take you on a journey through the world of wireframes, showing you what they are, why they're essential, and, most importantly, how to make one for your very own dashboard. Whether you're a budding designer, developer, data analyst, or just someone curious about the magic behind digital interfaces, we've got you covered. So, let's dive in and demystify the art of creating wireframes for dashboards!
Table of Contents
- What is a Wireframe?
- When Does Wireframing Take Place?
- Why Should You Use Wireframes?
- 5 Things to Remember When Wireframing
- How do you Create a Mock Dashboard Wireframe?
- Templates to Speed Up Wireframe Creation
What is a Wireframe?
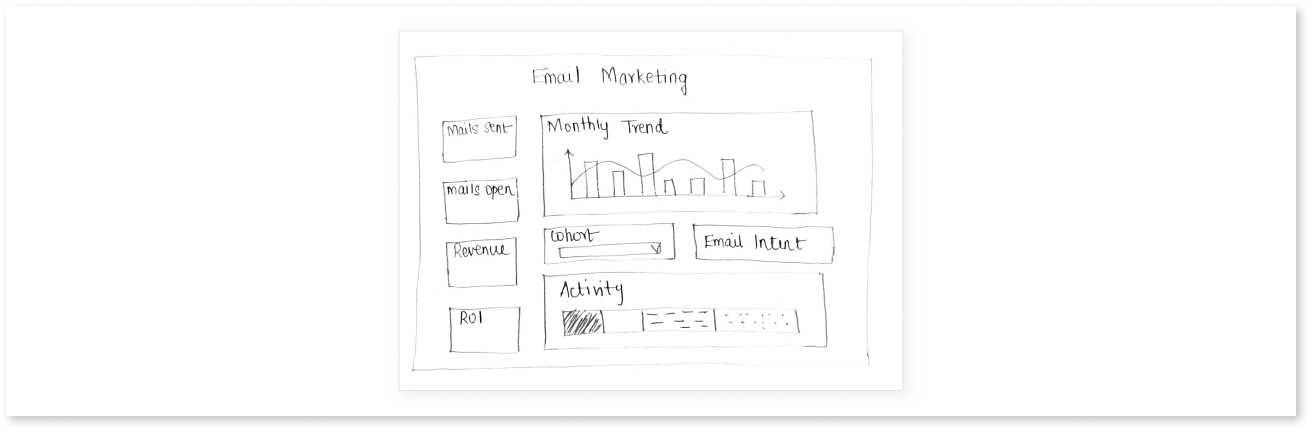
A wireframe is a visual representation or blueprint of a webpage, application, or interface. It is a low-fidelity, simplified, and often grayscale or monochromatic representation that outlines the basic structure, layout, and placement of elements on a screen without going into details like colors, typography, or graphics. Wireframes are used in the early stages of the design process to help designers, BI developers, and stakeholders conceptualize and communicate the layout and functionality of a digital product. Various data prototype tools can be used to create dashboard wireframes, including industry-standard options like Mokkup, Adobe XD, Sketch, Figma, Infogram, and PowerMockup.
When Does Wireframing Take Place?
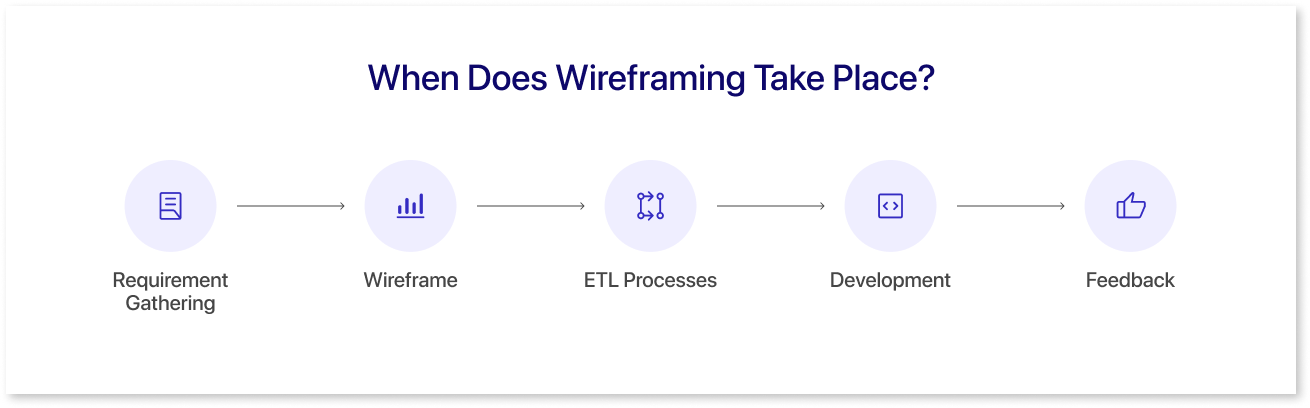
Wireframing takes place early in the product development lifecycle, typically during the exploratory phase. This is when designers or data professionals are still working to understand the product's scope, collaborate on ideas, and nail down business requirements. The wireframe is usually the first iteration of a dashboard, webpage, or app, and it's used as the basis for the rest of the development.
Wireframing is a flexible process that can be done at any stage of development, but it's most effective when done early on. This is because wireframes are relatively inexpensive and easy to make, so it's more cost-effective to make changes to a wireframe than to a more developed product.
Here are some of the benefits of wireframing early in the development process:
- It helps to ensure that the product meets the needs of users and stakeholders.
- It helps to identify and address potential usability problems early on.
- It can help to save time and money in the long run by avoiding costly mistakes later on.
- It can facilitate communication and collaboration between designers, developers, and other stakeholders.
Why Should You Use Wireframes?
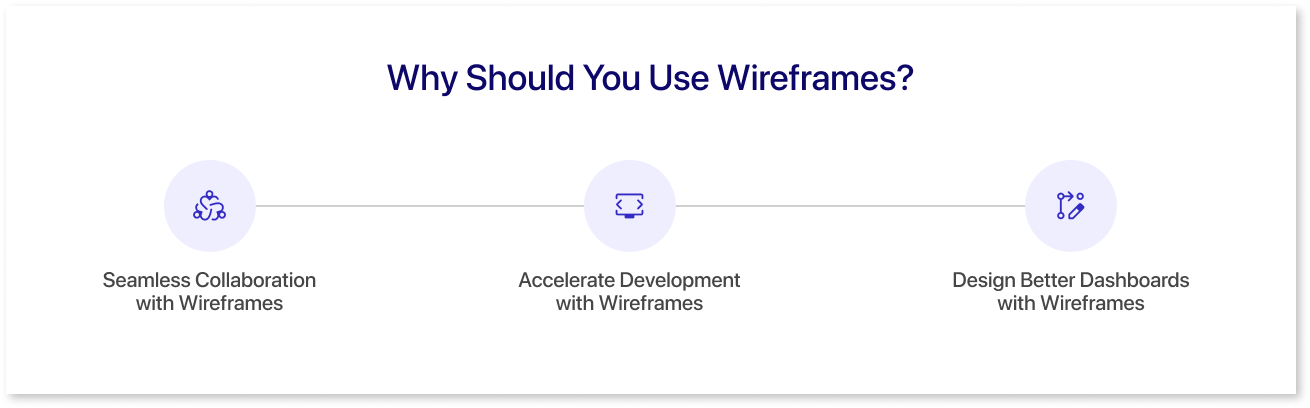
Wireframing is a crucial step in the dashboard design process. It allows BI developers to visualize the dashboard's layout, functionality, and usability before switching to high-fidelity designs.
1) Seamless Collaboration with Wireframes
Wireframes serve as a common ground for effective visual collaboration among stakeholders, including designers, developers, clients, and end-users. They facilitate a shared understanding of the dashboard's metrics displayed, structure, and functionality, enabling seamless communication and feedback exchange.
2) Accelerate Development with Wireframes
Wireframes help analysts understand the data required, what visuals are needed, and the structure they need to follow, hence accelerating development. They are a low-fidelity representation of the user interface (UI) of a product or service and are typically created in black and white, and they focus on the structure and functionality of the UI rather than the visual design.
3) Design Better Dashboards with Wireframes
Dashboards are increasingly becoming the primary way that users interact with data. As a result, the demand for well-designed dashboards is on the rise. Wireframing is an essential step in the dashboard design process, as it allows developers to focus on the functionality and usability of the dashboard before getting bogged down in the details of visual design.
A study by McKinsey found that companies that invest in UI design see a 32% increase in customer satisfaction and a 22% increase in employee productivity. <Source>
Overall, wireframing is an essential step in the dashboard design process. By taking the time to create wireframes for data visualization, data professionals can create dashboards that are more user-friendly and effective and meet the needs of all users.
5 Things to Remember When Wireframing
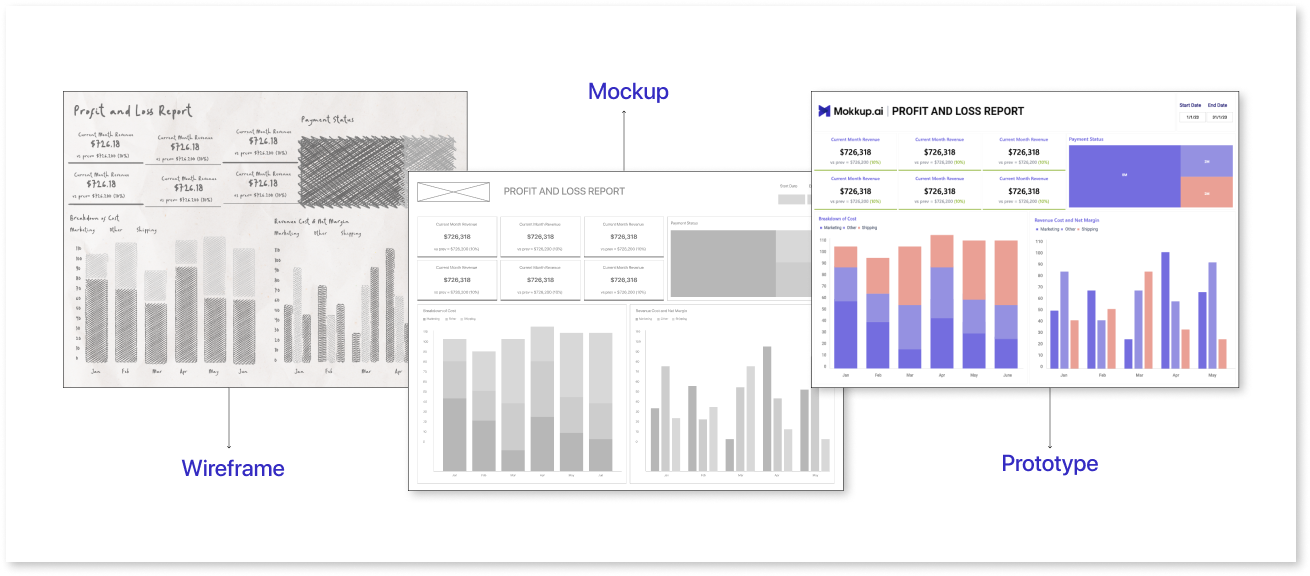
Wireframing is an essential step in the UX design process. It allows you to visualize and test your ideas before you start coding, which can save you time and money in the long run. The terms wireframe, mockup, and prototype are often used interchangeably, but they refer to three distinct stages in the design process.
Wireframes are low-fidelity representations of a product that focus on functionality and usability. Mockups are medium-fidelity representations that add visual elements like colors, photos, and sketches. Prototypes are high-fidelity representations that include interactivity and simulate the look and feel of the final product.
1) Focus on functionality over form.
Wireframes are meant to test the usability and functionality of a design, so take your time with the visual details at this stage.
2) Keep it simple.
Avoid using too much text, cluttered layouts, or complex interactions. Your wireframe should be easy to understand and navigate.
3) Use standard UI elements.
This will help users to understand how your design works and how to interact with it.
4) Get feedback early and often.
Show your wireframe to potential users and stakeholders to get their feedback and suggestions. This will help you to identify and fix any usability problems early on.
5) Be flexible and willing to iterate.
Wireframing is an iterative process, so don't be afraid to make changes to your design as you go.
How do you Create a Mock Dashboard Wireframe?
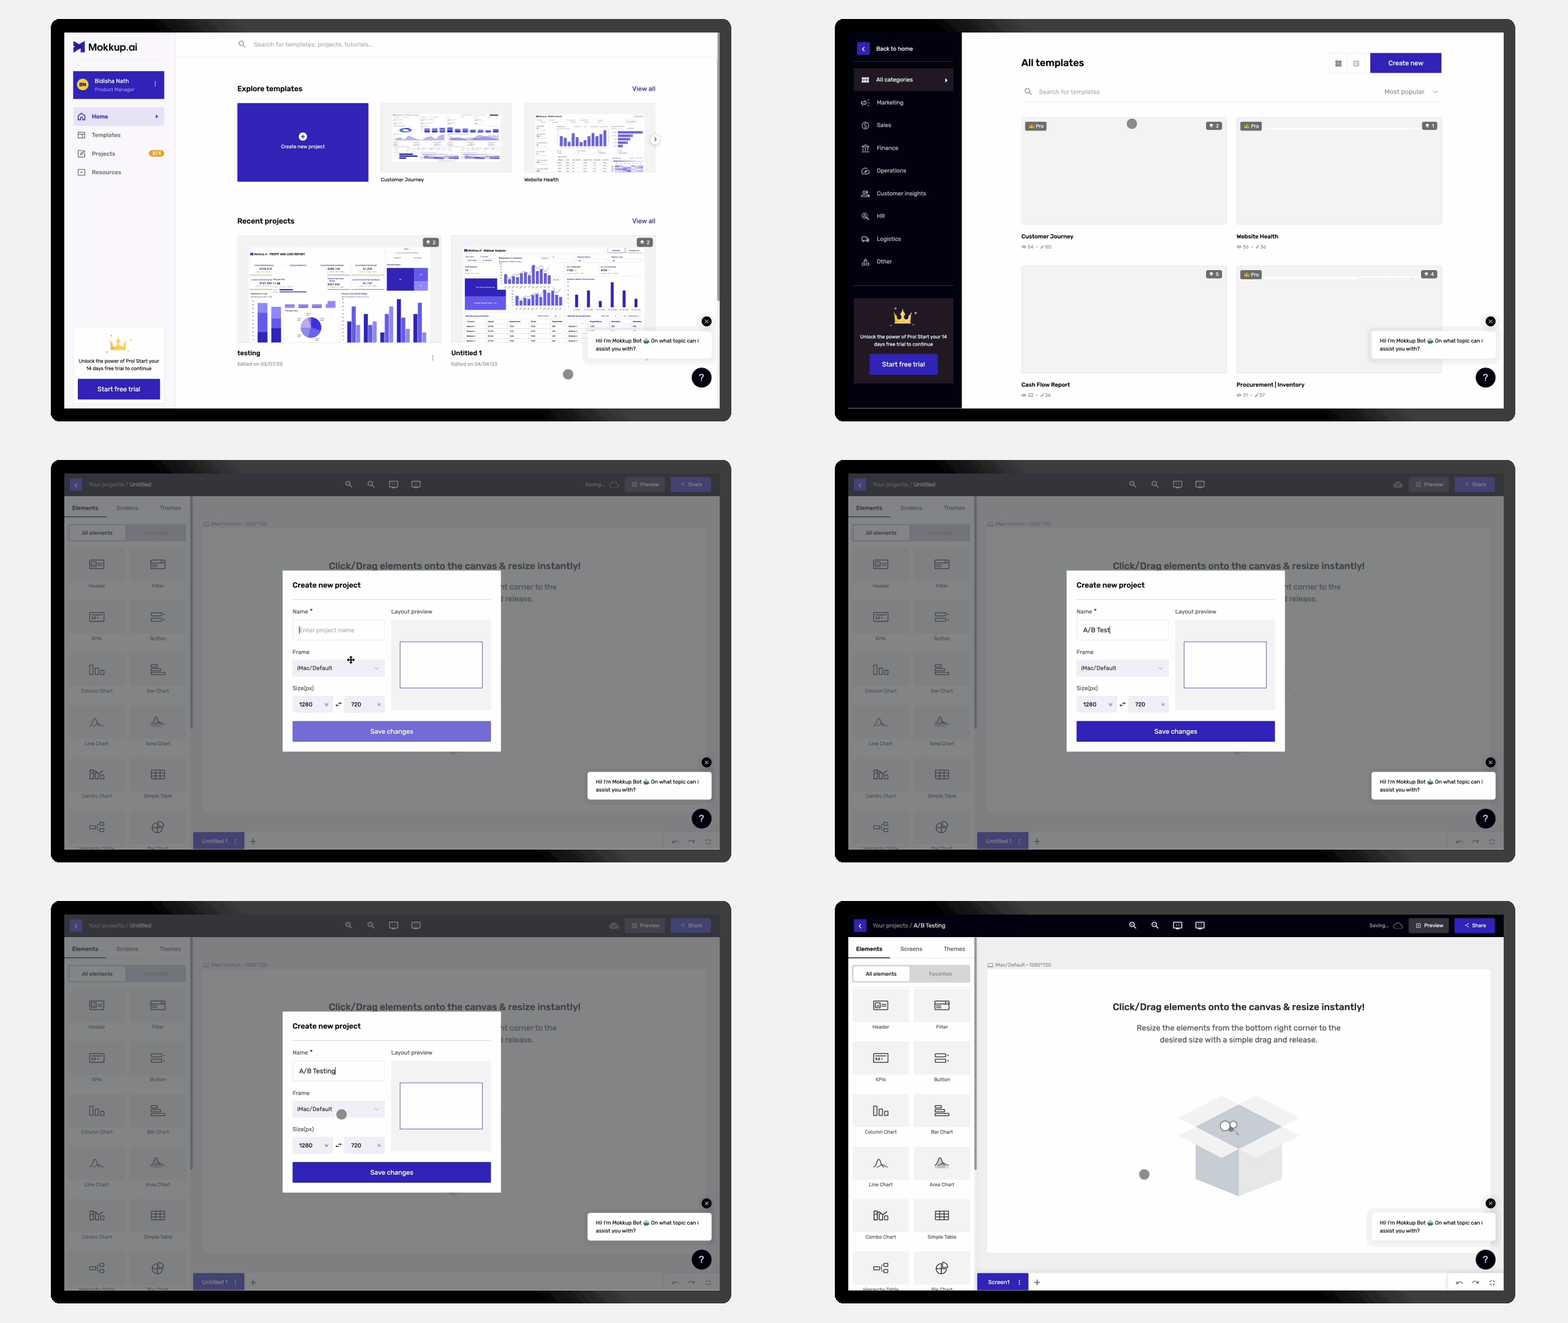
Designers used to sketch their initial ideas on paper, but most teams now prefer online wireframing tools like Mokkup due to the scope and complexity of modern user interfaces. Mokkup is a cloud-based dashboard wireframing tool that is designed to be easy to use for everyone, regardless of their technical expertise. It has no learning curve, so you can start creating stunning dashboards right away without having to worry about learning a complex new software program.
Mokkup lets you drag and drop elements directly onto the canvas, making creating a wireframe super simple. with several elements, KPIs, and tables, Mokkup makes building professional dashboard wireframes both quick and effortless.
If you’re looking to create a solid foundation for your BI Project or want deeper insights into the mock dashboard creation process, check out these 10 Ways Mokkup.ai Streamlines Your dashboard wireframing process.
Templates to Speed Up Wireframe Creation
You don't have to start from scratch when creating an effective wireframe for your BI dashboard. Using a pre-made template can save you time, help you build on established best practices, and give you a kickstart on your project.
Channels like Mokkup offer a library of templates that can simply be edited to tailor it to your needs. The library includes over 120+ professionally designed dashboard templates. Browse the library, choose the one that best fits your needs, and start customizing it!
Here's a preview of our most popular types of dashboard templates:
1) Customer Journey
A customer journey dashboard template provides a high-level overview of the customer journey and typically includes metrics such as website traffic, conversion rates, monthly trends, and channel performance.
2) Project Management Dashboard
The project management dashboard mockup provides a comprehensive view of the organization's project performance, allowing project managers, design teams, and stakeholders to make informed decisions and manage projects more effectively.
3) Ecommerce | Sales Forecasting
An e-commerce sales forecasting dashboard template is a pre-built visualization that provides insights into future e-commerce sales. This mock dashboard provides a view of your sales pipeline so you can quickly identify and address any potential issues.
4) Procurement- Inventory
The procurement-inventory dashboard template can be used to track the performance of KPIs over time, identify trends, and make informed decisions about procurement strategies. This mock wireframe can also identify improvement areas, such as reducing maverick spending or improving contract utilization.
Summing Up
Creating a wireframe for your best reporting dashboard is a crucial step in the dashboard development process that can significantly impact the success of your project. By following the best practices outlined in this guide, you can ensure that your wireframe serves as a solid foundation for the development of a user-friendly and visually appealing dashboard. Remember to prioritize user experience, maintain clarity and simplicity, and seek feedback from stakeholders and potential users to refine your wireframe. With careful planning and attention to detail, your mock dashboard wireframe will not only streamline the design process but also set the stage for a successful and functional dashboard that meets the needs of your stakeholders.
If you’re ready to start creating data visualization wireframes – either from scratch or from a template – just click the button below to get started with our dashboard wireframe tool!
Prompt it. Wireframe it with Mokkup.ai.
