
In today's dynamic and fast-paced work environment, efficiency and productivity are paramount. As professionals, we constantly seek tools and technologies that can streamline our tasks, accelerate workflows, and elevate our performance. One way to do this is through the use of dashboard mockups. Mokkup.ai is a revolutionary platform that is making your job easier in ways you never thought possible. In this blog, we'll introduce you to 10 ways how Mokkup.ai can make your job easier and show you how it can help your business. But first, let’s discuss the basics of wireframing process.
Table of Contents
- How is Wireframing Affecting the Entire BI Process?
- Problems in the current wireframing process
- Introducing Mokkup.ai
- How Mokkup.ai Streamlines The Process Of Dashboard Creation
How is Wireframing Affecting the Entire BI Process?
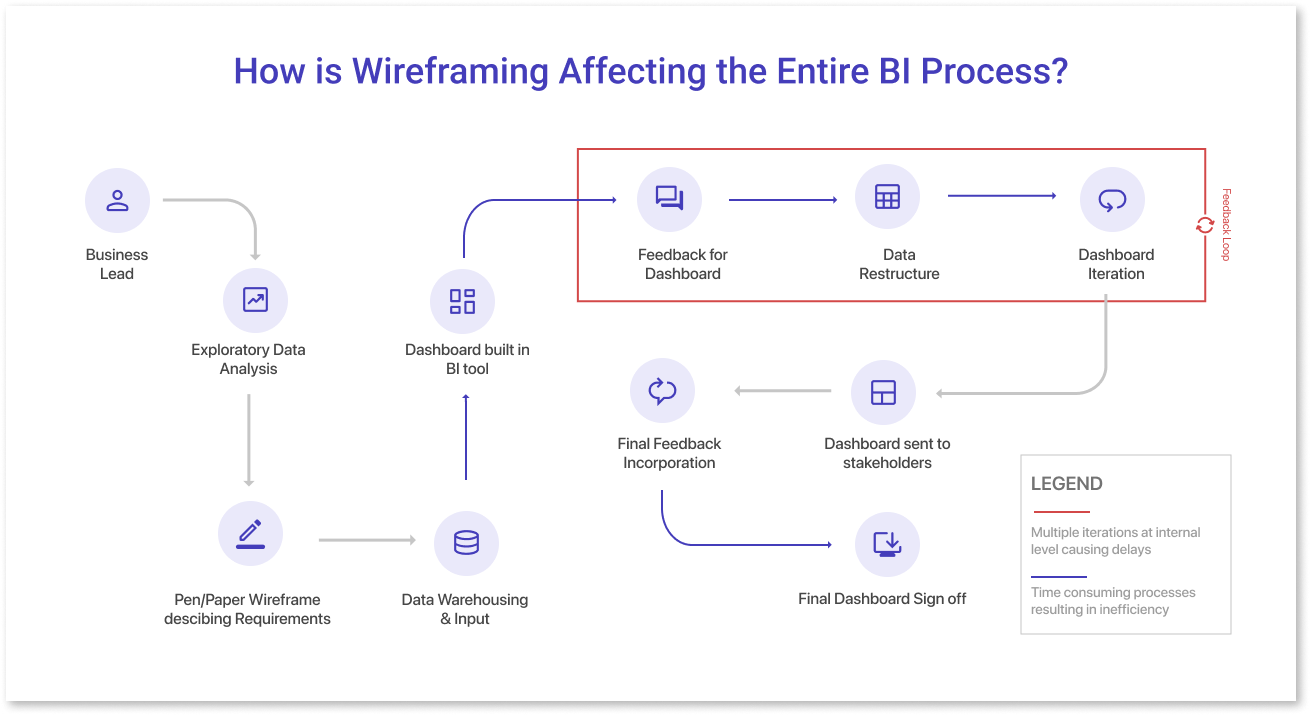
Wireframing plays a crucial role in streamlining the entire Business Intelligence (BI) process, revolutionizing the way present data is visualized and understood. BI encompasses the collection, analysis, and interpretation of large amounts of data sources to make informed business decisions. Traditionally, this process involved complex spreadsheets, charts, and reports that could be overwhelming and difficult to comprehend. However, with the advent of wireframing, BI professionals now have different tools at their disposal.
By designing prototypes, BI experts can effectively communicate their ideas and concepts, allowing stakeholders to visualize data insights more easily. This process facilitates collaboration, improves understanding, and expedites decision-making. Wireframing brings clarity to complex datasets, presenting important information in a user-friendly and visually appealing way, ultimately enhancing the overall efficiency and effectiveness of the BI process.
With wireframing, BI teams can identify potential design flaws or usability issues early on, leading to more efficient iterations and ultimately improving the overall user experience. Moreover, wireframes facilitate the communication of complex data concepts and analytical insights in a simplified manner, enabling users to quickly grasp and interpret information. In summary, wireframing greatly impacts the BI process by promoting collaboration, improving usability, and enhancing data visualization, thereby driving informed decision-making within organizations.
Problems in the Current Wireframing Process
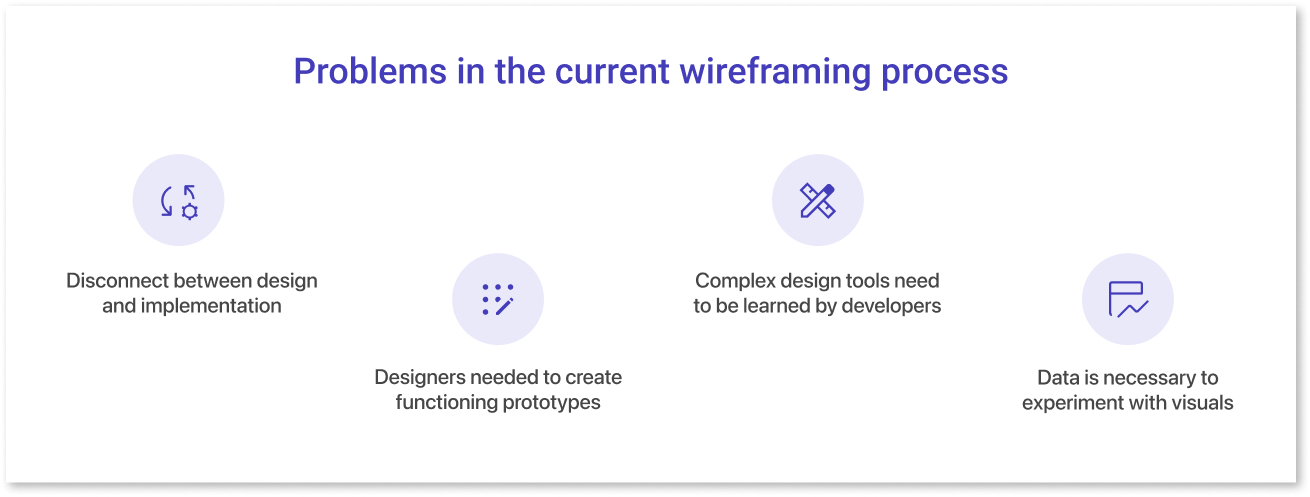
The current wireframing process faces several challenges that impact its effectiveness and efficiency:
- Disconnection between design and implementation: Often, there is a gap between the wireframe design and its implementation in the final product. This can lead to misinterpretation or miscommunication of design intentions, resulting in inconsistencies and errors. Developers may struggle to accurately translate the wireframe into a functional interface, causing delays and revisions.
- Designers needed to create functioning prototypes: In many cases, wireframes alone do not provide a fully interactive experience. Designers are required to invest additional time and effort in creating functioning prototypes, which can be a complex and time-consuming task. This reliance on designers for prototyping can slow down the development process and limit the involvement of other team members.
- Complex design tools need to be learned by developers: Wireframing tools often require specific design skills and knowledge that may not be possessed by developers or other team members involved in the implementation. Learning and mastering these tools can be challenging and time-intensive, diverting resources away from core development tasks.
- Data is necessary to experiment with visuals: While wireframes allow for visualizing data, they often lack the real data necessary for meaningful experimentation. Without actual data, it can be challenging to accurately assess how visuals will function and perform in real-world scenarios. This limitation can hinder the ability to make informed design decisions and optimize the user experience.
Introducing Mokkup.ai
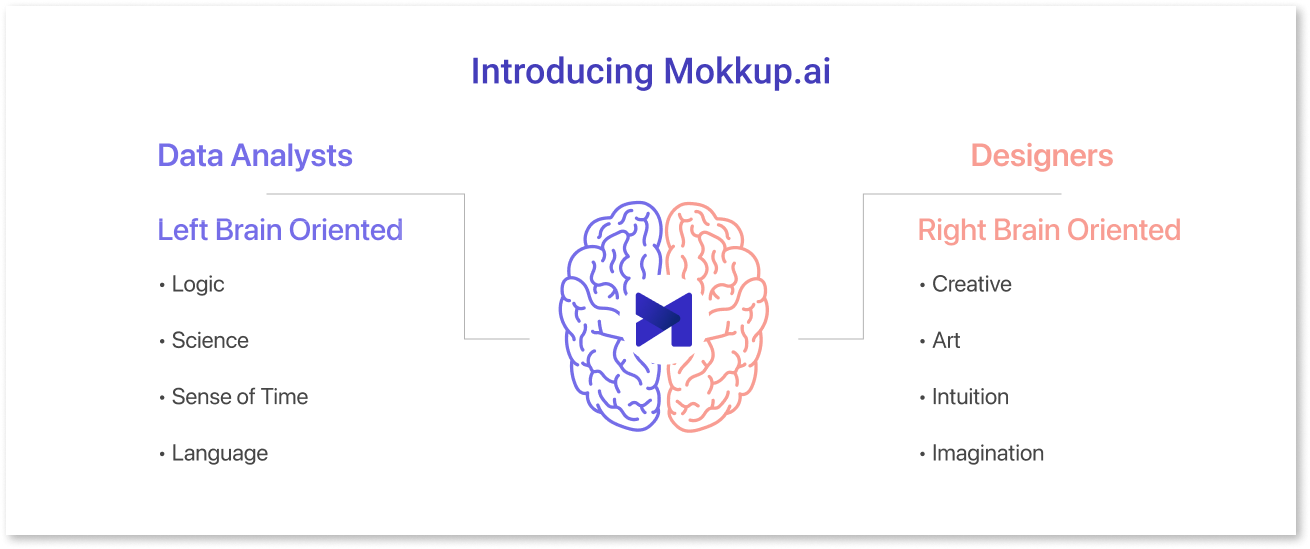
Mokkup is a cost-effective cloud-based tool that empowers data analysts to understand the best practices in design and reporting. It allows them to visualize the data analytics before involving tools like Power BI & Tableau. Its user-friendly interface and dashboard template makes it accessible to users without design experience. Whether you're an entrepreneur, a small business owner, or the CEO of a large corporation, Mokkup.ai can help you streamline your workflow and improve your products or services. The platform offers a wide range of free dashboard templates, design elements, and customization options, enabling businesses to create mock dashboards that look professional and polished. In addition, Mokkup.ai is constantly updated with new models and features, ensuring your mockups are always up to date with the latest design trends.
How Mokkup.ai Streamlines the Process of Dashboard Creation
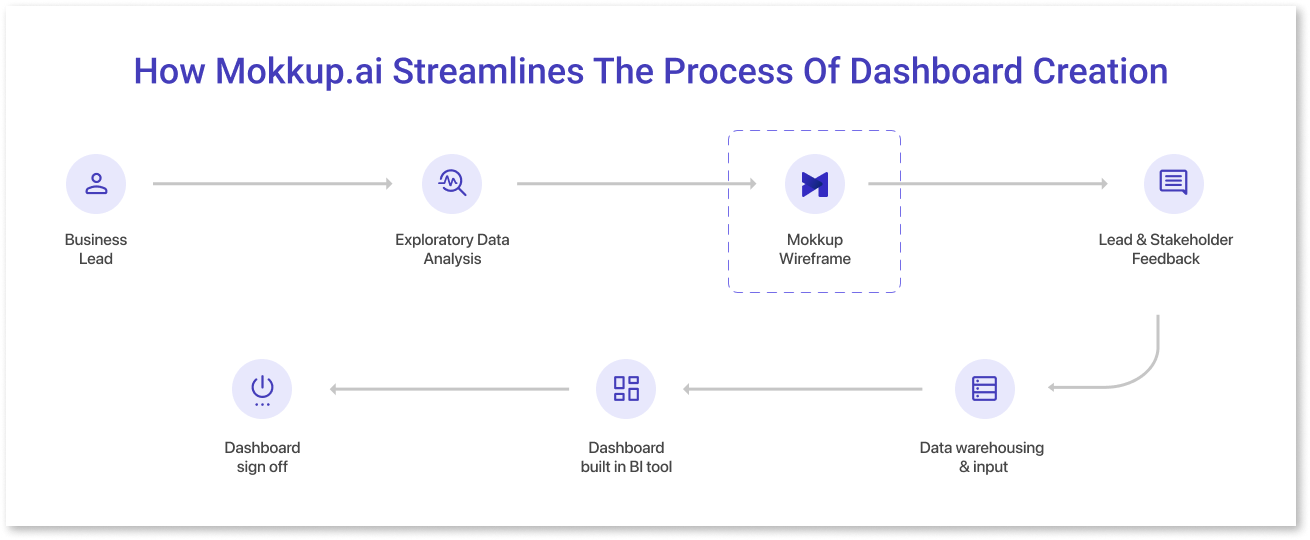
Mokkup streamlines the process of high-fidelity dashboard creation by providing a user-friendly interface for designing wireframes. Mokkup offers a range of pre-built elements that can be easily dragged and dropped onto the canvas to create wireframes. With Mokkup, users can quickly prototype and iterate on their dashboard design without the need for advanced graphic design skills or complex data visualization tools. The pre-built templates allow users to define the overall layout, arrange elements, and adjust their sizes and positions with ease.
Once the wireframe is created using Mokkup, it can be shared with relevant individuals, such as project leads, stakeholders, or potential users. This sharing can be done through direct links or exporting in the form of PDF, JPG, or JPEG file formats. Gathering feedback in the initial stage promotes effective collaboration and communication among team members, ensuring that the dashboard design aligns with the expectations and requirements of key stakeholders. it saves time by avoiding iterations when there is actual data involved, where making changes is 10x more difficult as it may need changing the data structure and multiple calculations. This iterative feedback loop can greatly enhance the quality and usability of the final dashboard product.
Let’s explore some of the features of mokkup.ai:
1. Time-saving
Mockups play a crucial role in streamlining the wireframing process, resulting in significant time and effort savings. By providing a visual representation of the dashboards, mockups allow designers to quickly convey design ideas and layouts to stakeholders. This facilitates faster feedback and iteration cycles, enabling designers to refine their designs efficiently. By catching design flaws and usability issues early on, mockups prevent costly revisions and delays during development. Mokkup.ai serves as a dashboard wireframe tool for efficient communication, exploration, and validation, ultimately saving time and effort in the wireframing process.
2. Easy-to-Use Interface
Mokkup.ai simplifies this process with its easy-to-use interface. Whether you're a professional designer or a beginner, Mokkup.ai empowers you to create stunning designs without the need for complex coding or advanced design skills. It has a clean and intuitive design that makes it easy for users to navigate through the platform. Its intuitive drag-and-drop functionality and extensive library of pre-designed components make it a valuable tool for streamlining your design workflow. The interface is designed with simplicity in mind, ensuring that non-designers can understand and use it without feeling overwhelmed or confused.
3. Extensive Template Library
The template library of Mokkup.ai covers a diverse range of categories, catering to various reporting needs. Whether you're working for marketing, sales, or finance, you'll find templates tailored to specific design contexts. The categories span across industries and purposes, including e-commerce, logistics, customer insights, HR, social media, and many more. Developers can use these templates to see best practices in reporting and what other companies are tracking for metrics.
4. Customization Options
Whether it's a line chart, bar chart, or any other type of visual representation, mokkup designers have created an array of choices. These variations encompass different layouts and styles, allowing users to effortlessly experiment with different design rules. By providing pre-designed chart variations, developers and designers can save valuable time and effort by starting with a solid foundation and then customizing the details to match their specific requirements. With the abundance of pre-designed options available, creating visually appealing and informative wireframes has become more accessible than ever before.
5. Realistic Visuals
With Mokkup.ai, you can create accurate and realistic mockups, giving you a better idea of your dashboard in BI tools like Power BI and Tableau. It means that the final output closely resembles an actual product or interface, giving users a clear representation of how their design would look in practice. This feature allows non-designers to visualize their ideas more effectively and share them with others, such as clients or stakeholders. Users can also learn how to recreate mockup elements in these tools by using our resources menu.
6. Live Demo
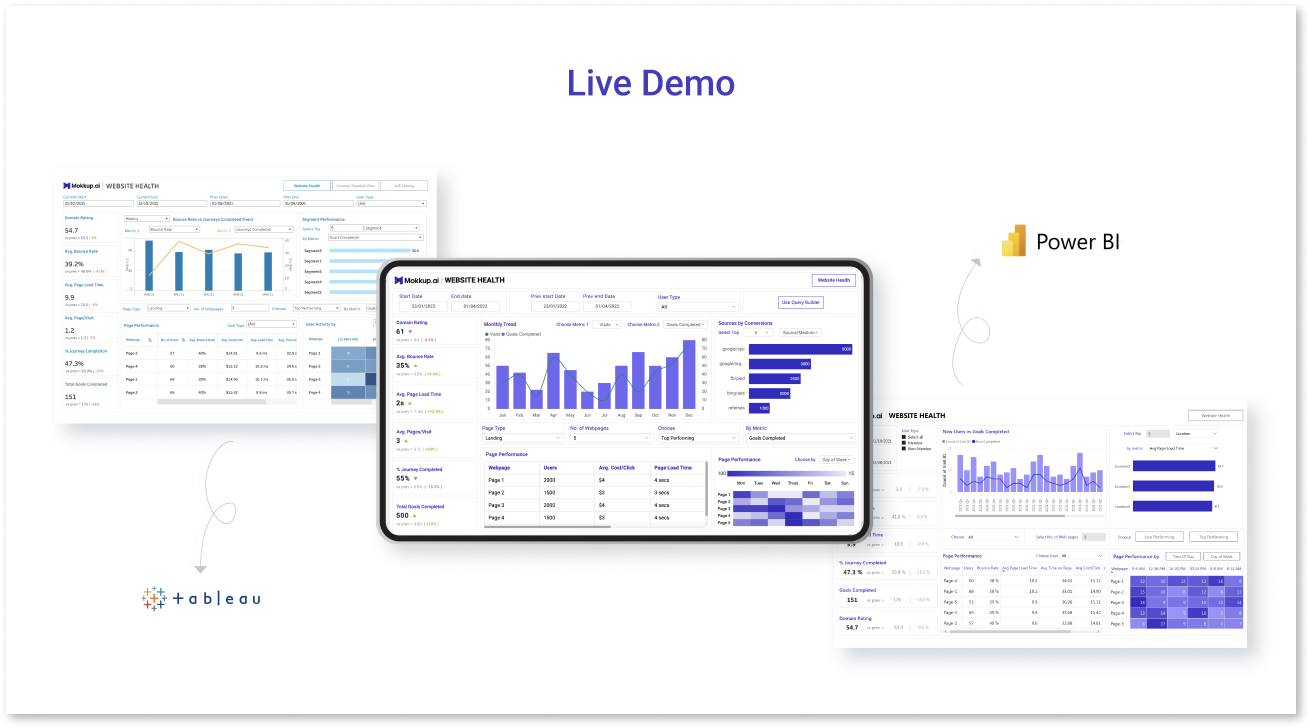
With the Pre-built templates, Mokkup offers a preview of them in BI tools like Power BI and Tableau. This helps you visualize what the final product looks like making your job easier. Using the live preview feature, you can see how the dashboard templates will look, including filter & chart interaction. Also, if you’re unsure about how to recreate these elements in your BI tool, Mokkup provides an entire resources menu filled with videos guiding you through the steps for recreation.
7. Curated Color Palette
Mokkup.ai offers curated color palettes to enhance the visual appeal and design aesthetics of your wireframes and mockups. These color palettes are carefully selected combinations of colors that follow design principles and work harmoniously together, saving you the time and effort of manually choosing and testing color schemes.
Conclusion
In conclusion, Mokkup.ai offers a comprehensive set of features that enhance the wireframing and mockup design process. With its consideration of screen sizes, users can ensure that their designs are optimized, resulting in a seamless user experience. The platform also provides versatile exporting and sharing options, allowing designers to collaborate and present their work effortlessly.
Furthermore, Mokkup.ai's embedding functionality enables seamless integration of wireframes and mockups into websites/ blogs/ presentations. This feature streamlines the development process and provides a realistic representation of the final product. This tool empowers designers to bring their ideas to life, collaborate effectively, and deliver visually appealing and functional designs.
Prompt it. Wireframe it with Mokkup.ai.
