
Data analysts need to show how they work with data to solve problems. Just like web developers and designers, they can do this with a portfolio. A data analyst portfolio is a collection of work that shows your skills and experience. It can include projects you've worked on, blog posts you've written, or even code samples.
If you're just starting out, don't worry. There are ways for how to build a portfolio even if you have yet to gain professional experience. You can work on personal projects, contribute to open source projects, or even volunteer your data analysis skills to a non-profit organization.
This guide will show you how to build data analyst portfolio examples from scratch. We'll cover:
- What is a Data Analyst Portfolio, and Why is it Important?
- What Skills Should Your Data Analyst Portfolio Demonstrate?
- How to Create a Data Analyst Portfolio?
- What to Include in your Portfolio?
- Data Analyst Portfolio Do’s and Don’t’s
What is a Data Analyst Portfolio, and Why is it Important?
A data analyst resume can list your skills and experience, but you need to prove to potential employers or clients that you have the skills to do the job. A data analyst portfolio is a website that showcases your skills and experience by sharing the projects you've worked on.
Why is a data analyst portfolio important?
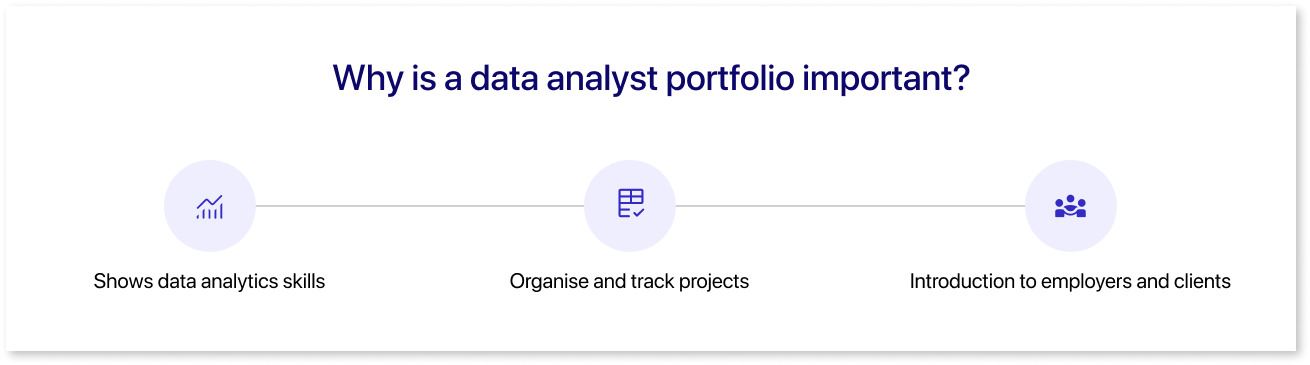
Anyone can get into data analytics, even if they don't have a degree or previous work experience. Neither are required to land a job in data analytics. A data analytics portfolio will:
- Show potential employers your data analytics skills.
- Help you organize and track your data projects in one place.
- Introduce you to potential employers or clients before they even meet you.
In other words, a data analyst portfolio is a great way to demonstrate your skills, get organized, and network with potential employers.
What Skills Should Your Data Analyst Portfolio Demonstrate?
Data analysts are in high demand as businesses increasingly rely on data to make decisions. To become a successful data analyst, you need to have a combination of technical and soft skills, as well as a strong understanding of statistics and data visualization.
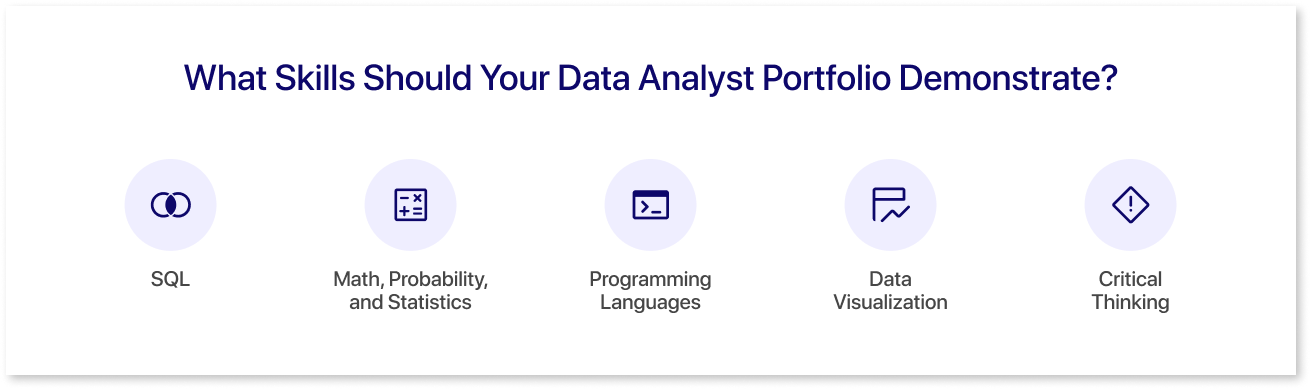
Here are the key data analyst skills you need to learn for your entry-level portfolio:
- SQL: This is the language used to communicate with databases. It is essential for data analysts, who need to be able to query and manipulate data.
- Math, Probability, and Statistics: These skills are essential for understanding and interpreting data. Data analysts need to be able to identify patterns, avoid errors, and produce accurate results.
- Programming Languages: Python and R are two popular programming languages used for data analysis. These languages allow data analysts to perform complex tasks, such as cleaning and analyzing large datasets.
- Data Visualization: Data visualization is the process of communicating insights from data using charts, graphs, and other visual representations. Data analysts need to be able to create visually appealing and informative data visualizations.
- Critical Thinking: Data analysts need to be able to think critically about data and identify solutions to problems. They need to be able to communicate their findings to others in a clear and concise way.
A good data analyst portfolio will demonstrate your ability to use data to solve problems and discover new opportunities. It should be visually appealing and highlight the importance of your analysis to a business.
How to Create a Data Analyst Portfolio?

When creating a data analytics portfolio, you need to choose a place to host it. There are many free options available, including:
- RStudio: RStudio is an integrated development environment (IDE) for the R programming language. It provides a variety of features that make it easy to develop, run, and debug R code, as well as to create and share interactive reports and dashboards. You can publish your RStudio projects on GitHub, or you can use a cloud-based service like Shinyapps.io to create a public portfolio.
- GitHub: This open-source community allows you to create a public repository to showcase your data projects, code, and Jupyter Notebooks.
- Kaggle: This cloud environment lets you display your results from Kaggle data science competitions, as well as the data sets you've built and the code you've written.
If your portfolio grows, move it to a standalone website hosted through a service like Squarespace or Wix, which offers pre-made templates and easy drag-and-drop modification. If you're comfortable working with HTML, you can host your site through WordPress for even more flexibility.
What to Include in Your Portfolio?
The most important part of a data analytics portfolio is the content, not the hosting platform. A simple portfolio should have two sections: "About Me" and "Projects". Let’s take a closer look at both.
About me
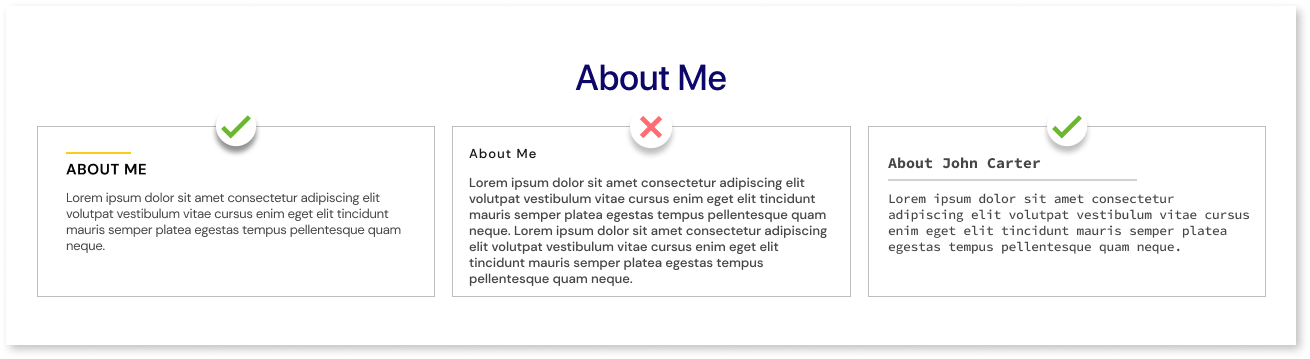
The "About Me" section is your chance to introduce yourself to potential employers and explain why you are passionate about data analytics. You can use this section to explain:
- How did you get started with data analysis?
- What aspect of data most interests you?
- Where do your interests in data analytics lie?
You can also include your contact information and social media links.
Projects
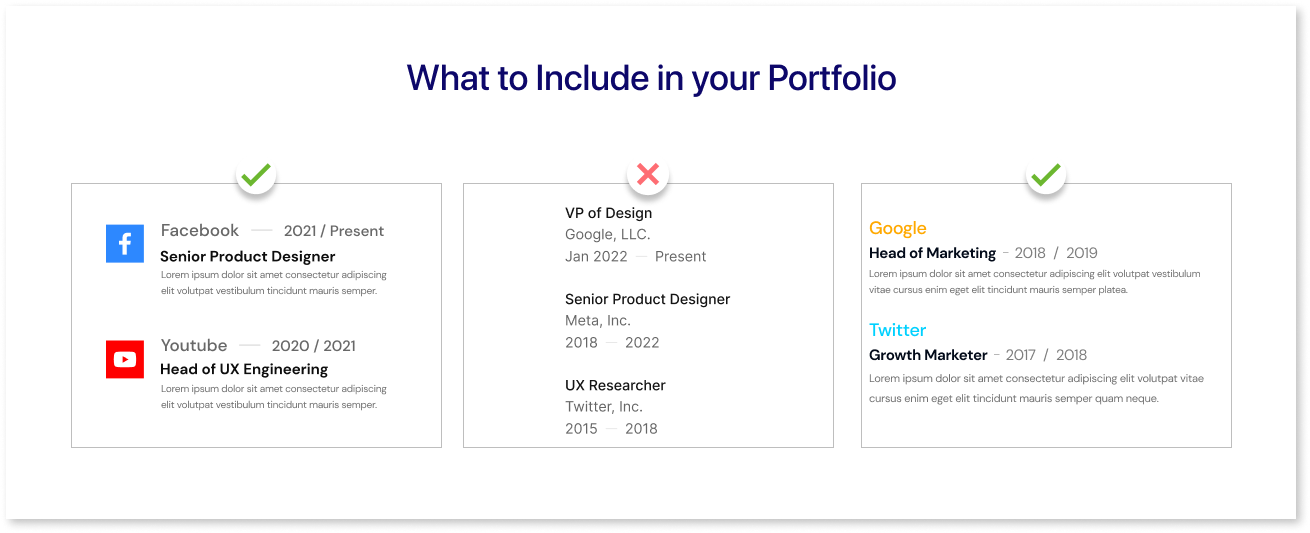
The bulk of your portfolio should be dedicated to showcasing your skills and experience through projects. Try to include projects that highlight your ability to:
- Data scraping from websites: Show your code and explain your reasoning using hashed comments.
- Clean data: Take a data set that contains missing, duplicate, or otherwise problematic data and go through your data cleaning process.
- Analyze data in various ways: Use data to do diagnostic, descriptive, predictive, and prescriptive analysis.
- Visualize data to create a story: Make a chart, map, graph, or other visualization to help you comprehend your data.
- Communicate complex ideas: To highlight your communication skills, consider producing a blog post that defines your method or explains a tough data subject.
- Collaborate with others: Include any group projects you've worked on.
- Use data analysis software: Share projects that demonstrate your abilities to use SQL, Python, R, and other programming languages.
What do I put in my portfolio if I don’t have work experience?
Include tasks you've accomplished on your own or as part of your coursework if you're just starting out and don't yet have professional experience as a data analyst.
How to display projects in the portfolio
You can also use Mokkup.ai, a cloud-based dashboard wireframing tool, to create demo projects that showcase your skills and experience. With Mokkup.ai's library of templates, pre-built elements, and drag-and-drop functionality, data analysts can easily create professional-looking dashboard wireframes that highlight their key findings and insights.
Here are some specific ways that data analysts can use Mokkup.ai to create demo projects:
- Create a mock dashboard wireframe to showcase your data analysis skills: Pre-built elements make it easy to create a professional-looking dashboard without coding. You can add your own data and customize the wireframe to highlight your key findings and insights.
- Design a mock dashboard wireframe for a specific business problem or use case: Templates can serve as a starting point for your dashboard project or analysis. Mokkup.ai's drag-and-drop functionality makes it easy to customize templates to your specific needs. Experiment with different templates and pre-built elements to find the best way to present your data.
Other items to include
While you should contain an "About me" section and some work, you may also enhance your portfolio with a few more items.
- Think about writing blog posts on your approach and findings as you work on projects. This can be an excellent way to demonstrate your communication skills while also reinforcing your study.
- It's a good idea to include a few comments from schoolwork, employers, clients, or coworkers regarding your work in data analytics.
Data Analyst Portfolio Do’s and Don’t’s
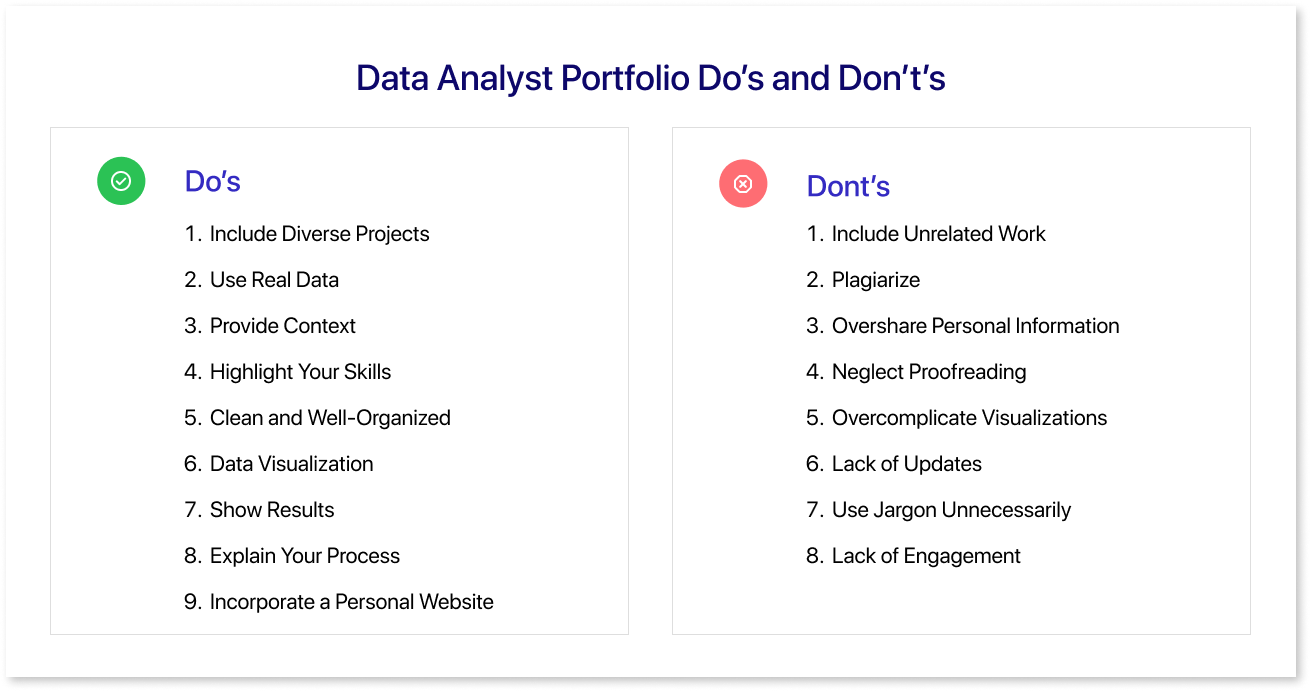
Creating an effective data analyst portfolio is essential to showcase your skills and experience to potential employers or clients. Here are some do's and don'ts to consider:
Do's:
- Include Diverse Projects: Showcase a variety of projects that highlight your skills in data collection, cleaning, analysis, and visualization. Choose projects that demonstrate your ability to solve different types of problems.
- Use Real Data: Whenever possible, use real-world data in your projects. This adds credibility and shows your ability to work with messy, unstructured data.
- Provide Context: Explain the context and business problem behind each project. Describe what you were trying to achieve and the impact of your work.
- Highlight Your Skills: Clearly mention the tools and technologies you used in each project, such as Python, R, SQL, data visualization libraries, and machine learning frameworks.
- Clean and Well-Organized: Keep your portfolio clean, organized, and easy to navigate. Use clear headings, labels, and sections for each project.
- Data Visualization: Create compelling visualizations that effectively convey your insights. Use charts, graphs, and dashboards to make your data understandable to non-technical audiences.
- Show Results: Quantify your achievements and outcomes. If your analysis led to specific improvements or decisions, mention them.
- Explain Your Process: Outline the steps you took in each project, from data collection to analysis. This helps viewers understand your approach.
- Incorporate a Personal Website: Consider having a personal website to host your portfolio. It provides a professional platform for your work.
Don'ts:
- Include Unrelated Work: Don't add projects or work irrelevant to data analysis. Your portfolio should focus on your core skills.
- Plagiarize: Never copy or use someone else's work without proper attribution. Plagiarism can severely damage your reputation.
- Overshare Personal Information: Avoid sharing too much personal information, such as your home address or phone number. Stick to your professional details.
- Neglect Proofreading: Typos and grammatical errors can make your portfolio appear unprofessional. Always proofread your descriptions and content.
- Overcomplicate Visualizations: While data visualization is crucial, make sure to create simple charts that confuse rather than inform. Keep them simple and effective.
- Lack of Updates: Keep your portfolio up-to-date with data analyst projects and skills. An outdated portfolio can give the impression that you are not actively working in the field.
- Use Jargon Unnecessarily: Avoid using excessive technical jargon that might confuse non-technical viewers. Communicate your work in a clear and accessible manner.
- Lack of Engagement: Add interactive elements or engagement features to your portfolio to make it more interesting and informative.
By following these do's and don'ts, you can create a data analyst portfolio that effectively demonstrates your expertise and attracts potential employers or clients.
Summing Up
In conclusion, constructing a robust data analyst portfolio is a critical step toward securing a fulfilling career in the field. By following the guidelines and strategies outlined in this guide, aspiring data analysts can create projects that not only showcase their technical skills but also demonstrate their ability to solve real-world problems. A well-crafted portfolio will not only attract the attention of potential employers but also help applicants stand out in a competitive job market. So, remember to invest the time and effort in building an impressive data analysis portfolio, and the results will undoubtedly speak for themselves in your journey to becoming a successful data analyst.
Prompt it. Wireframe it with Mokkup.ai.
