
"Efficient decision-making and strategic planning are paramount, and the operations dashboards serve as the linchpin in achieving this competitive edge."
An operations dashboard is a visual representation of a company's primary data and key performance indicators (KPIs). It shows how different parts of the business are running in real-time. There’s a detailed blog on how dashboards benefit from real-time updates, check out.
Table of Content
- Inventory Management and Its Challenges
- The procurement process and its importance
- What are operations dashboards?
- Benefits of Using Operations Dashboards
- Building an Operations Dashboard for Inventory Tracking
- Visualization Techniques for Inventory Data
- Best Practices for Using Operations Dashboards
These dashboards act as a hub where managers and other stakeholders can track and analyze key metrics, trends, and patterns. This helps them make better decisions and improves the operation as a whole.
Here’s an example of what an operation dashboard in Mokkup.ai looks like. Now, let's explore how an operation dashboard can help your business track inventory and procurement more effectively.
Significance of Inventory and Procurement Tracking
Management of goods and purchases is a key part of running a business successfully. Having the correct supplies and effective purchasing management can greatly affect a business's earnings, customer satisfaction, and overall efficiency.
Inventory and purchase tracking involves monitoring stock levels, supplier performance, order processing, and other related tasks. If a business knows a lot about these things, it can make its supply chain management more effective. This can save money, avoid stock gaps, and make sure supplies happen on time.
Inventory Management and Its Challenges
Keeping track of your stock is an important part of running a business well. It means keeping track of, directing and managing the stock of a company. Ensure purchasing, storing, tracking, and utilizing goods to meet customer requirements while minimizing costs.
A business can manage its inventory effectively to have the correct amount of goods at the appropriate price.
Common Challenges in Inventory Management
- Overstocking and Understocking: Balancing inventories is tricky. Overstocking increases capital and storage expenses and risks obsolescence. However, understocking may cause stockouts, disgruntled consumers, and missed revenue. Meeting demand and avoiding waste requires a balance.
- Inaccurate Demand Forecasting: Maintaining adequate inventory levels requires accurate demand forecasts. Market movements, seasonality, and consumer behavior complicate predicting client demand. Forecast errors may cause excess inventory or stockouts, lowering profits and consumer satisfaction.
- Poor Visibility into Inventory Levels: Limited inventory visibility can disrupt operations, delay orders, and disappoint customers in a supply chain or across sites. Lack of real-time information inhibits inventory management and decision-making.
The procurement process and its importance
Purchasing products, services, or works from outside sources is part of the procurement process. It involves many processes, including determining needs, evaluating and choosing suppliers, negotiating, buying, and contract administration.
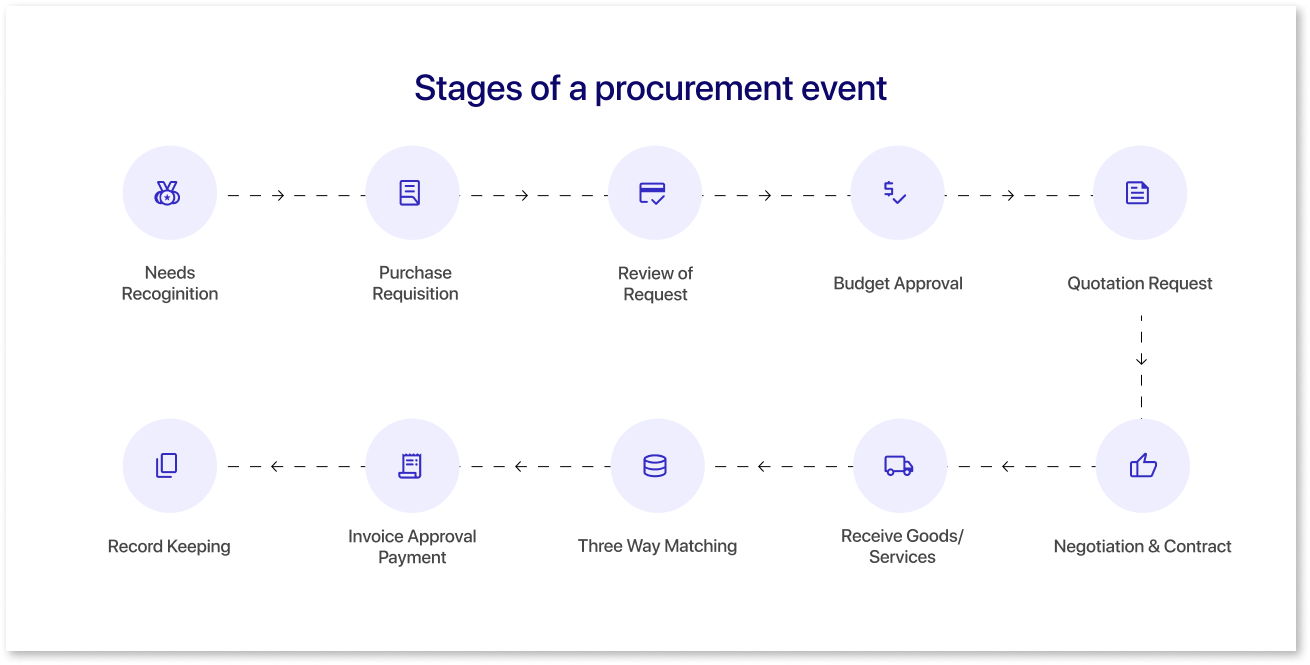
An organization must obtain the appropriate goods or services. Do this at the correct time, price, and quality. This is necessary in order to meet the organization's needs and goals.
Why is effective procurement essential?
- Cost Efficiency: Good procurement methods help negotiate supplier conditions and prices, saving money. The company's profitability and financial health improve.
- Quality Assurance: Strategic procurement ensures the company obtains high-quality products or services, improving customer service.
- Risk Management: Successful procurement KPI dashboard entails risk assessment and reduction. Supplier risk assessment, contract negotiation, and industry regulatory compliance reduce supply chain risks and disruptions.
Key Challenges in Procurement
- Supplier Management: Successful procurement entails risk assessment and reduction. Supplier risk assessment, contract negotiation, and industry regulatory compliance reduce supply chain risks and disruptions.
- Cost Control: Keeping costs low while retaining quality is a perennial procurement concern. Market pricing, currency fluctuations, and unanticipated expenses might affect budget forecasts.
- Compliance Issues: Procurement requires regulatory and organizational compliance. Legal and ethical violations may harm reputations and cause legal issues.
How Can Operations Dashboards Aid in Procurement?
- Real-time Supplier Performance Monitoring: Operations dashboards show real-time supplier performance information, helping with proactive management and service level compliance.
- Cost Analysis and Monitoring: Cost analysis tools on dashboards help procurement teams track spending, evaluate costs, and find ways to reduce expenses.
- Compliance Tracking: Compliance tracking in dashboards monitors legal and organizational compliance, reducing the risk of not following rules.
What are operations dashboards?
Operations screens bring together and show key business data and key performance indicators (KPIs) in real-time. These screens show important information for decision-making and monitoring business operations.
Operations dashboards use charts, graphs, maps, and lists to show data in a visual way. This image makes it easy for people to understand complex data trends, patterns, and insights so they can make smart decisions.
Benefits of Using Operations Dashboards
- Real-Time Monitoring: Teams may track performance metrics and critical indications in real time-using operations dashboards. This real-time monitoring allows for quick reactions to new concerns and possibilities.
- Improved Decision-Making: Operations dashboards improve decision-making by displaying data clearly. Decision-makers can quickly examine trends and patterns to make educated and successful choices.
- Efficient Resource Allocation: Operations dashboards help optimize resource allocation by showing demand and usage. Optimizing operations may save money and boost efficiency.
- Enhanced Communication and Collaboration: A unified dashboard improves team communication and transparency. It helps departments cooperate by coordinating their activities around company goals.
Different Types of Operations Dashboards
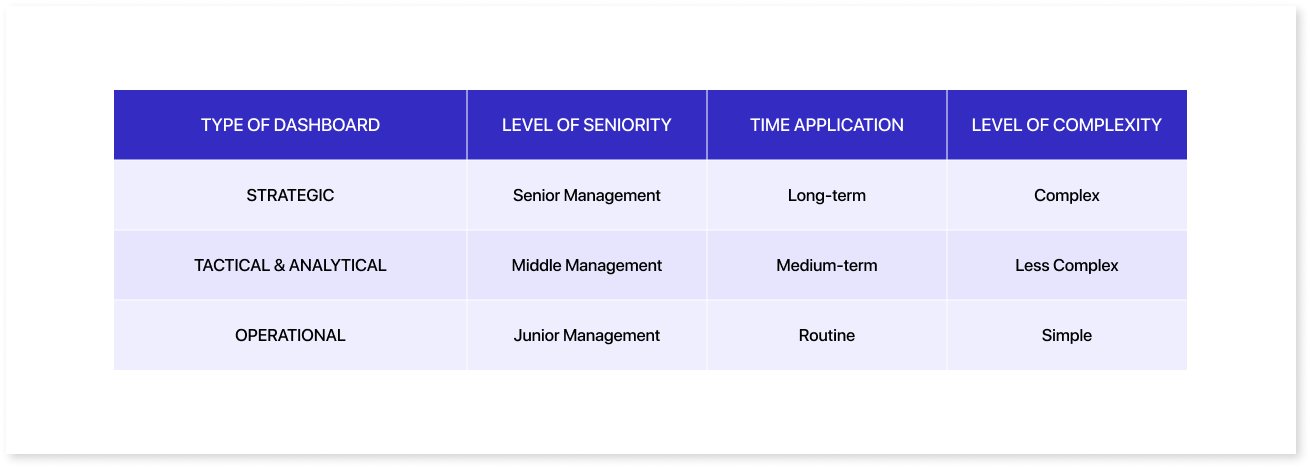
- Strategic Dashboards: Strategic dashboards highlight the company's long-term aims. The dashboard usually displays performance, market share, growth, and other important KPIs.
- Tactical Dashboards: Tactical dashboards provide mid-level managers with departmental or project information and KPIs. They track progress toward operational goals and suggest improvements.
- Operational Dashboards: Daily operations data is available in operational dashboards. They provide production rates, inventory metrics, customer service response times, and other operational parameters for instant decision-making and action.
Building an Operations Dashboard for Inventory Tracking
To create a useful stock management screen, a company must collect information from various sources within the company. We can use the ERP system, warehouse tools, supply chain systems, sales data, and more as data sources. It is important to blend different data sources to fully understand stock amounts, trends, and results.
The operations screen will get correct and up-to-date information from a number of sources. This will help you analyze things and make smart choices.
Selecting the Right KPIs for Inventory Tracking
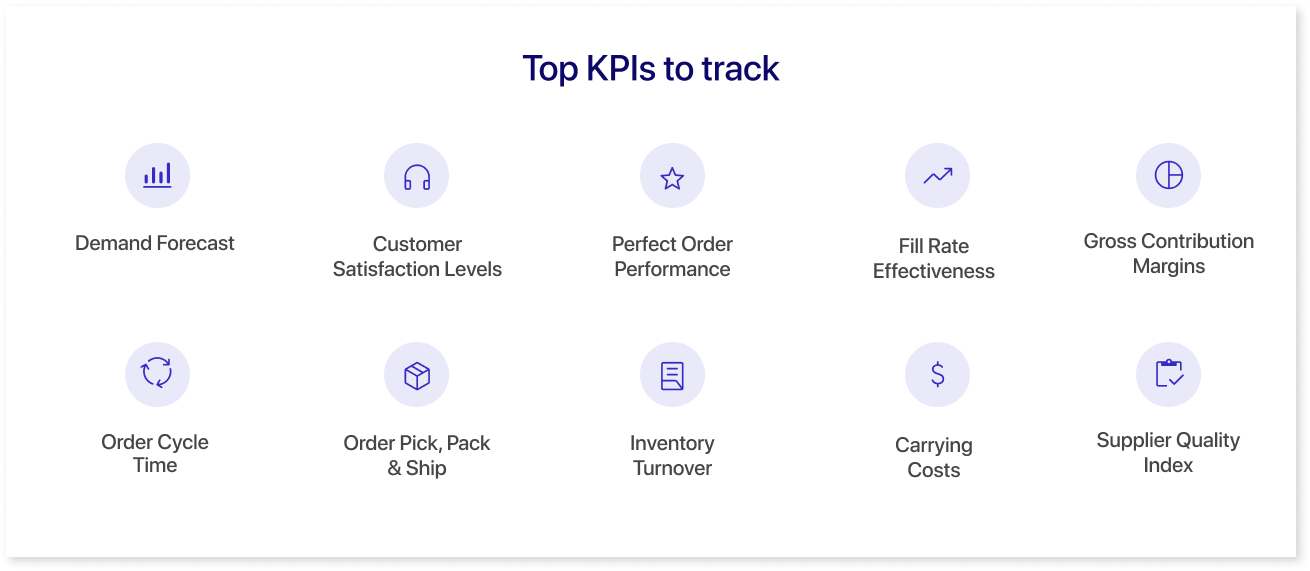
The selection of Key Performance Indicators (KPIs) is a crucial step in designing an effective operations dashboard for inventory tracking. Relevant KPIs provide insights into the performance and health of the inventory management process. We have a detailed blog on the same topic, to learn more click here.
Some essential KPIs for inventory tracking may include:
- Demand Forecast: We measure demand forecasting efficacy by comparing projected and actual demand.
- Customer Satisfaction Level: Monitoring customer satisfaction helps understand if your inventory management meets expectations and builds brand loyalty.
- Perfect Order Performance: Perfect Order Performance measures the percentage of orders delivered correctly and on time, providing insight into operational efficiency.
- Fill Rate Effectiveness: Measuring the percentage of customer demand fulfilled from existing inventory helps evaluate the effectiveness of stock availability.
- Gross Contribution Margins: Calculating the gross contribution margins on inventory items provides valuable financial insights, aiding in pricing and profitability decisions.
- Order Cycle Time: From order placement to delivery, this KPI measures order processing time.
- Order Pick, Pack, and Ship: Monitoring the efficiency of picking, packing, and sending directly affects order fulfillment and customer satisfaction.
- Inventory Turnover: This KPI measures the inventory turnover rate by dividing the cost of products sold by the average inventory value.
- Carrying Costs: Evaluating the cost of holding inventory, including warehousing, and insurance, is crucial for optimizing inventory investment.
- Supplier Quality Index: Evaluating supplier quality using performance metrics ensures a dependable supply chain, reduces disruptions, and upholds product quality standards.
Visualization Techniques for Inventory Data
Visualizing inventory data helps stakeholders see trends and patterns quickly.
Various visualization techniques can be employed, such as:
- Bar Charts and Line Graphs: Showing inventory patterns over time helps explain variations.
- Pie Charts: Product categories help discover which goods make up a significant amount of inventories.
- Heatmaps: Displaying inventory levels across sites makes high- and low-stock regions simple to see.
Real-time Monitoring and Alerts
Real-time tracking is a key part of a good operations screen for handling inventory. It lets people keep track of sales, stock amounts, and other important data in real-time.
Add alerts to the screen to make sure that quick reactions and proactive inventory control are possible. These alerts will inform people about important occurrences such as low stock or changes in storage methods.
Best Practices for Using Operations Dashboards
- Tailor the dashboard to your audience to ensure relevance while defining clear objectives in line with organizational strategies.
- Keep the design simple and use clear visualizations for effective communication. Also, select appropriate visualization types that best represent the data.
- Prioritize and highlight critical KPIs aligned with organizational goals and ensure data accuracy, completeness, and consistency from validated sources.
- Conduct regular reviews and updates to match evolving business operations.
- Provide context through clear titles, labels, and descriptions for each visualization. And enable engagement for users to explore and analyze data interactively.
- Measure and track usage to evaluate effectiveness and user engagement.
Final Thoughts
Imagine being able to see a picture of your company's vital signs and key success factors in real-time. Operations screens make hard data easy to understand, which helps people make better decisions and makes operations much more efficient.
Having the correct amount of goods, improving the buying process, and monitoring important data in real-time can be very beneficial. It affects how much money you make, how happy your clients are, and how your business runs in general. Use this chance to make things easier, save money, and get ahead in a market that is changing quickly.
Prompt it. Wireframe it with Mokkup.ai.
