The Workplace Safety Report dashboard template is designed to help organizations monitor critical safety metrics and trends effectively. With detailed insights into incidents, safety compliance, and risk factors, this template empowers teams to track performance and ensure a secure work environment. Its structured layout simplifies data analysis, aiding proactive measures to maintain workplace safety standards.
Injury Overview and Trends
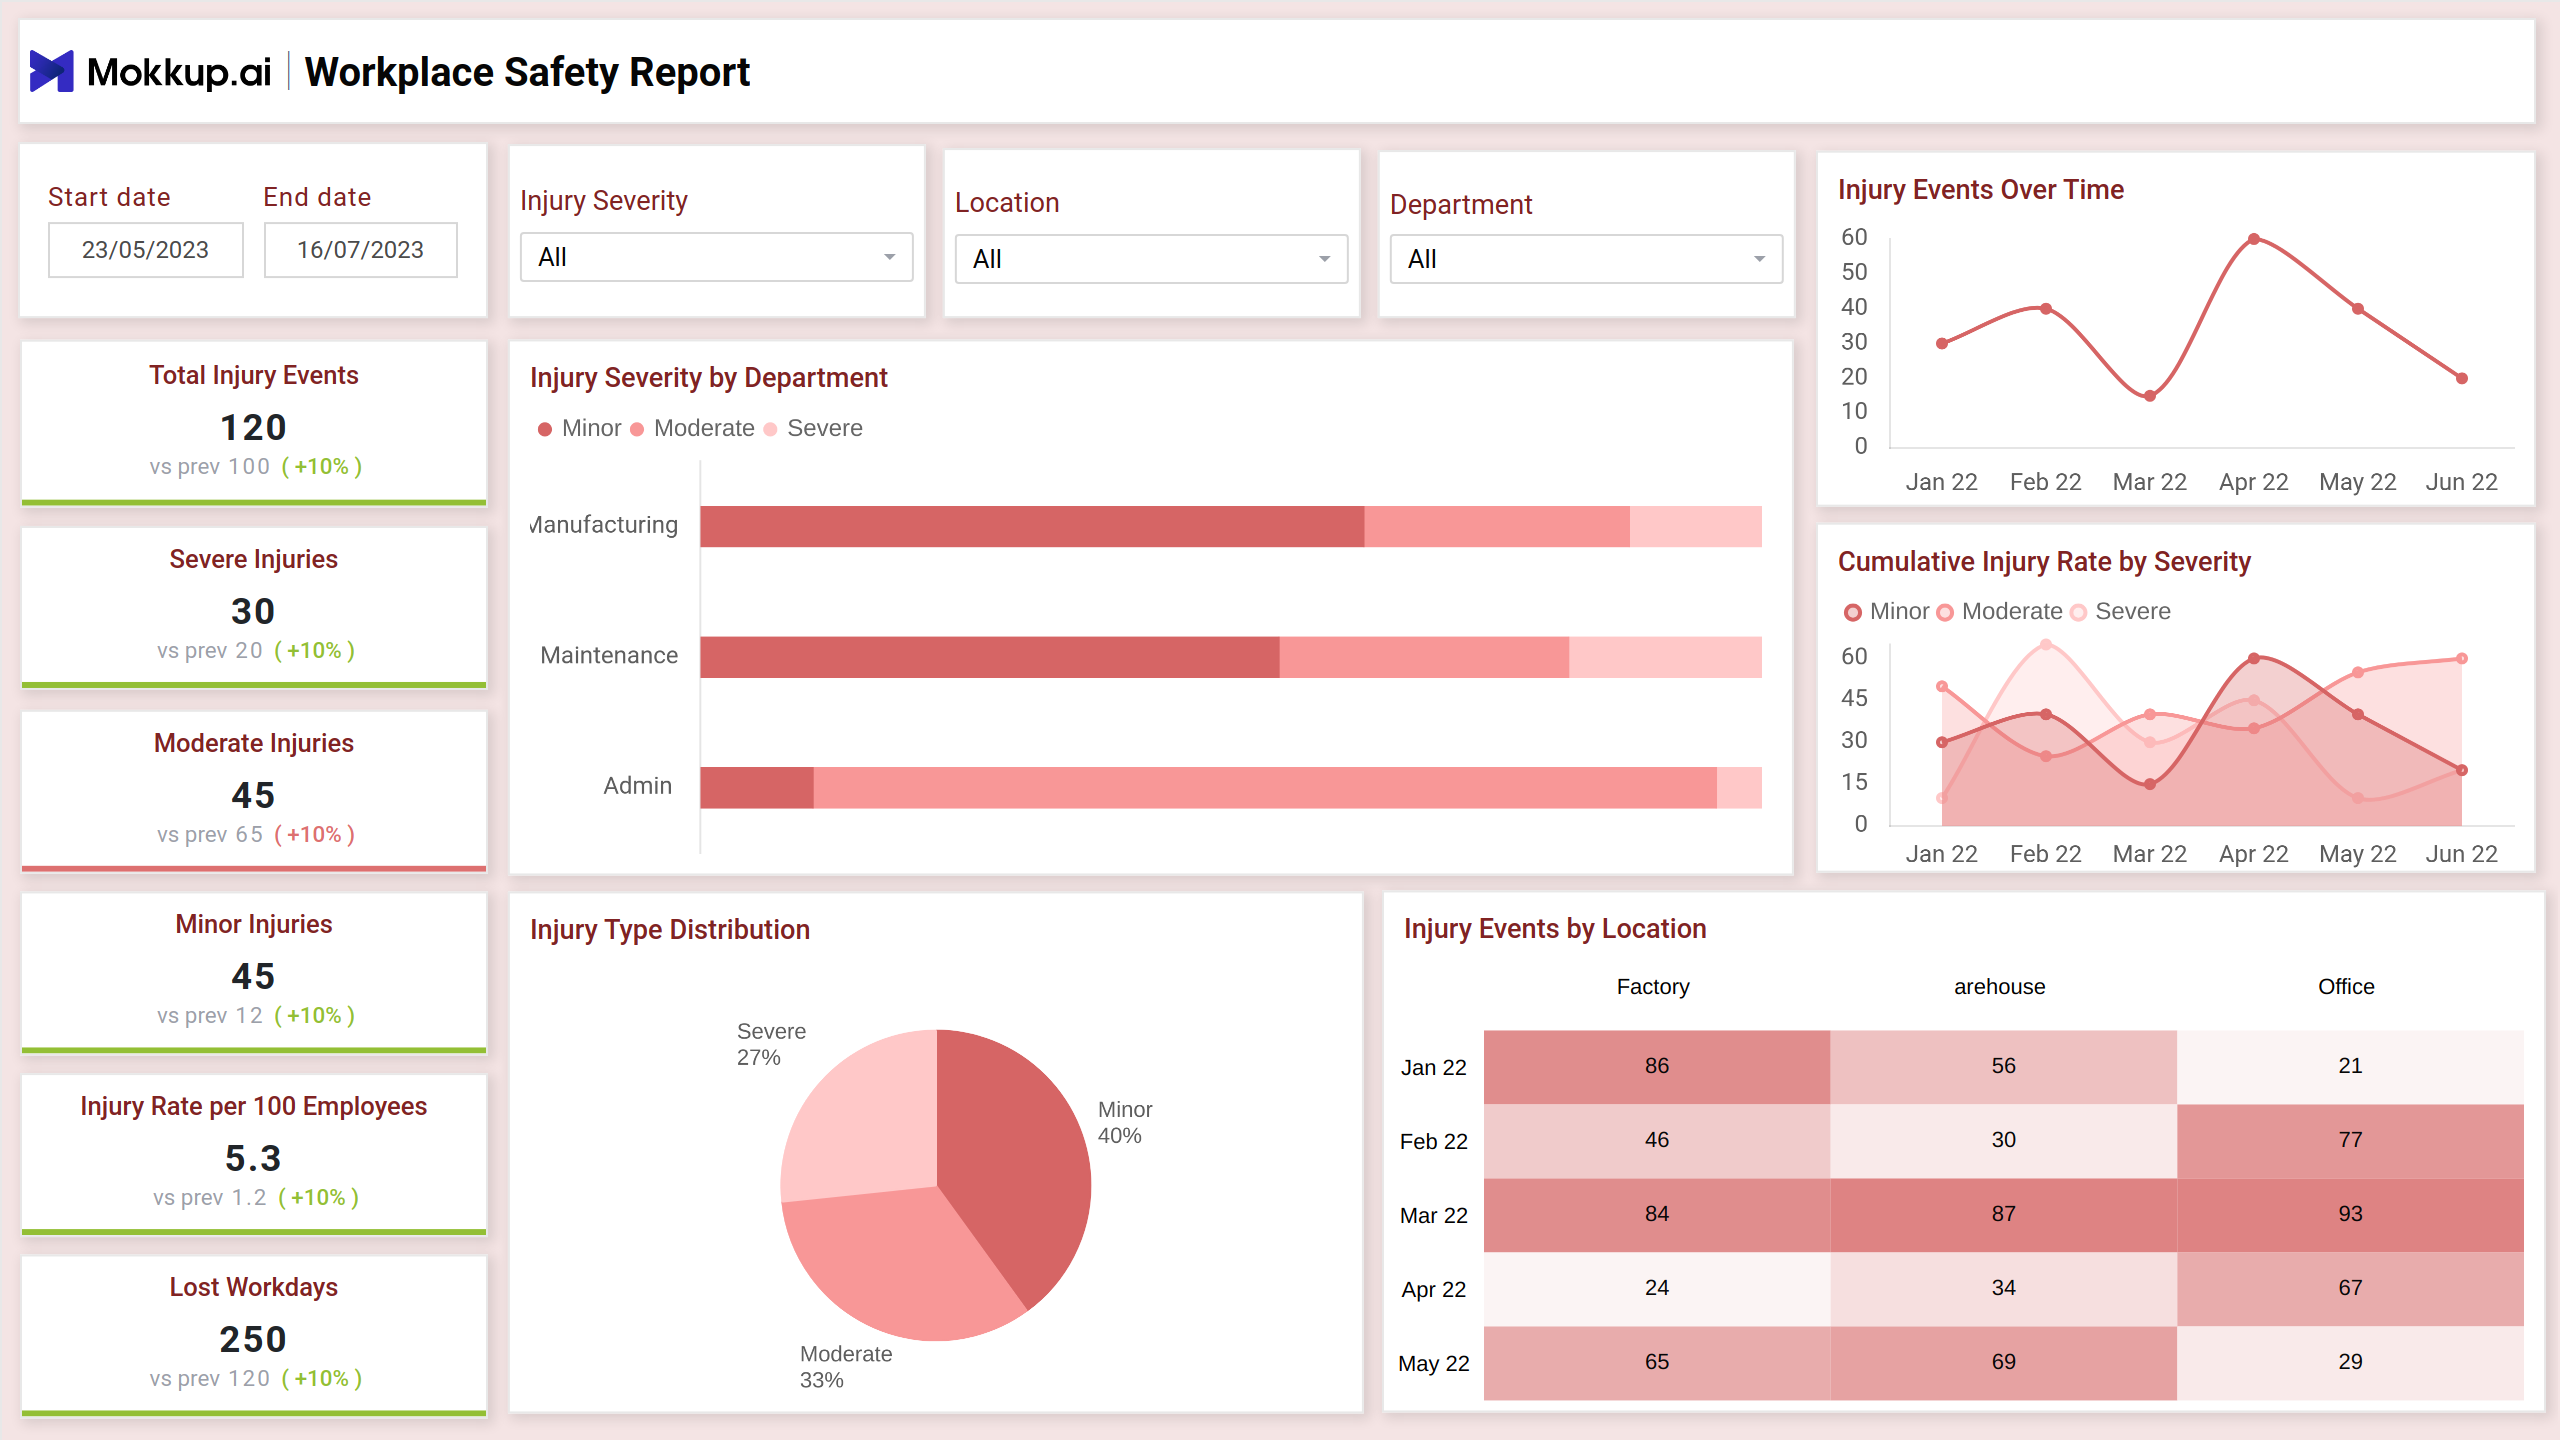
This screen provides an organized view of safety-related data, including visual breakdowns by departments, time periods, and locations. It allows users to assess key trends, patterns, and severity levels, supporting effective decision-making to improve overall safety conditions and reduce risks in various workplace environments.
Key Terms to Know
- Total Injury Events: Displays the total number of reported workplace injuries within the selected period.
- Severe Injuries: Highlights the count of serious injuries requiring significant attention.
- Moderate Injuries: Shows the number of injuries classified as moderately impactful.
- Minor Injuries: Indicates the count of less critical injuries reported.
- Injury Rate per 100 Employees: Calculates the frequency of injuries relative to the workforce size.
- Lost Workdays: Represents the total number of workdays missed due to injuries.
- Injury Severity by Department: Breaks down injury severity across departments for deeper insights.
- Injury Events Over Time: Tracks the timeline of reported injuries to spot trends.
- Cumulative Injury Rate by Severity: Displays cumulative rates for different injury severity levels over time.
- Injury Type Distribution: Visualizes the proportion of injuries by severity categories.
- Injury Events by Location: Details the distribution of injuries across various workplace locations.
Factors Contributing to Incidents
This screen provides a clear overview of factors contributing to workplace incidents, highlighting patterns and trends across various conditions. It uses visual comparisons and segmented data to help users analyze root causes effectively, enabling better decision-making to enhance safety measures and minimize potential risks.
Key Terms to Know
- Total Human Factor Events: Displays the number of workplace incidents caused by human factors within the selected period.
- Total Environmental Factor Events: Shows the total number of incidents attributed to environmental conditions.
- Most Common Factor: Highlights the most frequent contributing factor to workplace incidents.
- Top Environmental Factors: Lists the leading environmental causes of workplace incidents, such as equipment failure or poor lighting.
- Environmental Factors Over Time: Tracks how environmental factors contributing to incidents have varied over a specific timeline.
- Human vs Environmental Factors: Presents the percentage breakdown of incidents caused by human versus environmental factors.
- Top Human Factors: Highlights the most significant human-related contributors to workplace incidents, like fatigue or lack of training.
- Incident Flows by Severity and Factor: Categorizes incidents by their severity levels and contributing factors, from minor to severe.
Incident Severity and Response Efficiency
This screen provides an overview of workplace safety incidents. 1 It shows the average response time for incidents, the percentage of events resolved within an hour, and the number of high-risk incidents in the last month. It also includes data on incident resolution time, response efficiency, and incident count by location and response time. 2
Key Terms to Know
- Average Response Time: Shows the average time it takes to respond to workplace incidents.
- Events Resolved within 1 Hour: Tracks the percentage of incidents resolved within the first hour.
- High-Risk Incidents in Last Month: Indicates the number of high-risk incidents that occurred in the past month.
- Incident Resolution Time Comparison: Compares the resolution time for incidents across different months.
- Incident Count by Location: Displays the number of incidents reported in different locations.
- Response Efficiency: Measures the effectiveness of the response to incidents.
- Incident Count by Response Time: Shows the number of incidents categorized by their response time.
Dashboard Template Insights
Here are the key insights the dashboard wireframe provides:
- Key metrics like incident rates, severity levels, and root causes empower safety managers to identify high-risk areas and allocate resources effectively.
- By tracking trends and patterns in accidents, organizations can implement preventive measures and reduce the likelihood of future incidents.
- Dashboards that visualize safety performance can help foster a culture of safety awareness and accountability among employees.
- Dashboards can help organizations comply with safety regulations and generate reports for internal and external stakeholders.
Conclusion
This dashboard empowers safety professionals with data-driven insights to identify trends, prioritize interventions, and drive a culture of safety. By visualizing key metrics and incident patterns, organizations can proactively address risks, improve response times, and ultimately reduce workplace accidents and injuries.