What is a Work Efficiency Monitor Dashboard?
A Work Efficiency Monitor Dashboard template is used by managers and HR teams to track task completion, time utilization, and team performance. It provides insights into how effectively employees use their work hours, complete assignments, and contribute to organizational goals, helping businesses boost productivity and make informed decisions.
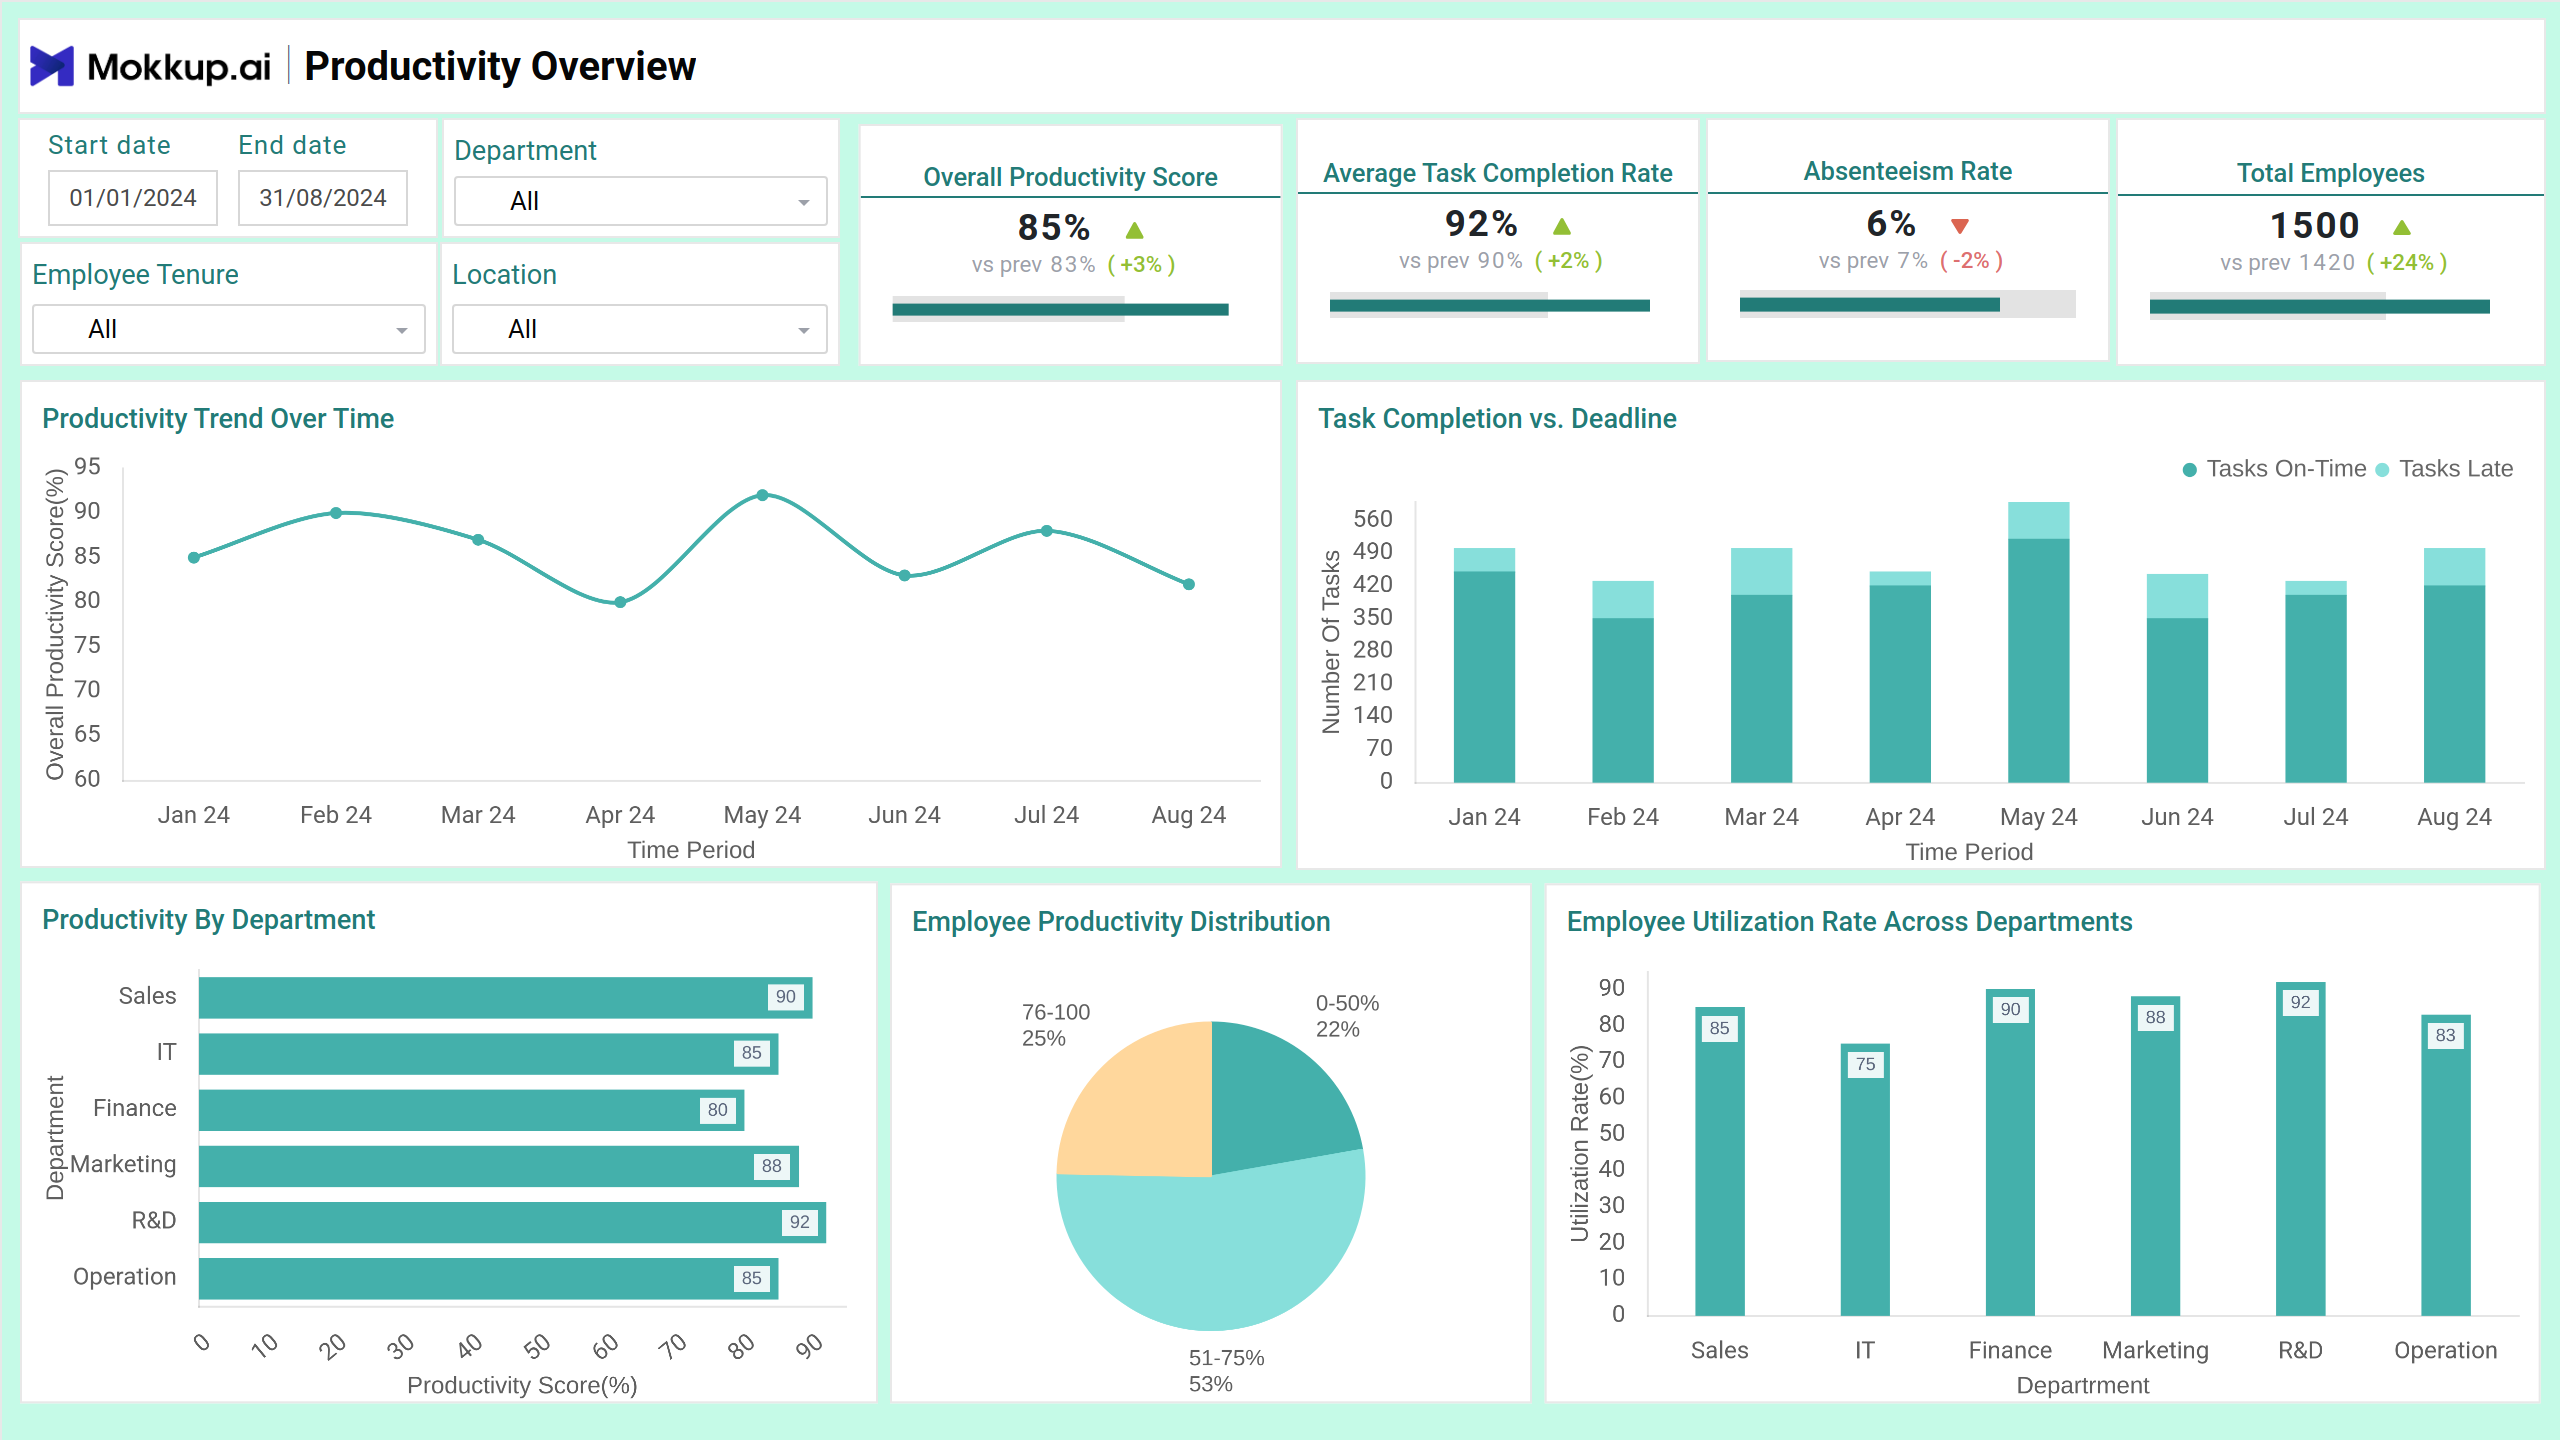
Work Efficiency Dashboard Example
The Work Efficiency Monitor Dashboard template provides a real-time snapshot of employee performance, time usage, and productivity across teams. Designed for HR managers, team leads, and business analysts, this dashboard wireframe visualizes key efficiency metrics like task completion rate, absenteeism, and time allocation across departments. It helps organizations identify bottlenecks, assess training effectiveness, and optimize resource allocation for improved workforce output.
How to Analyze Data in Work Efficiency Dashboards
The Employee Productivity Tracker helps organizations boost productivity, identify improvement areas, and align employee output with business goals. Here’s how to approach it:
- Track productivity trends over time using line charts that reflect fluctuations in task completion rates and time utilization.
- Compare departmental efficiency with bar and pie charts showing task output, absenteeism, and utilization rate.
- Assess the impact of training programs by linking participation rates with improvements in output and time efficiency.
- Monitor time allocation using pie charts and task-type distributions to evaluate whether employee hours are being spent on high-value activities.
- Filter by tenure, location, or skill set to analyze how different workforce segments perform and identify trends in performance across employee groups.
The dashboard wireframe turns daily activity data into clear, actionable insights, helping leaders optimize team operations and drive efficient work habits across the organization.
How to Create a Work Efficiency Dashboard
You don’t need to build your report from scratch—just start with a ready-to-use sample Work Efficiency Monitor Dashboard template from Mokkup. Add in your data and export it however you like. Here’s how to do it:
1. Create or Log in to Your Mokkup Account
Start by signing up on Mokkup.ai using your email. Already have an account? Just log in, and you’re good to go.
2. Choose and Customize Your Dashboard Template
Find the Work Efficiency Monitor Dashboard in the Templates section. Use the drag-and-drop editor to adjust KPIs, edit filters, or add elements based on your data.
3. Export to Your BI Tool
Once your dashboard wireframe is ready, use the BI Tool Export feature to send it directly to Power BI or Tableau for further analysis and enhancements. You can also download the dashboard as a PDF, PNG, or JPEG, embed it on a platform, or invite your team to collaborate.
Note: This is a Pro template. To use and customize this dashboard wireframe, you’ll need a Pro subscription on Mokkup. Upgrade anytime to unlock full access.
Benefits of Work Efficiency Dashboards
Work Efficiency Dashboards help teams and leaders improve performance by turning raw work data into clear, actionable insights.
- Track real-time productivity to identify dips before they affect results.
- Compare performance across departments to understand where to focus support or resources.
- Monitor absenteeism and task completion to get a clear picture of team engagement.
- Evaluate training effectiveness by seeing how learning impacts work output.
- Improve time management by identifying where teams spend the most time and where time is being wasted.
These dashboards offer a clear view of performance and behavior patterns, helping build smarter teams and drive better results every day.
KPIs to Track in Efficiency Dashboards
Tracking the right KPIs in a Work Efficiency Dashboard wireframe ensures that teams stay focused, productive, and aligned with business goals. These metrics help monitor time usage, task outcomes, and employee performance.
- Overall Efficiency Score: A combined score based on productivity, task completion, and utilization metrics.
- Task Completion Rate: Percentage of tasks completed on time vs. assigned tasks.
- Absenteeism Rate: Tracks employee attendance and time off to identify trends affecting productivity.
- Time Efficiency: Measures how well employees use their work hours to finish tasks.
- Training Participation: Monitors how many employees engage in training programs.
- Skill Impact Score: Evaluates how specific skills contribute to improved performance.
These KPIs help leaders pinpoint where improvements are needed and where teams are excelling.
Frequently Asked Questions
Q1. What does a Work Efficiency Monitor Dashboard track?
It tracks task completion rates, time usage, absenteeism, and training participation to provide insights into overall employee and departmental efficiency.
Q2. Who should use this dashboard?
HR teams, department managers, and team leads can use it to monitor workforce productivity, identify inefficiencies, and make data-driven decisions.
Q3. How does it help improve performance?
The dashboard enables timely interventions and smarter resource allocation by highlighting trends, bottlenecks, and training needs.