
A Utilization Analytics Dashboard template is used by logistics and supply chain professionals to monitor and analyze various aspects of their operations. It provides insights into key performance indicators (KPIs) and metrics related to the utilization of resources, such as transportation vehicles, warehouses, inventory, and personnel.
Utilization Analytics 1
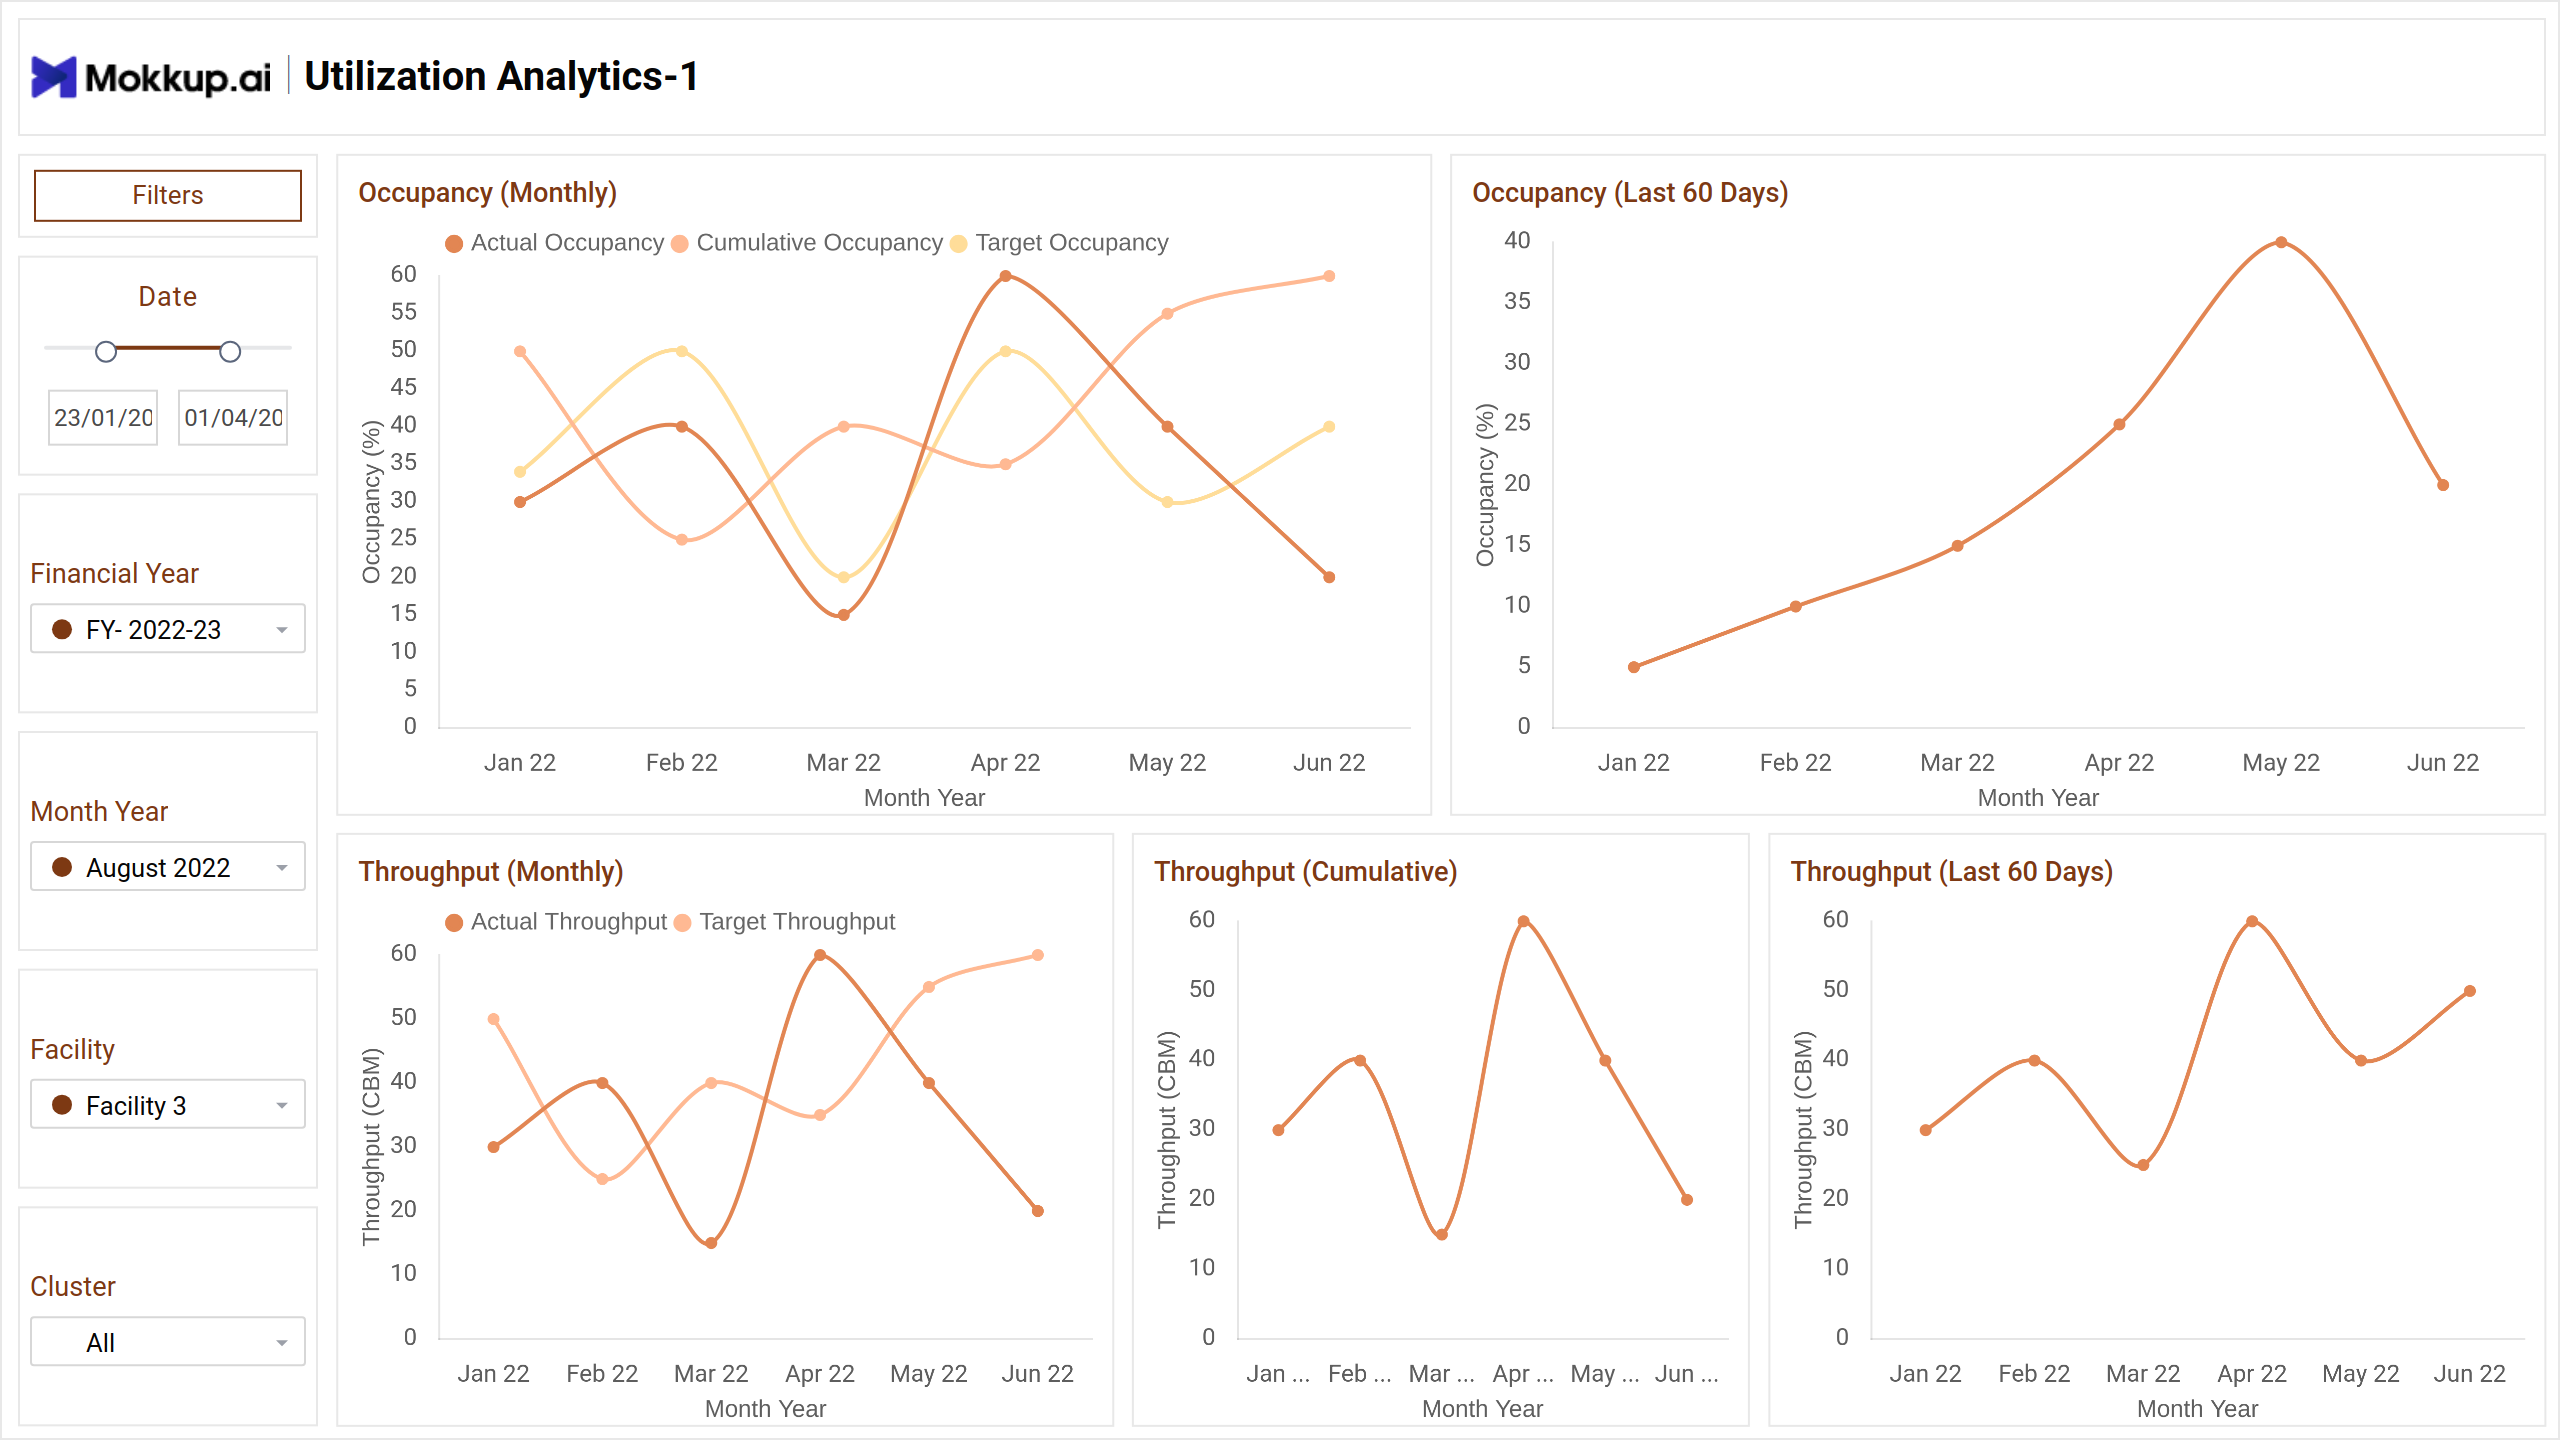
The Screen 1 of a utilization analytics dashboard wireframe focuses on occupancy and throughput metrics over monthly and 60-day periods.
Key Terms to Know
Occupancy Metrics -
- Occupancy Monthly: It tracks average and peak actual occupancy rates, fluctuations throughout the month, and compares them to predefined targets. It also provides information on cumulative utilization over the course of the month.
- Occupancy Trend - 60 Days: The trend of occupancy rates over the past 60 days, highlights any patterns or fluctuations in resource utilization. It helps in identifying long-term trends and seasonality in occupancy rates.
Throughput Metrics -
- Monthly Throughput: In order to make performance evaluation against predetermined targets easier, it displays actual vs target throughput data for monthly logistical operations. These metrics include volume moved, orders processed, and units manufactured.
- Cumulative Throughput: It offers insights into overall performance and productivity over an extended period. It helps evaluate the long-term stability and effectiveness of operations.
- Throughput Trend - 60 Days: Represents a trend analysis of throughput metrics over the past 60 days, highlighting any significant changes or trends in operational performance.
Utilization Analytics 2
Screen 2 of the utilization analytics dashboard wireframe provides a comprehensive overview of KPIs related to operational efficiency and workforce productivity.
Key Terms to Know
- Recovered OT%: It showcases the actual reduction in overtime hours achieved through optimization efforts, the cumulative reduction over a specified period to highlight long-term trends, and a predefined target for reducing overtime hours.
- Opportunities for New Potential: It presents a predetermined target for the quantity of opportunities found, together with the actual opportunities that have been identified for improving efficiency or cutting costs within the logistics process.
- Employee Productivity: It measures how efficiently employees work in logistics, tracks cumulative productivity trends, and sets targets to align with operational goals.
Utilization Analytics 3
Screen 3 of the utilization analytics dashboard wireframe provides an overview of key metrics related to inventory management and customer satisfaction.
Key Terms to Know
- Inventory Accuracy: It assesses the current and cumulative accuracy of inventory records against established goals.
- % of Unresolved Customer Complaints: It tracks the current and cumulative percentage of unresolved complaints, helping in the identification of trends and guiding efforts to enhance customer service.
- On-time Invoice: Measures the percentage of invoices delivered within the agreed-upon timeframe, both currently and cumulatively.
- Invoice Accuracy: Evaluates the accuracy of invoices sent to customers.
Utilization Analytics 4
The 4th screen of the utilization analytics dashboard wireframe provides a detailed view of key performance indicators (KPIs) related to cargo dispatch and transportation efficiency.
Key Terms to Know
- % of Online Cargo Dispatch/Receipt: Shows the current, cumulative, and target numbers for the percentage of cargo dispatches and receipts that are made online on a monthly and past 60-day basis.
- % Delivering Correct Type of Cargo with Accurate Quantity: It provides actual, cumulative, and target numbers in order to accurately evaluate the percentage of deliveries that satisfy requirements.
- On-time Transportation: It determines the percentage of transportation services that are finished within the set duration limit while taking target, cumulative, and current values into account.
Dashboard Template Insights
To provide a comprehensive overview of operational efficiency, the dashboard template incorporates the following key elements:
- To maximize resources, reduce expenses, and improve performance, the dashboard wireframeexamines key performance indicators (KPIs) like occupancy, throughput, and staff productivity.
- It also tracks inventory accuracy and recovered OT% to improve operational efficiency, guiding process enhancements and streamlining operations.
- It helps in monitoring unresolved complaints and timely invoicing enhances proactive issue resolution, increasing customer satisfaction. Evaluating online cargo dispatch and transport efficiency improves digital transformation assessment, enhancing agility and service.
Conclusion
Utilization Analytics Dashboard template offers practical insights that can be used to improve customer satisfaction, increase operational efficiency, and maximize resource usage. By harnessing key metrics and trends, businesses can make informed decisions, drive performance improvements, and stay competitive in dynamic markets.