
What is a Telemedicine Patient Engagement & Retention Dashboard?
A Telemedicine Patient Engagement & Retention Dashboard is a healthcare analytics tool that tracks how effectively a telemedicine platform engages and retains patients over time. It consolidates key patient engagement metrics for telehealth platforms, such as appointment completion, communication responsiveness, and follow-up adherence.
The dashboard provides healthcare providers with data-driven insights into patient satisfaction and behavior trends. Using telemedicine patient retention analytics, organizations can measure whether their digital care strategies are building trust and loyalty among patients. This helps identify where engagement gaps occur—such as long wait times, missed follow-ups, or delayed responses—and enables timely intervention.
Overall, this healthcare telemedicine dashboard design gives a unified view of the patient experience lifecycle, improving care continuity and operational efficiency across telemedicine platforms.
How to Create a Telemedicine Patient Engagement & Retention Dashboard
You don’t need to build your report from scratch—start with a ready-to-use dashboard template from Mokkup. Add your data and export it as needed. Here’s how to do it:
1. Create or Log in to Your Mokkup Account
Start by signing up on Mokkup.ai using your email. If you already have an account, log in, and you’ll be good to go.
2. Choose and Customize Your Dashboard Template
Find the Telemedicine Patient Engagement & Retention Dashboard template in the Templates section. Use the drag-and-drop editor to adjust KPIs, edit filters, or add elements based on your data.
3. Export to Your BI Tool
Once your dashboard wireframe is ready, use the BI Tool Export feature to send it directly to Power BI or Tableau for further analysis and enhancements. You can also download the dashboard as a PDF, PNG, or JPEG, embed it on a platform, or invite your team to collaborate.
Note: This is a Pro template. You’ll need a Pro subscription on Mokkup to use and customize this dashboard wireframe. Upgrade anytime to unlock full access.
Telemedicine Patient Engagement & Retention Dashboard Example
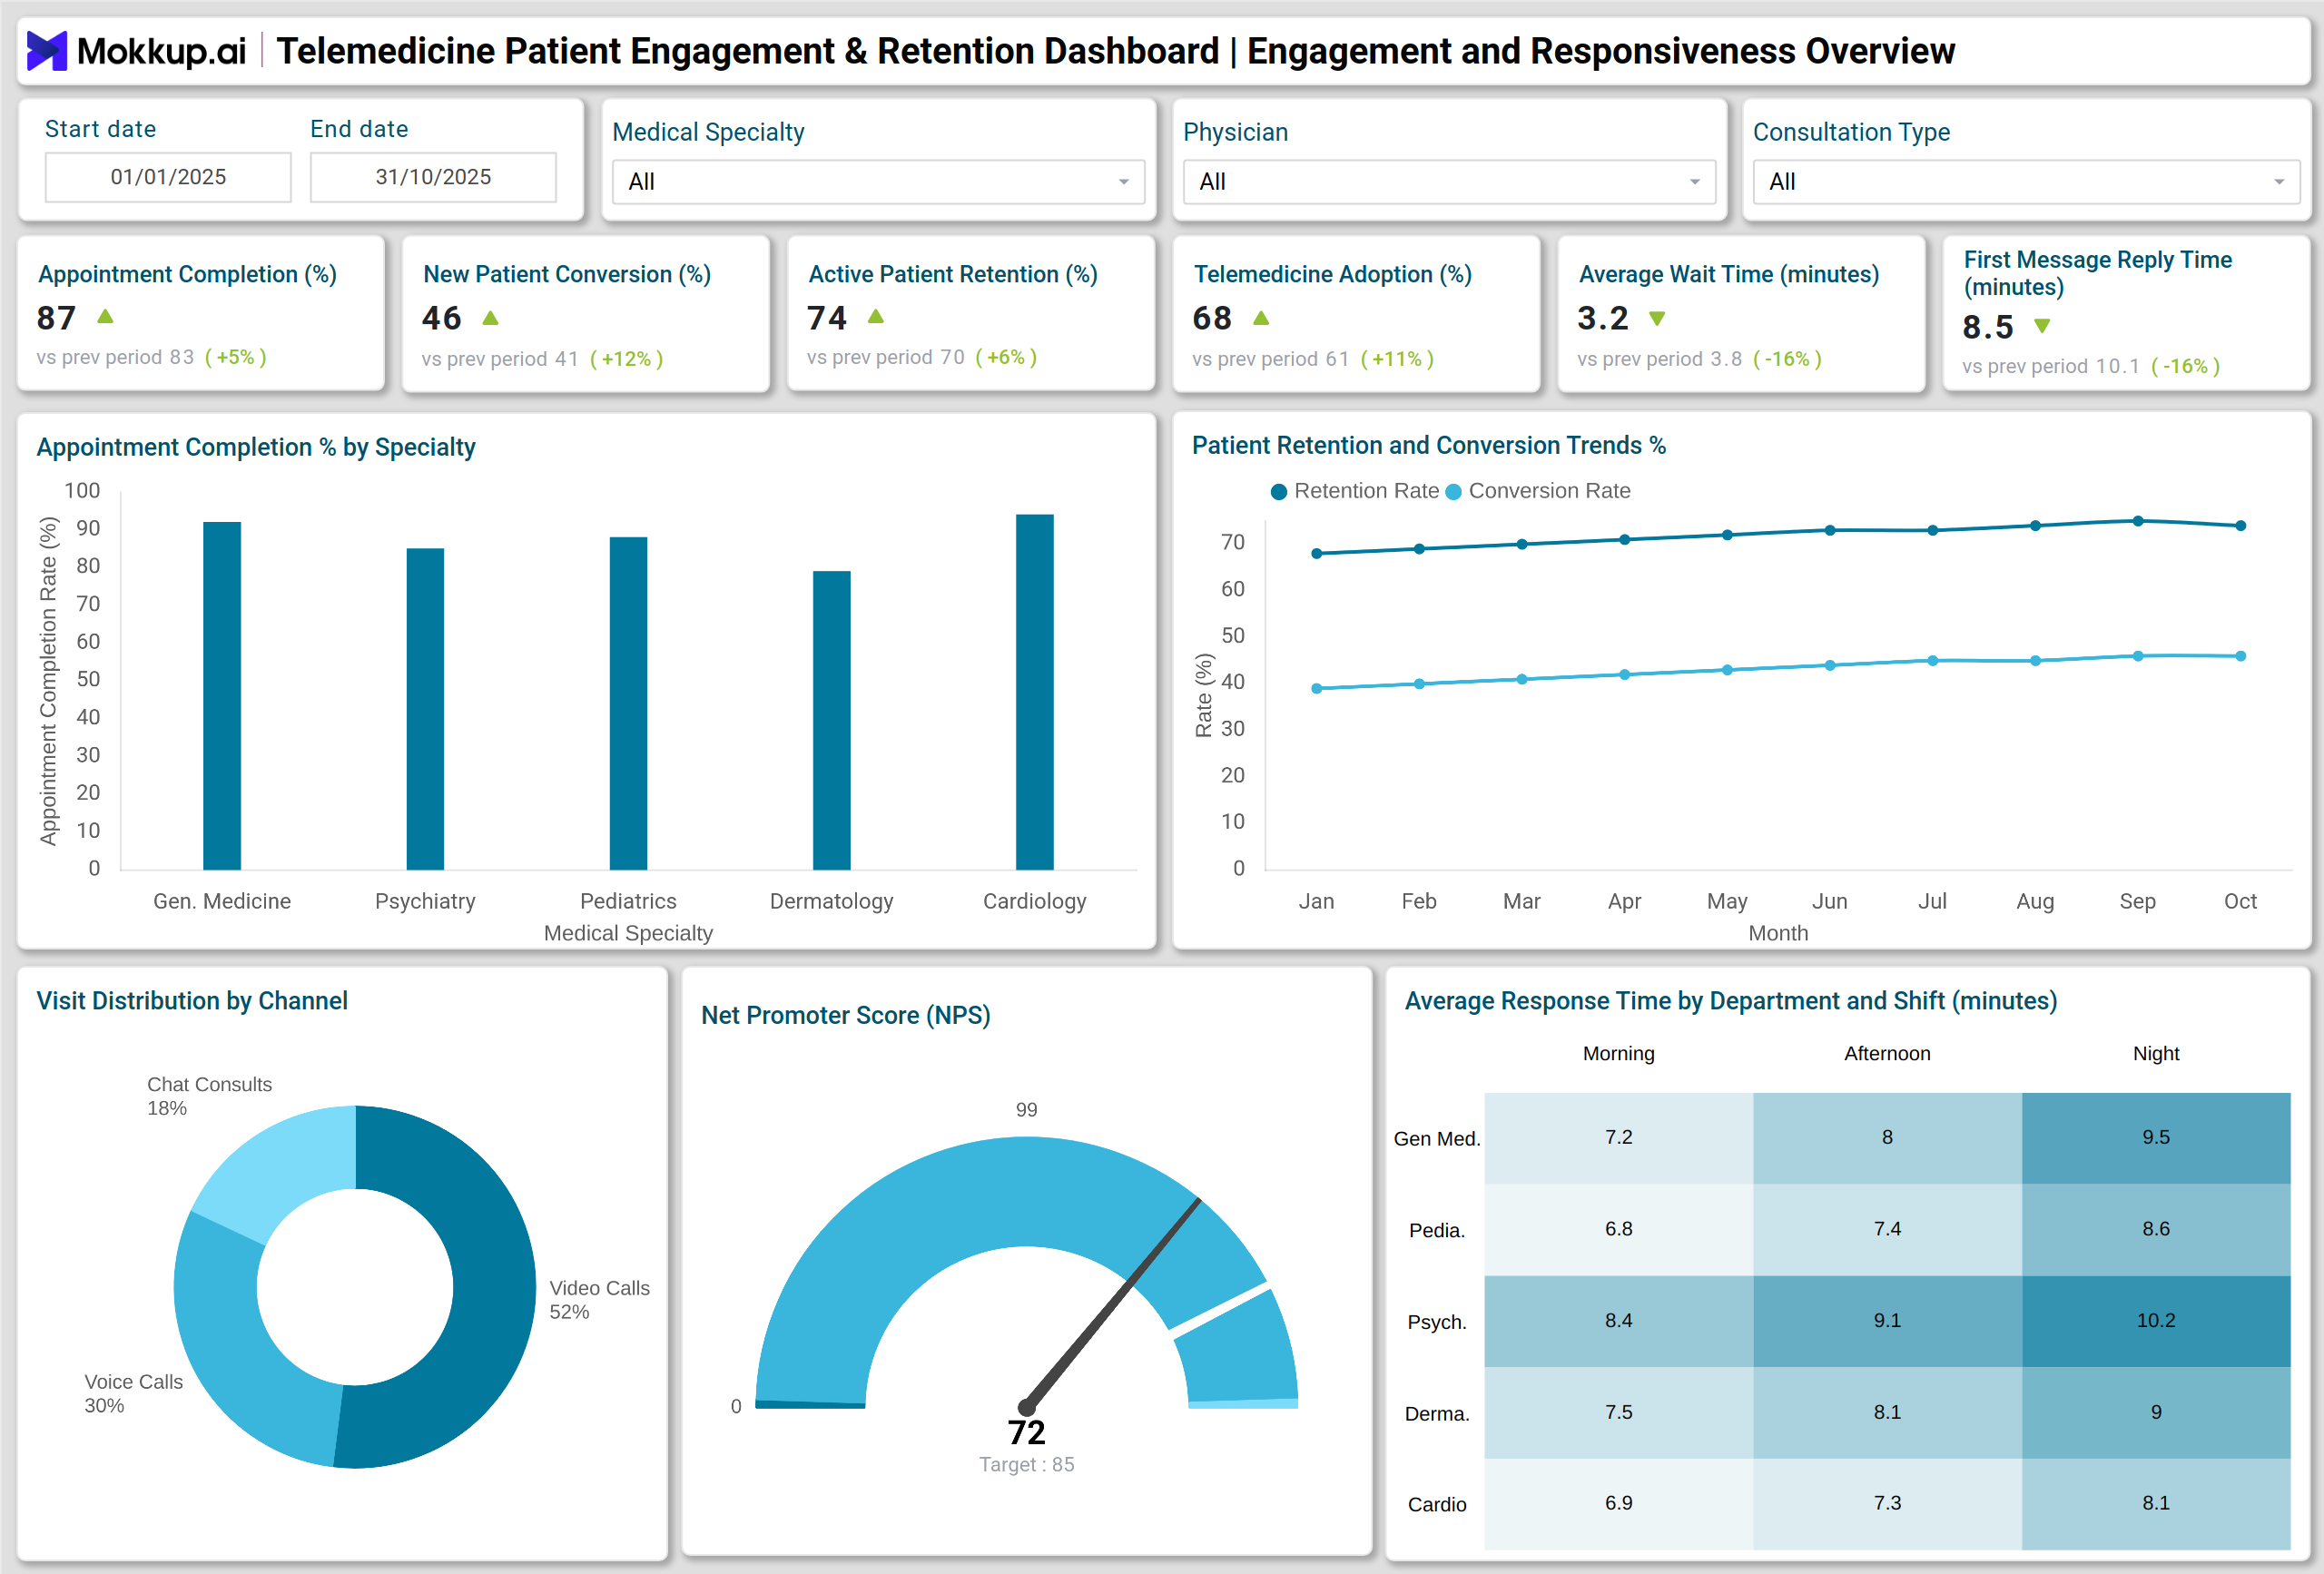
A typical telemedicine patient engagement dashboard visualizes the complete patient journey, from booking an appointment to completing follow-ups. It integrates performance charts and analytics visuals to measure engagement across multiple virtual care touchpoints. Additionally, visuals such as the Funnel Chart for Patient Journey Conversion Flow and the Waterfall Chart for Retention Impact Analysis demonstrate how specific operational improvements—such as reducing wait time or enhancing app usability—directly impact retention outcomes. This example demonstrates how a virtual care engagement performance tracking system transforms raw telehealth data into actionable insights.
How to Analyze Data in Telemedicine Patient Engagement & Retention Dashboards
- Monitor Patient Conversion Trends: Track the number of new patients who convert into recurring patients to assess engagement success.
- Evaluate Retention Drivers: Use retention metrics to identify factors improving loyalty, such as prompt communication or shorter wait times.
- Measure Communication Efficiency: Analyze Time to First Message Reply and Chat Response Time to ensure timely patient interactions.
- Track Follow-up Compliance: Review adherence rates to understand how well patients stick to recommended virtual follow-ups.
- Benchmark Satisfaction Scores: Compare Average Consultation Rating and NPS Gauge Chart to evaluate service quality across providers.
- Analyze Complaint Categories: Use treemaps to categorize issues and target areas with frequent patient dissatisfaction.
Benefits of Telemedicine Patient Engagement & Retention Dashboards
- Improved Patient Loyalty: Helps healthcare organizations retain patients through consistent engagement monitoring.
- Data-Driven Decision Making: Provides visual insights for telemedicine managers to make informed operational improvements.
- Enhanced Patient Experience: Identifies and resolves friction points like long wait times or unresponsiveness.
- Better Staff Performance Tracking: Compares department-wise response times and consultation ratings.
- Operational Efficiency: Streamlines virtual care workflows by aligning engagement metrics with performance outcomes.
- Regulatory and Quality Compliance: Ensures telehealth practices meet quality standards for patient care continuity.
KPIs to Track in Telemedicine Patient Engagement & Retention Dashboards
- Appointment Completion Rate (%): Measures the percentage of scheduled tele-visits completed.
- New Patient Conversion to Recurring Patient (%): Tracks how effectively new patients return for future consultations.
- Active Patient Retention Rate (%): Indicates the percentage of patients who remain active over time on the telemedicine platform.
- Telemedicine Adoption Rate (%): Measures the frequency at which patients opt for telemedicine over in-person visits.
- Average Wait Time to Join Televisit (Minutes): Evaluates accessibility and user experience during virtual check-ins.
- Time to First Message Reply (Minutes): Measures provider responsiveness to patient queries or concerns.
- Churn Rate (%): Identifies the percentage of patients who stop using the telemedicine service.
These patient retention KPIs on telemedicine platforms help healthcare leaders evaluate the quality of engagement and design strategies to improve patient loyalty across virtual care environments.
Frequently Asked Questions
Q1. Who uses a Telemedicine Patient Engagement & Retention Dashboard?
Healthcare administrators, telemedicine platform managers, and patient experience teams use it to monitor engagement trends and optimize virtual care delivery.
Q2. How does this dashboard improve patient retention?
By analyzing key metrics such as response time, satisfaction ratings, and adherence rates, organizations can develop strategies that reduce churn and enhance loyalty.
Q3. How often should this dashboard be reviewed?
Weekly reviews are ideal for tracking short-term trends, while monthly analysis supports strategic planning for patient retention.