
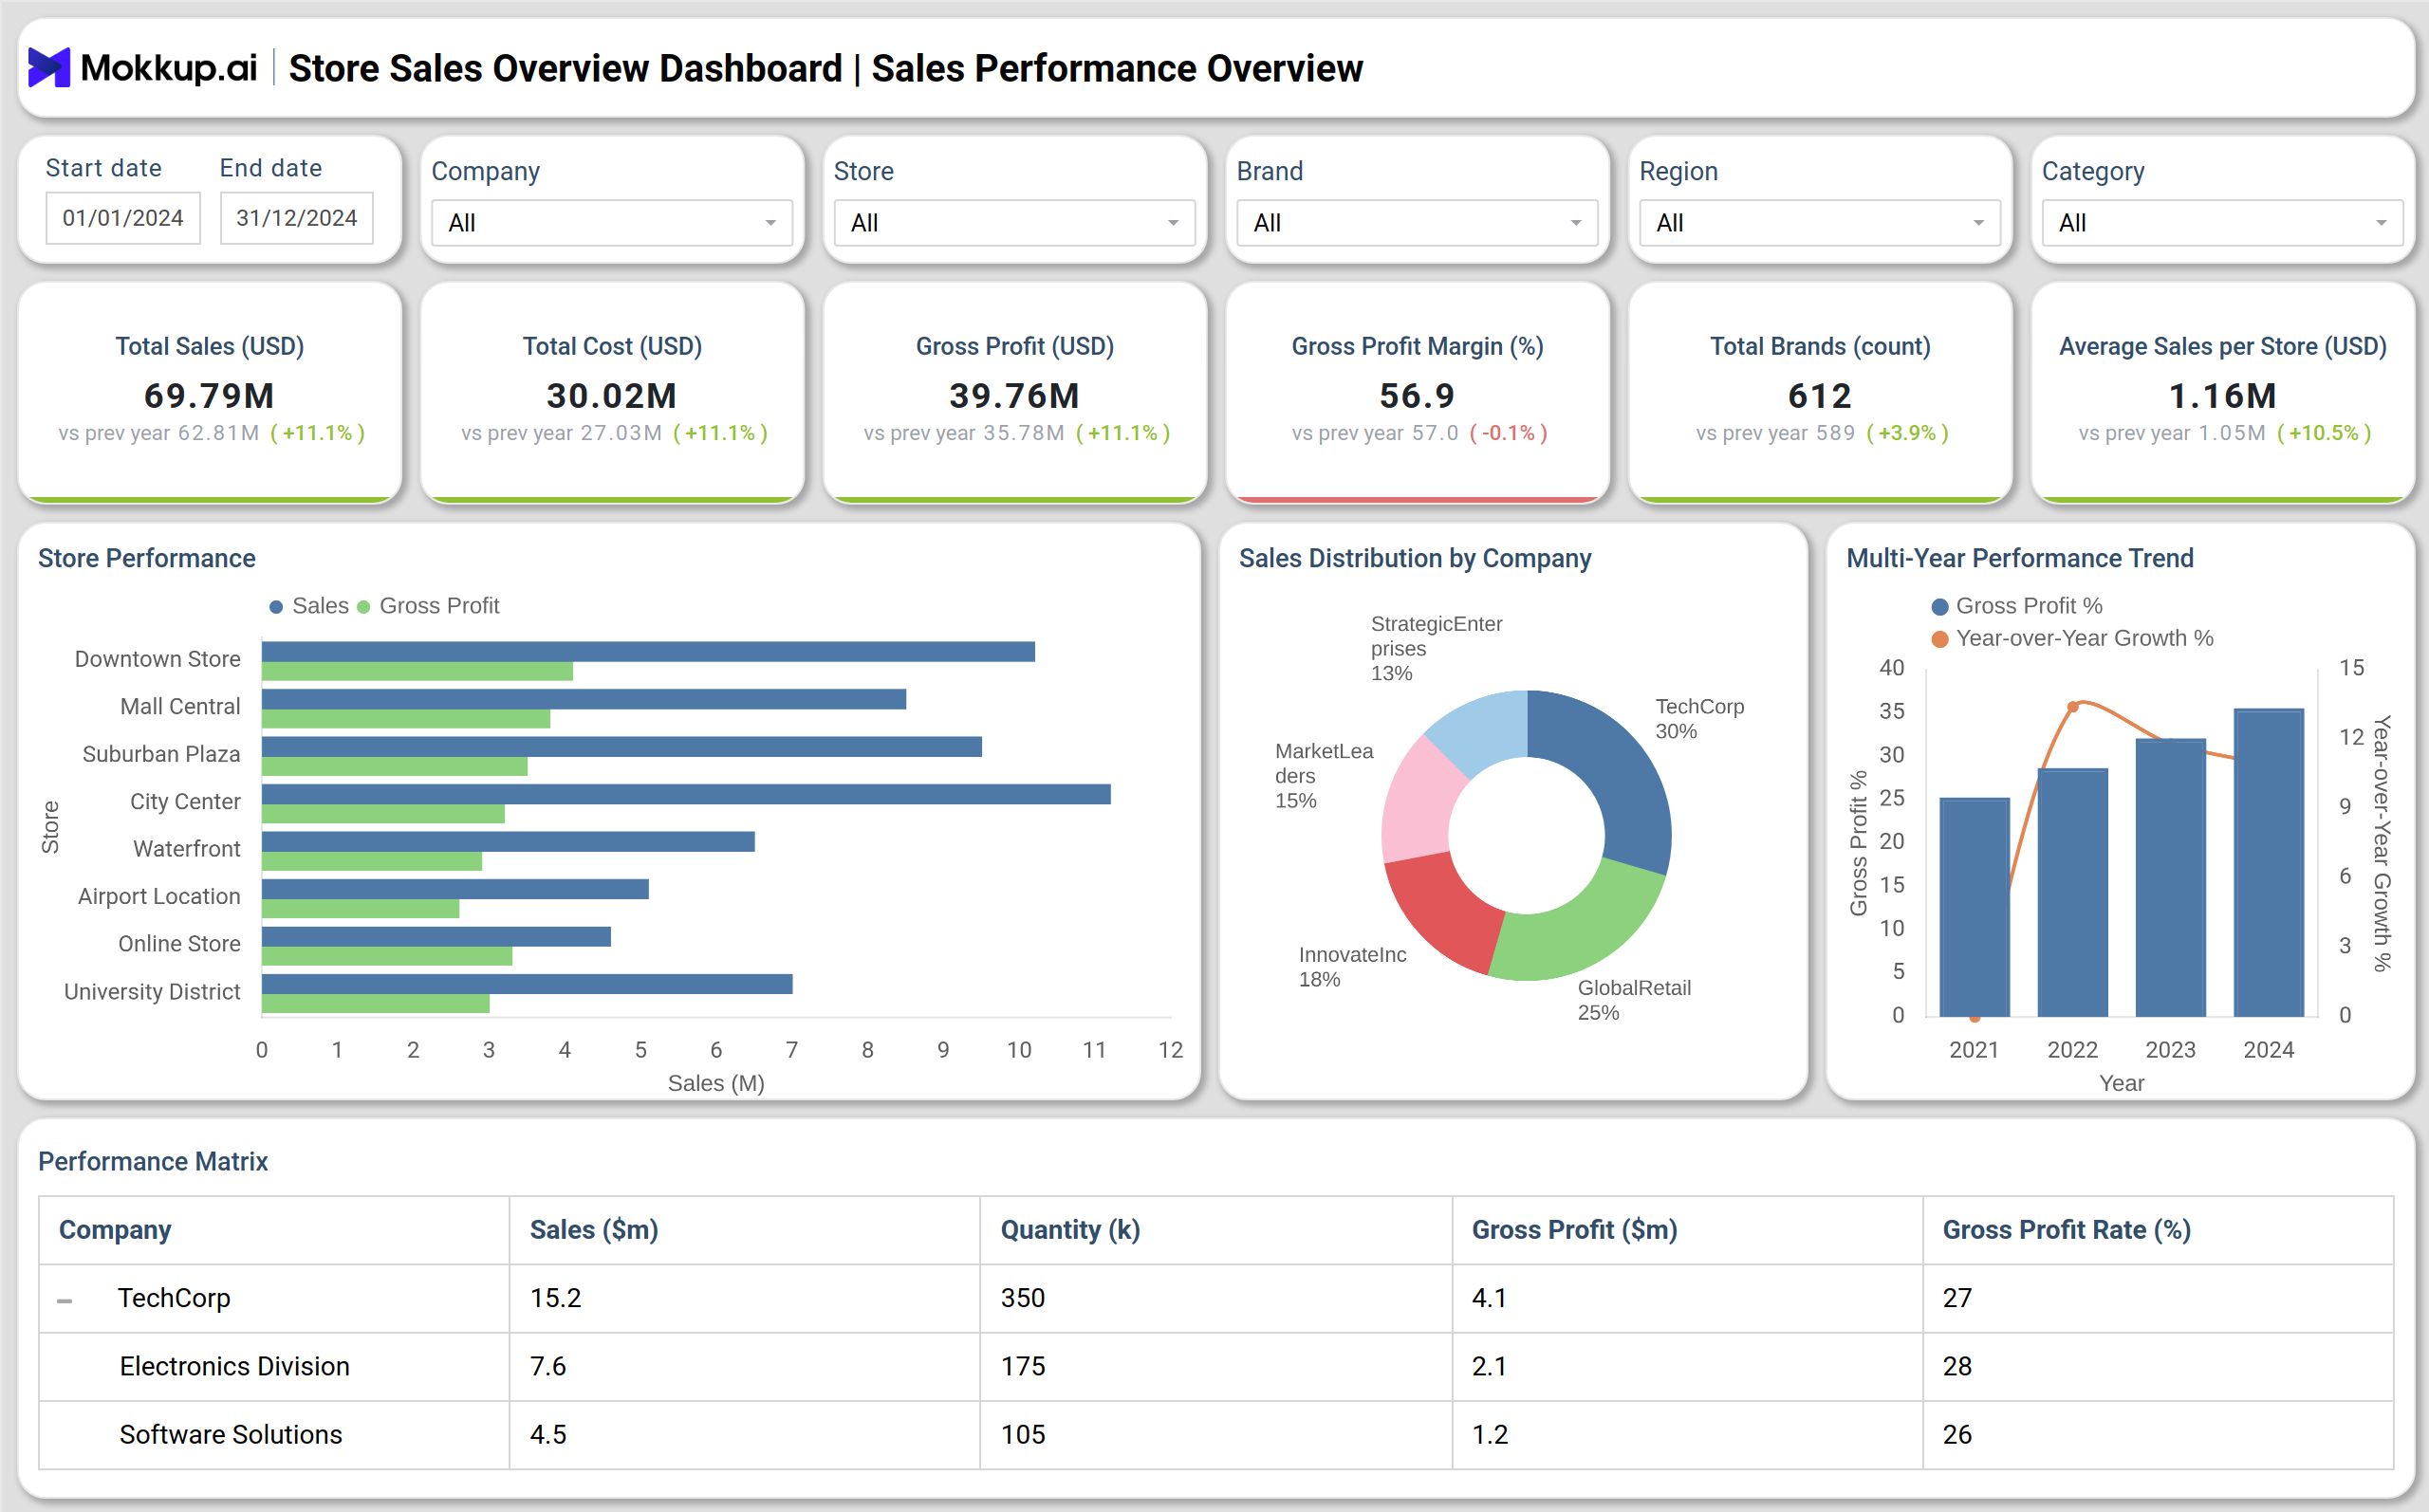
What is a Store Sales Overview Dashboard?
A Store Sales Overview Dashboard template is a data visualization and analytics tool that consolidates all key retail performance metrics into one interactive view. It helps retailers monitor store-level and enterprise-wide sales performance, analyze gross profit, and identify top-performing stores, brands, and product categories.
This retail store sales analytics dashboard lets decision-makers track total revenue, cost, and profit trends across multiple outlets. It also provides detailed insights into sales by product category, transaction count, and average basket value, allowing retail teams to make informed decisions that improve profitability and customer experience. Whether you operate a single outlet or a multi-location retail network, the dashboard wireframe provides a unified platform for understanding in-store trends, managing store efficiency, and optimizing product mix for sustained growth.
How to Create a Store Sales Overview Dashboard
You don’t need to build your report from scratch—just start with a ready-to-use dashboard template from Mokkup. Add in your data and export it however you like. Here’s how to do it:
1. Create or Log in to Your Mokkup Account
Start by signing up on Mokkup.ai using your email. If you already have an account, just log in, and you’ll be good to go.
2. Choose and Customize Your Dashboard Template
Find the Store Sales Overview Dashboard template in the Templates section. Use the drag-and-drop editor to adjust KPIs, edit filters, or add elements based on your data.
3. Export to Your BI Tool
Once your dashboard wireframe is ready, use the BI Tool Export feature to send it directly to Power BI or Tableau for further analysis and enhancements. You can also download the dashboard as a PDF, PNG, or JPEG, embed it on a platform, or invite your team to collaborate.
Note: This is a Pro template. You’ll need a Pro subscription on Mokkup to use and customize this dashboard wireframe. Upgrade anytime to unlock full access.
Store Sales Overview Dashboard Example
You can create your own Store Sales Overview Dashboard to evaluate business performance across multiple stores and categories. The dashboard includes two primary screens: Strategic Business Performance Overview and Store Sales Performance, each focusing on specific layers of retail analytics. The first screen, Strategic Business Performance Overview, offers an executive summary of total sales, gross profit, costs, and year-over-year growth across all stores. It highlights KPIs such as total brands, gross profit margin, and average sales per store. Visuals like bar charts and combo graphs provide quick insight into top-performing stores, company-level contributions, and multi-year profit trends.
The second screen, Store Sales Performance, provides a detailed operational view for store managers and analysts. It includes KPIs like store sales, gross profit, total transactions, average basket value, and return rate. Charts show sales by product category, top SKU performance, and discount impact. The built-in multi-location store sales tracking dashboard structure allows users to switch between stores, time periods, or product groups effortlessly. Together, these dashboards form a comprehensive store sales performance review dashboard, enabling teams to connect strategy with execution, assess category efficiency, and benchmark store-level productivity.
How to Analyze Data in Store Sales Overview Dashboard
To use the Store Sales Overview Dashboard effectively, focus on key metrics that reveal revenue trends, profitability, and operational performance across stores:
- Track Total and Gross Sales: Monitor total revenue and gross profit trends to identify growth patterns across regions and stores.
- Compare Store Performance: Use side-by-side bar charts to compare sales and profit across different store locations or regions.
- Analyze Category Sales: Evaluate which product categories contribute most to total sales and profit margins.
- Identify Top-Selling SKUs: Review SKU-level performance to determine which products drive the highest sales volume or margin.
- Monitor Return and Discount Trends: Examine return rates and average discounts to assess pricing effectiveness and customer satisfaction.
- Evaluate Transaction Behavior: Track total transactions and average basket value to understand store traffic and purchase frequency.
- Measure Year-over-Year Growth: Analyze gross profit and revenue growth over multiple years to gauge strategic performance.
- Drill Down into Transactions: Use the transactions table to review item-level details like date, SKU, quantity, and sales amount for in-depth analysis.
- Segment by Brand or Region: Filter the dashboard by company, brand, or location to isolate performance insights for targeted decision-making.
- Monitor Promotional Impact: Track the effect of campaigns or discounts on store-level performance metrics.
Benefits of Store Sales Overview Dashboard
The Store Sales Overview Dashboard simplifies retail management by centralizing performance insights for informed, data-driven decisions:
- Centralized Retail Performance Tracking: Consolidates all store sales, costs, and profits into a single analytical view for better control.
- Multi-Location Visibility: The physical store sales tracking platform supports performance comparisons across outlets, cities, or regions.
- Data-Driven Decision-Making: Helps executives and managers make quick, evidence-based business decisions based on accurate KPIs.
- Improved Operational Efficiency: Identifies underperforming stores or categories, enabling targeted interventions to boost productivity.
- Profitability Optimization: Tracks gross profit margin, discount levels, and return rates to maximize net gains.
- Real-Time Insights: Provides up-to-date sales, cost, and profit data for agile decision-making and rapid issue resolution.
- Enhanced Forecasting: Historical and trend-based data improve demand forecasting and inventory management.
- Customizable Views: Flexible filters allow managers to focus on specific stores, time periods, or products.
- Performance Benchmarking: Enables comparative analysis of store efficiency and employee productivity.
- Integrated Reporting: The in-store sales reporting dashboard combines visual and tabular data for clear, actionable insights.
KPIs to Track in Store Sales Overview Dashboard
Tracking the right KPIs ensures complete visibility into store and category performance:
- Total Sales ($): Tracks total revenue generated across stores for the selected time period.
- Gross Profit ($): Measures profit after deducting cost of goods sold, helping gauge operational efficiency.
- Gross Profit Margin (%): Represents profitability percentage and identifies stores with optimal cost structures.
- Average Sales per Store ($): Indicates average performance across multiple outlets, ideal for benchmarking.
- Total Transactions (Count): Measures total purchase instances, reflecting store traffic and activity levels.
- Average Basket Value ($): Calculates the average value of customer purchases to assess upselling performance.
- Sales by Category (%): Highlights the contribution of product categories to total store sales.
Frequently Asked Questions
Q1. What is the purpose of a Store Sales Overview Dashboard?
It helps retail leaders and store managers analyze overall sales, profitability, and performance trends across locations in real time.
Q2. Can it track multiple store locations simultaneously?
Yes, this multi-location store sales tracking dashboard allows users to view and compare results across several stores.
Q3. Who should use this dashboard?
Retail executives, regional managers, and data analysts who oversee performance and profitability use this dashboard regularly.
Q4. Does it include SKU-level tracking?
Yes, SKU and category-level performance are integrated to show detailed sales distribution.
Q5. How does it support decision-making?
The dashboard provides data-driven insights that enable better pricing, inventory, and promotional strategies.