The store operations dashboard template provides an efficient platform for monitoring store performance metrics. Users gain insights into sales, inventory, and customer feedback. Its design simplifies access to vital store operation data, aiding informed decision-making and strategic planning. With this resource, users can enhance store efficiency, driving growth and improving customer satisfaction.
The dashboard wireframe comprises two screens: Overview and Store Wise Performance; each is explained briefly below.
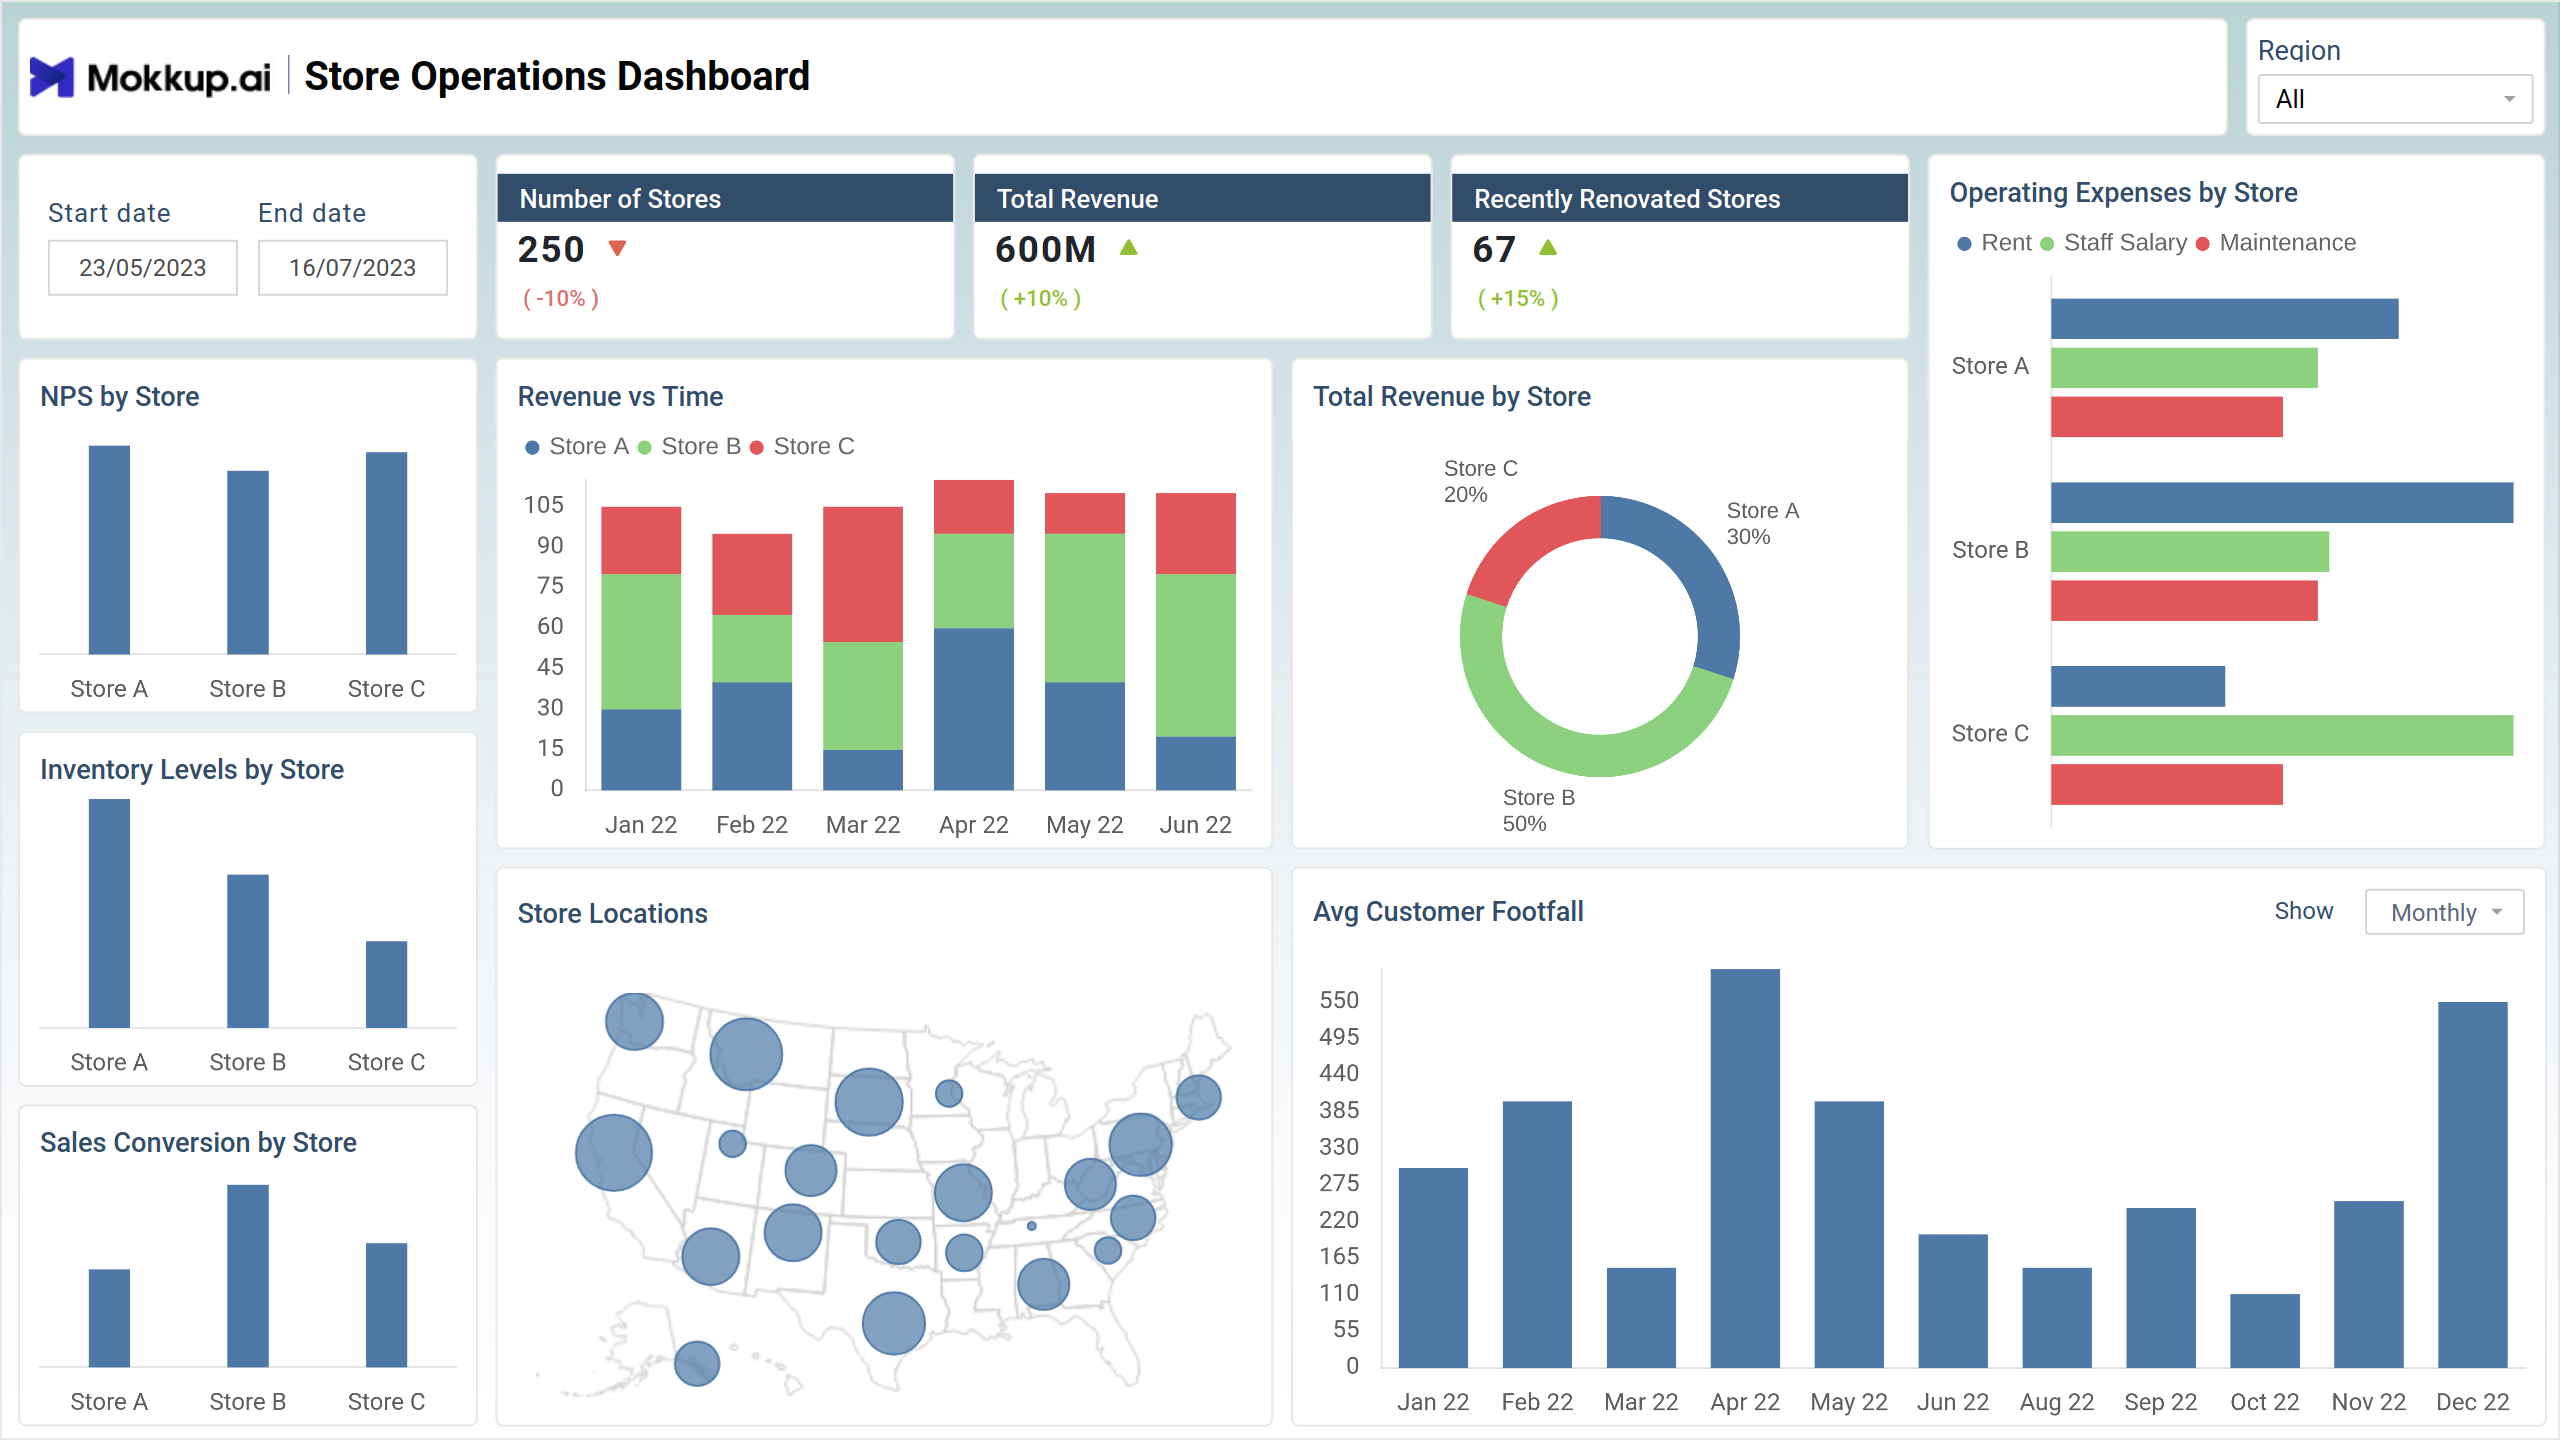
Overview
This wireframe depicts a Store Update Overview Dashboard, designed to give managers a quick view of performance across a chain of stores. The dashboard tracks KPIs like total revenue, number of stores, and recently renovated locations. It also visualizes sales conversion by store over time and allows for filtering by region and date range.
Key Terms to Know
- NPS by Store: Measures each store's Net Promoter Score (NPS), indicating customer satisfaction levels.
- Operating Expenses by Store: Breaks down expenses incurred by each store to assess operational efficiency.
- Revenue vs Time: Illustrates the trend of revenue over different periods.
- Total Revenue by Store: Presents the total revenue generated by each store.
- Sales Conversion by Store: Analyzes the sales ratio to foot traffic, indicating store performance.
- Average Customer Footfall: Calculates the average number of customers visiting each store, aiding in resource allocation and capacity planning.
Store Wise Performance
This view offers a comprehensive view of a store’s performance over a specified timeframe. The dashboard incorporates features like sales conversion rate, revenue trends, and inventory levels, all visualized through charts and graphs. It also includes profit margin data and the option to compare performance against a target. Additionally, the dashboard tracks footfall and the number of products available, offering insights into customer traffic and inventory management.
Key Terms to Know
- Sales Conversion Rate: Measures the percentage of customer visits that result in purchases, reflecting store effectiveness.
- Profit Margin: Evaluate sales profitability by calculating the percentage of revenue retained as profit.
- Number of Products Available: Indicates the total product count within the store inventory.
- Revenue by Product Category: Breaks down revenue generated by different product categories, highlighting top-performing areas.
- Average Footfall per Month: Calculates the mean number of customers visiting the store monthly, aiding in resource planning.
- Operating Expenses vs Time: Tracks the trend of operating expenses over different time intervals to assess cost management efficiency.
Dashboard Template Insights
This dashboard wireframe achieves significant milestones in retail management:
- Provides a comprehensive overview of store metrics, including sales, expenses, and customer feedback, enabling informed decision-making.
- Facilitates detailed examination of individual store performance, allowing for targeted improvements and resource allocation.
- Identifies trends in revenue and sales conversion rates, guiding strategies to maximize profitability and efficiency.
- Streamlines store operations by analyzing foot traffic, inventory levels, and expenses over time, fostering continuous improvement and growth.
Conclusion
In conclusion, the store operations dashboard wireframe is a cornerstone for retail management, providing comprehensive insights into store performance metrics. By enabling granular analysis of individual stores and strategic revenue optimization, it empowers retailers to make informed decisions and drive operational efficiency.