What is a Staff Task Management Dashboard?
A staff task management dashboard is a centralized online platform that helps organizations assign, monitor, and optimize tasks and shifts for employees. This kind of staffing report dashboard integrates task schedules, workforce planning, and shift assignments into one location, allowing employers and managers to get a clear overview of who is working, which shifts need coverage, and which tasks are pending. It is designed for teams, operations leaders, and HR analytics professionals seeking efficient staff management.
How to Create a Staff Task Management Dashboard Dashboard
You don’t need to build your report from scratch—just start with a ready-to-use Staff task management dashboard template from Mokkup. Add in your data and export it however you like. Here’s how to do it:
1. Create or Log in to Your Mokkup Account
Start by signing up on Mokkup.ai using your email. If you already have an account, just log in, and you’ll be good to go.
2. Choose and Customize Your Dashboard Template
Find the Staff Task Management Dashboard template in the Templates section. Use the drag-and-drop editor to adjust KPIs, edit filters, or add elements based on your data.
3. Export to Your BI Tool
Once your dashboard wireframe is ready, use the BI Tool Export feature to send it directly to Power BI or Tableau for further analysis and enhancements. You can also download the dashboard as a PDF, PNG, or JPEG, embed it on a platform, or invite your team to collaborate.
Note: This is a Pro template. You’ll need a Pro subscription on Mokkup to use and customize this dashboard wireframe. Upgrade anytime to unlock full access.
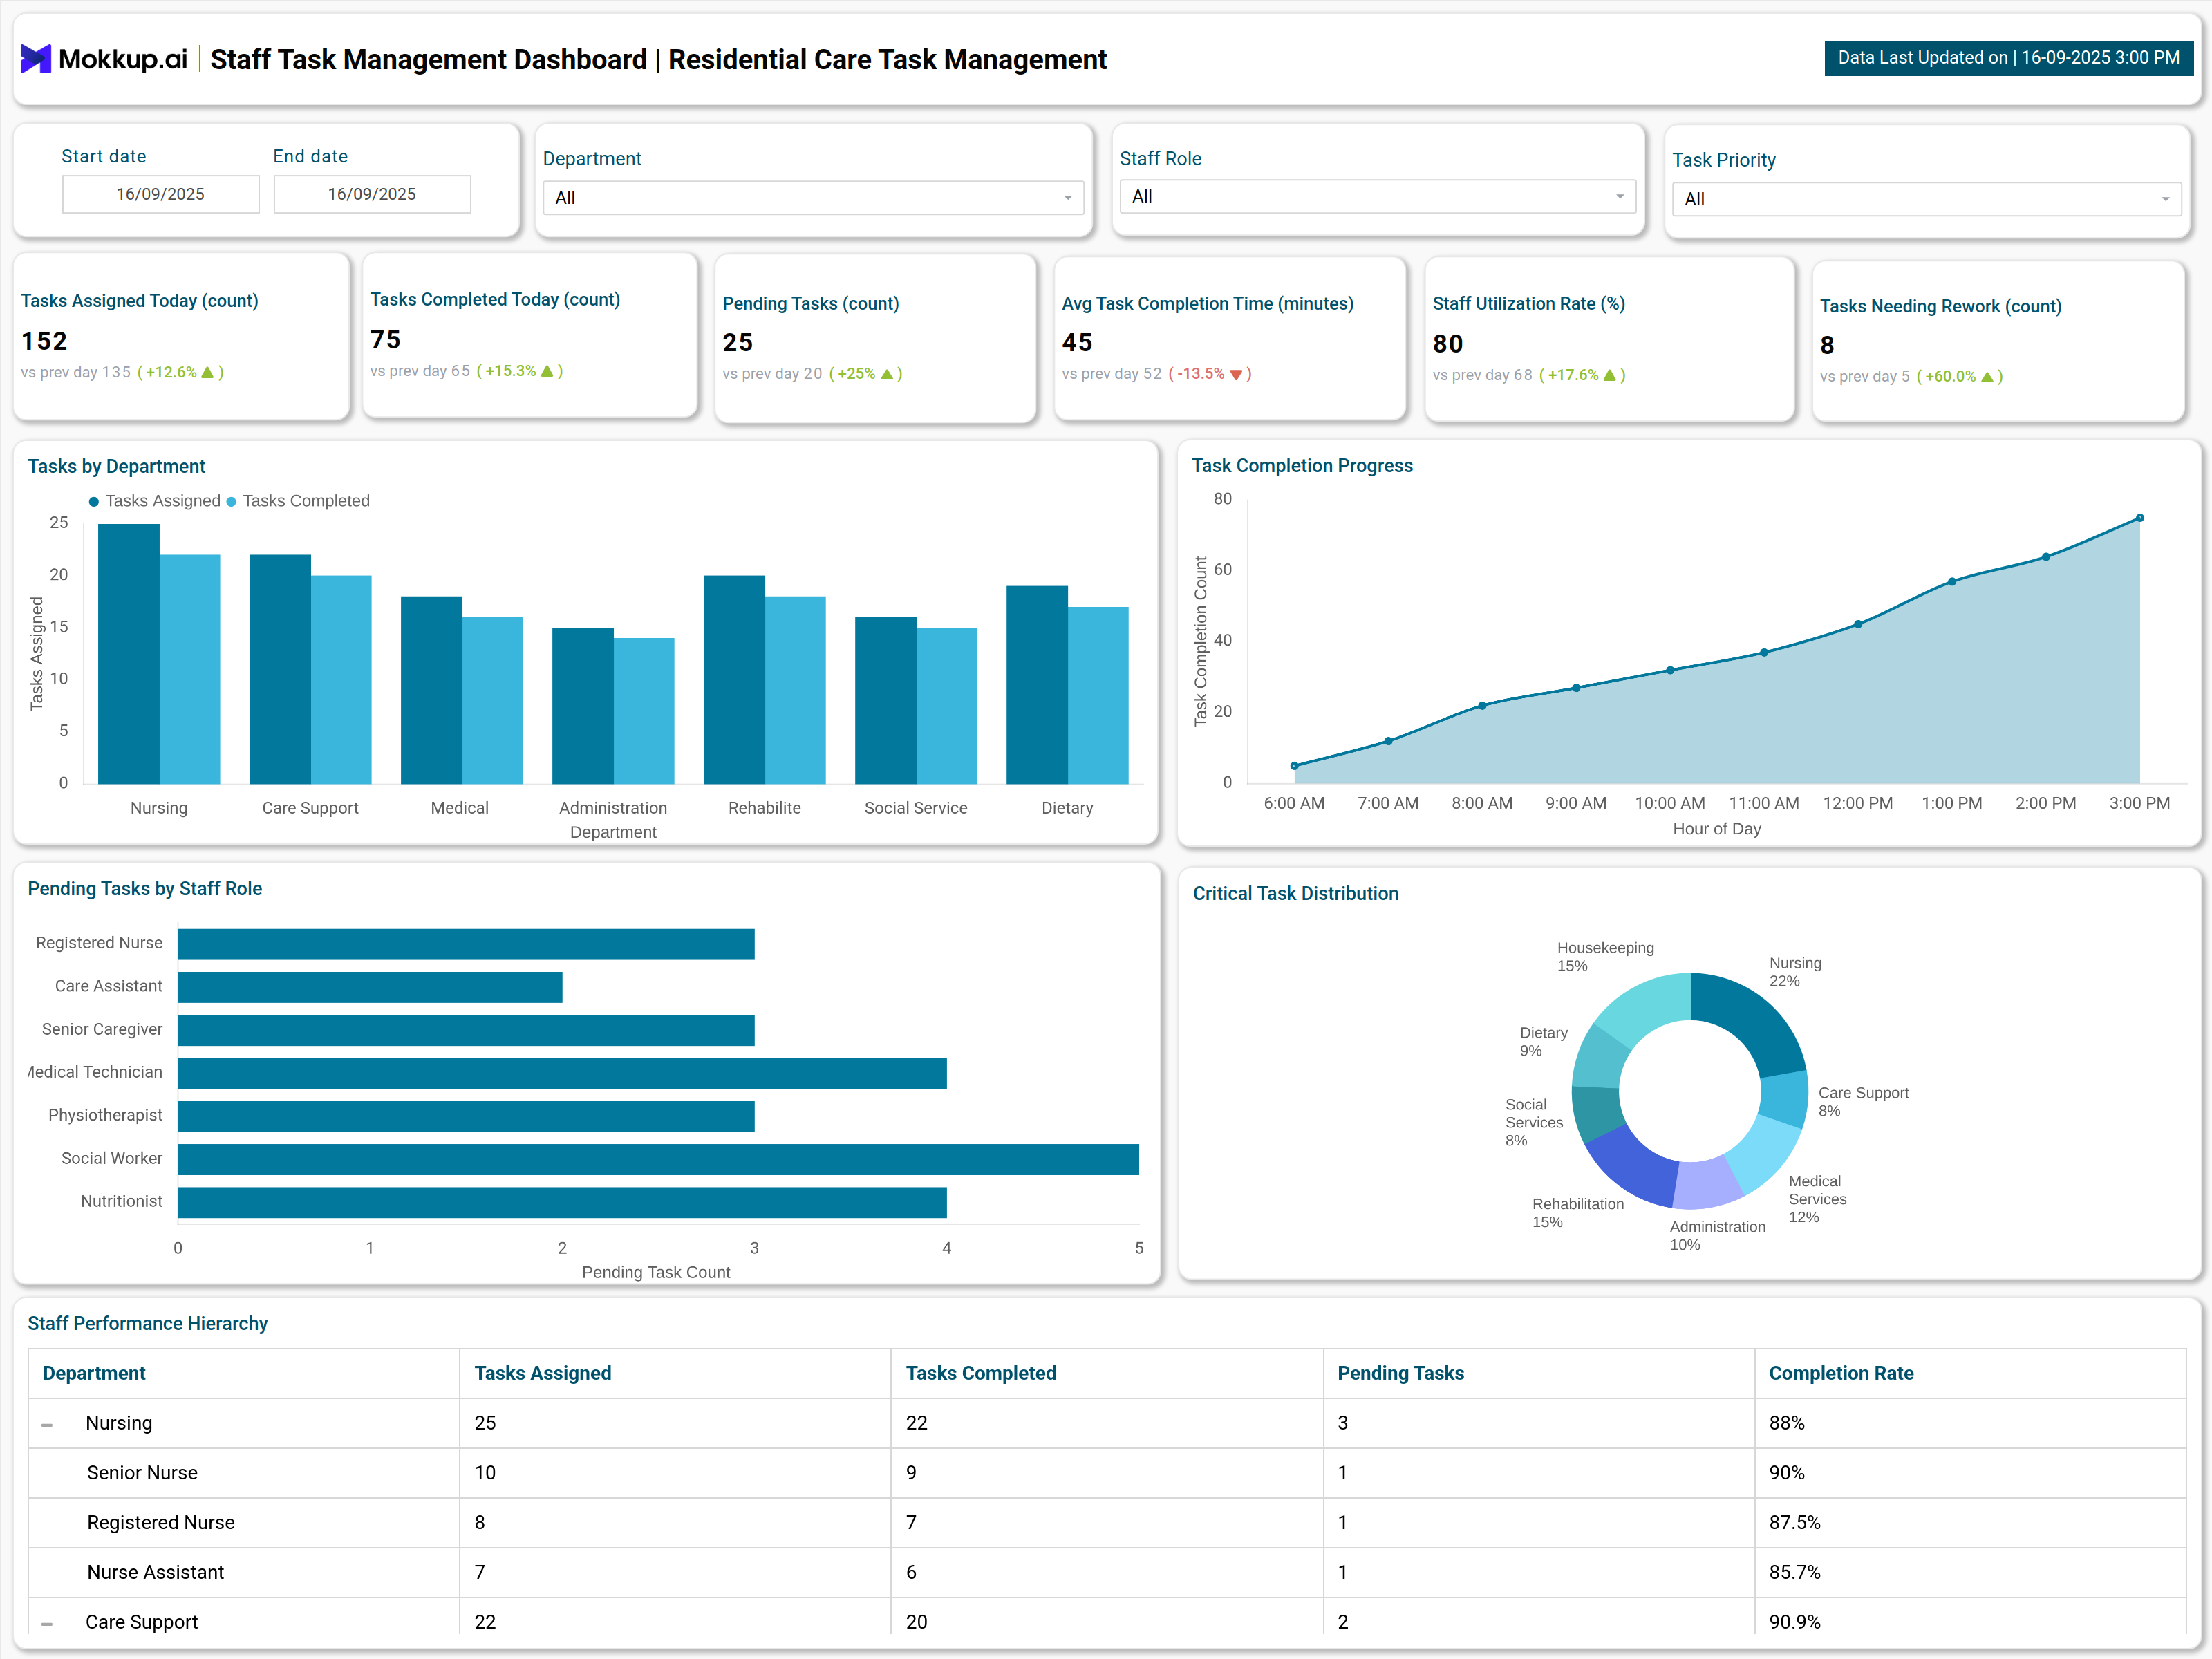
Staff Task Management Dashboard Example
Create your personalized Staff task management dashboard, bringing all of your metrics into one structured view. The Mokkup Staff task management dashboard example wireframes include visualizations such as task completion rate, staff coverage per shift, pending tasks, and more. Filters for date, department, task priority, and staff role allow users to tailor analysis to specific needs. Once the data is added, this dashboard can be exported to BI tools like Power BI or Tableau for deeper analysis, making it a practical solution for teams that need clarity, accountability, and quick insights to manage workloads effectively.
How to Analyze Data in Staff Task Management Dashboards
To effectively analyze a staff task management dashboard, follow these steps:
- Monitor task completion rates versus assignments by department and staff role to identify gaps in output or potential overwork.
- Review average completion times and comparing them with historical benchmarks to expose bottlenecks.
- Drill down into pending tasks by role/dept to redistribute work where needed.
- Utilize visualizations (e.g. bar charts for department performance, pie charts for critical task distribution) to pinpoint issues rapidly.
- Track daily or hourly completion progress to determine peak productivity windows.
- Assess staff utilization rates to balance workloads and improve overall efficiency.
By analyzing data this way, teams can improve task completion, optimize staff allocation, and ensure smoother day-to-day operations.
Benefits of Staff Task Management Dashboards
A real-time Task Management Dashboard provides several advantages for teams and organizations:
- Enhanced Visibility: Dashboards provide comprehensive, clear views of all active, completed, and pending tasks for greater operational transparency.
- Improved Collaboration: Centralized platforms facilitate real-time communication and updates among team members, reducing miscommunication and duplication of work.
- Productivity Boost: Automated tracking and sorting of tasks, workload indicators, and deadline reminders help teams focus and execute efficiently.
- Streamlined Operations: Grouping tasks by department or project allows for clearer prioritization and easier resource allocation.
- Accountability: Individual completion rates and departmental KPIs foster a sense of ownership, helping staff stay engaged and motivated
KPIs to Track in Staff Task Management Dashboards
Key Performance Indicators (KPIs) of the best staff management dashboard include:
- Task Completion Rate: The percentage of assigned tasks completed within a set period.
- Task Assigned Today: How much work has been distributed across the team for the day
- Average Task Completion Time: Tracks how long tasks take from assignment to completion.
- Staff Utilization Rate: Measures active work vs. available capacity.
- Pending Tasks: Total outstanding tasks by department/role.
- Tasks Needing Rework: Number of tasks requiring revision or correction.
By monitoring these KPIs, teams can boost productivity, balance workloads, and improve overall efficiency.
Frequently Asked Questions
1. What tools can a staff task management dashboard connect with?
They usually integrate with HR systems, payroll software, calendar tools, and project management platforms—bringing scheduling, tasks, and performance tracking into one place.
2. Who should use a staff task management dashboard?
Team leads, department heads, HR managers, and operations planners. Anyone responsible for assigning, tracking, or balancing staff tasks can benefit from the visibility it provides.
3. Which KPIs matter most in staff task management?
Key metrics include task completion rate, overdue tasks, staff workload distribution, coverage per shift, and time spent per task—these help track efficiency and spot gaps early.