What is a Software Application Administration and Monitoring Dashboard?
A software application administration and monitoring dashboard is a centralized control panel designed for tracking application usage, user adoption, and operational performance. It enables administrators to monitor system health, user activity, and project progress through visual data insights. This dashboard integrates real-time analytics and performance indicators, offering a complete picture of application operations across teams and platforms. With its ability to combine administrative control and performance tracking, it enables enterprises to maintain efficiency, enhance user engagement, and optimize workflows through data-driven insights.
How to Create a Software Application Administration and Monitoring Dashboard
You don’t need to build your report from scratch—just start with a ready-to-use dashboard template from Mokkup. Add in your data and export it however you like. Here’s how to do it:
1. Create or Log in to Your Mokkup Account
Start by signing up on Mokkup.ai using your email. If you already have an account, just log in, and you’ll be good to go.
2. Choose and Customize Your Dashboard Template
Find the Software Application Administration and Monitoring Dashboard template in the Templates section. Use the drag-and-drop editor to adjust KPIs, edit filters, or add elements based on your data.
3. Export to Your BI Tool
Once your dashboard wireframe is ready, use the BI Tool Export feature to send it directly to Power BI or Tableau for further analysis and enhancements. You can also download the dashboard as a PDF, PNG, or JPEG, embed it on a platform, or invite your team to collaborate.
Note: This is a Pro template. You’ll need a Pro subscription on Mokkup to use and customize this dashboard wireframe. Upgrade anytime to unlock full access.
Software Application Administration and Monitoring Dashboard Example
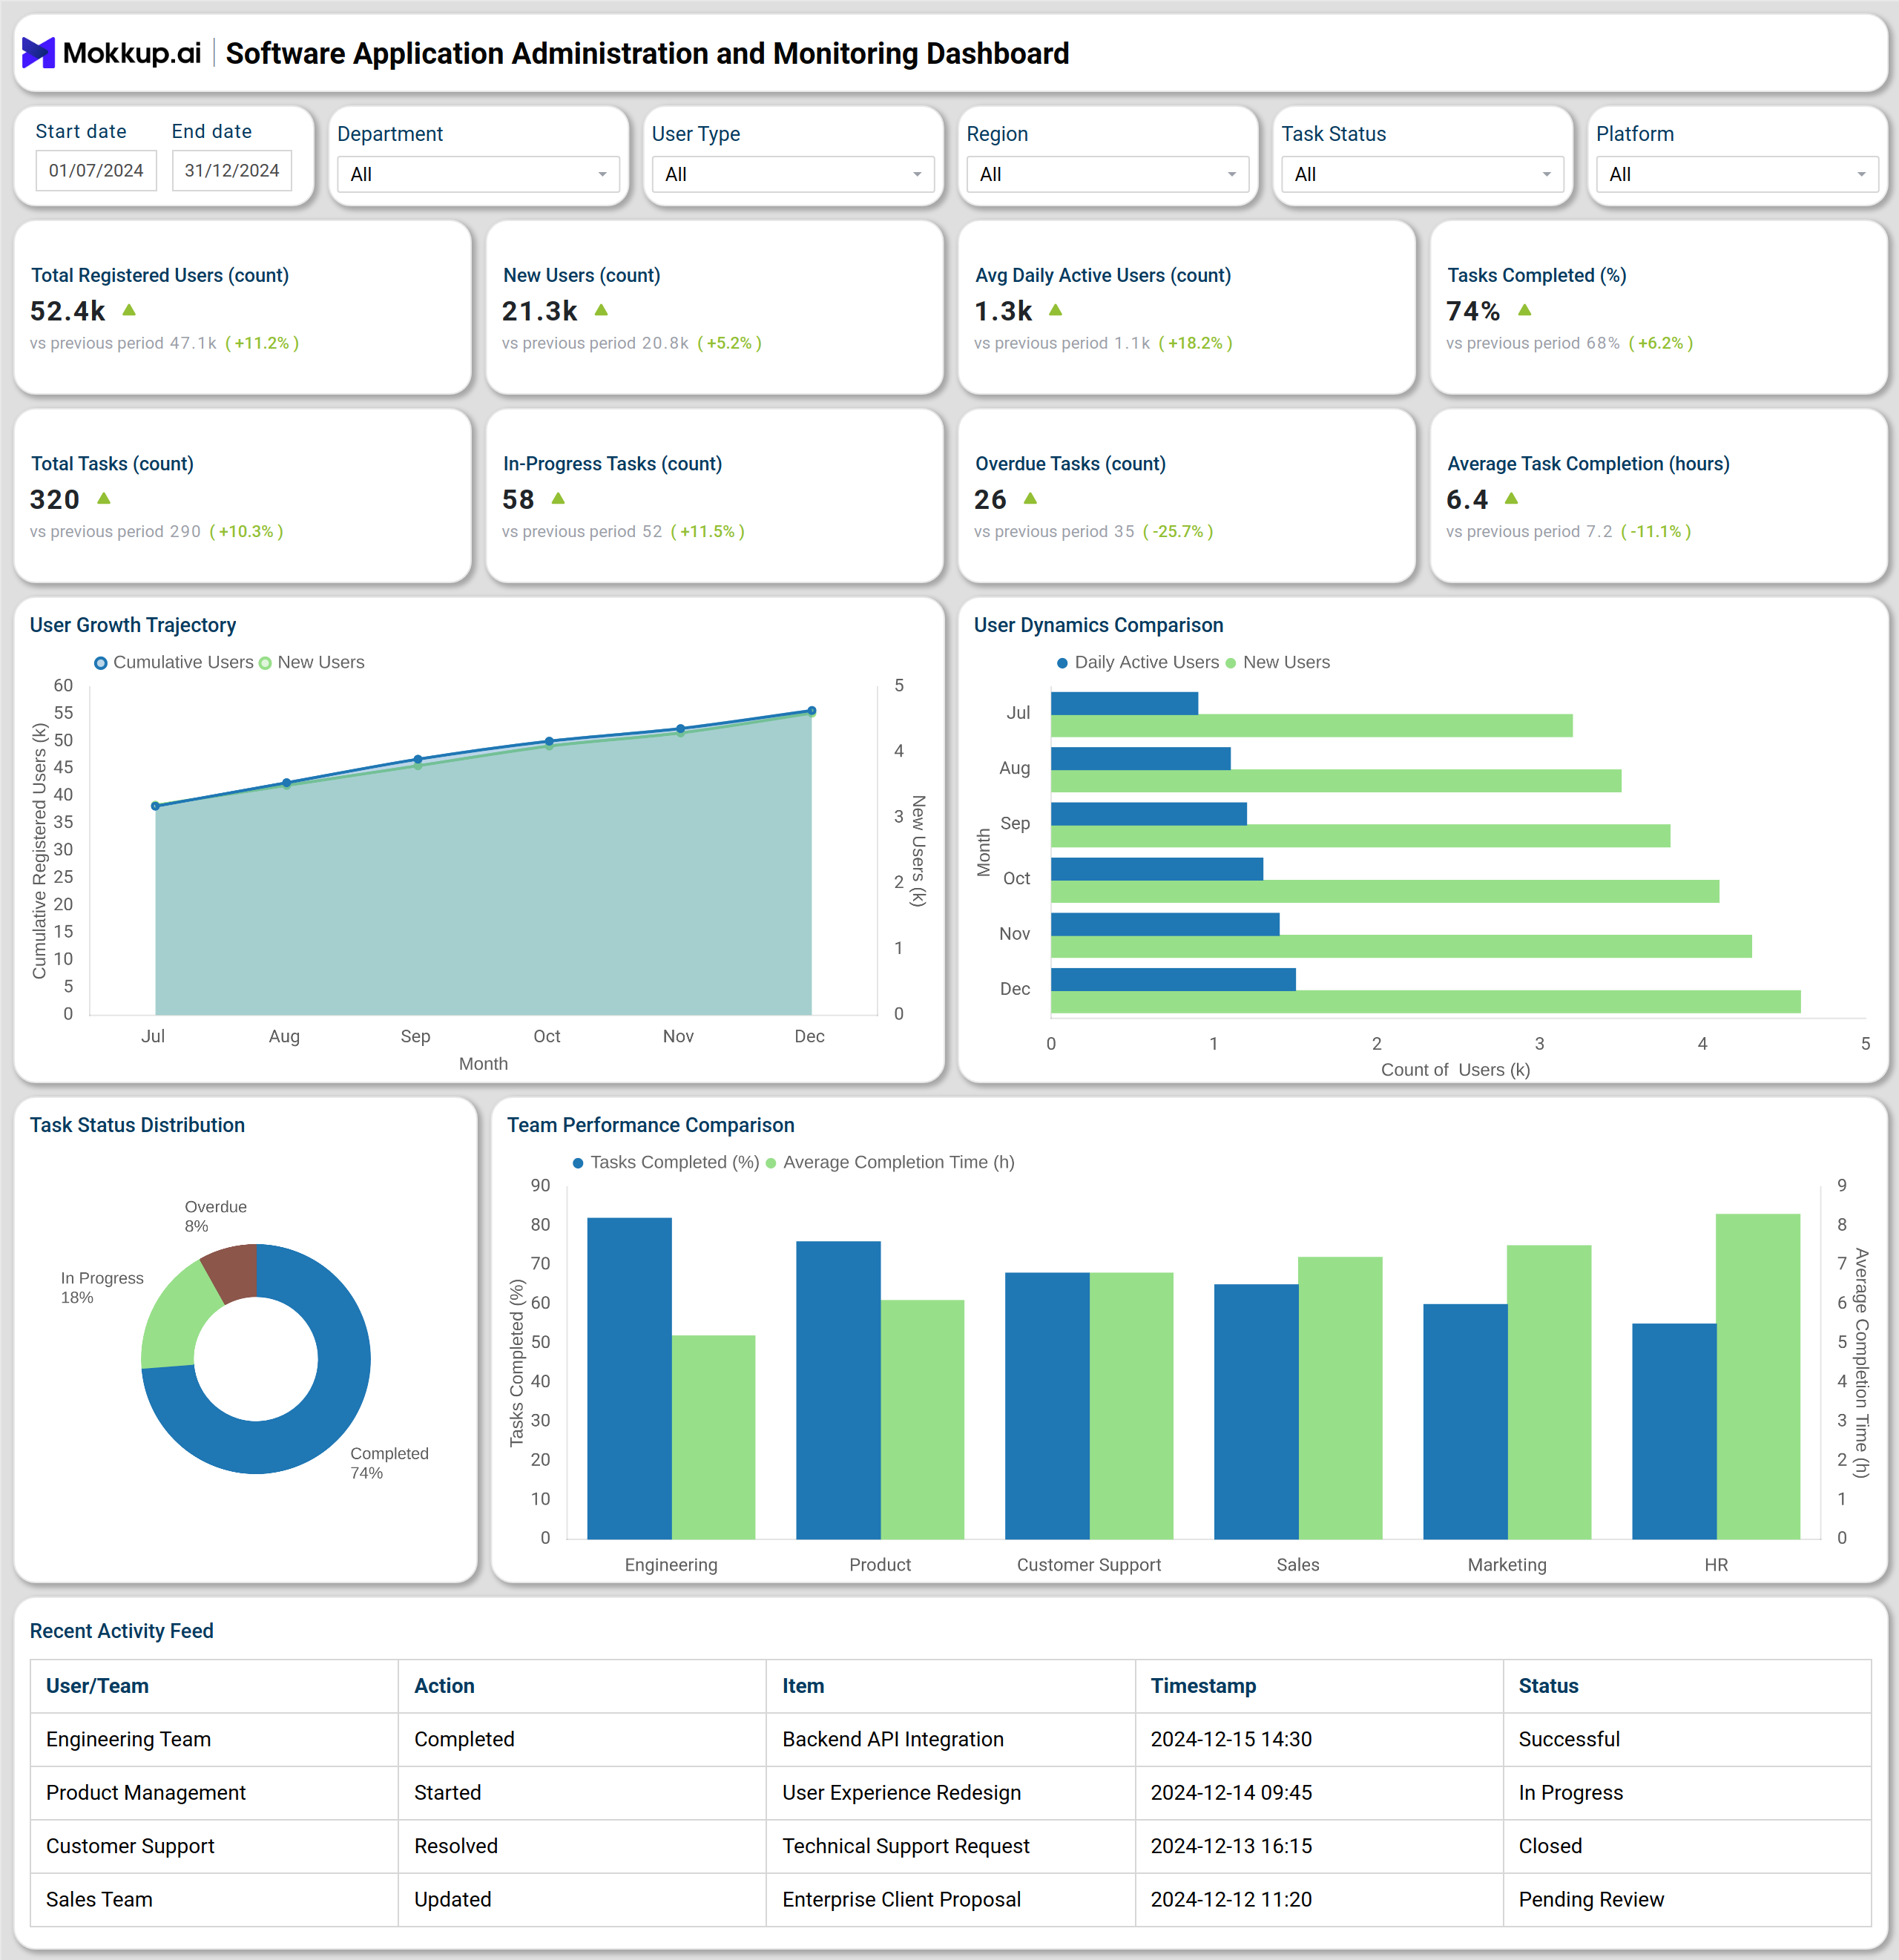
The enterprise application administration dashboard tool shown above provides a clear view of both user and operational performance. The top section of the dashboard summarizes essential KPIs, including total registered users, daily active users, total tasks, and task completion rates. These metrics help administrators understand adoption levels, engagement activity, and work progress at a glance. The visual charts, such as User Growth Trend and New vs. Active Users illustrate adoption and engagement trajectories over time, while Work Status Distribution highlights operational workload balance.
The Team Performance Comparison identifies top-performing departments and highlights areas that require improvement. The Recent Activity Feed provides a real-time audit of user and team actions, ensuring transparency and accountability. Together, these insights make the dashboard a comprehensive software operations and admin monitoring platform, built to streamline user management, task tracking, and system monitoring for informed decision-making.
How to Analyze Data in Software Application Administration and Monitoring Dashboard
Here is how you can analyze data from this application usage and administration analytics dashboard:
- Track user adoption: Review cumulative and new user counts to monitor the platform's effectiveness in attracting and retaining users.
- Assess engagement trends: Compare daily and monthly active users to measure platform activity levels.
- Evaluate operational efficiency: Analyze completed, in-progress, and overdue task counts to understand workload balance.
- Compare team performance: Use department-based metrics to identify high-performing and underperforming teams.
- Monitor real-time activity: Review the activity feed to track updates, completions, and administrative actions.
- Leverage platform filters: Narrow down insights by department, user role, or time period to refine analysis.
Benefits of Software Application Administration and Monitoring Dashboard
- Unified operational visibility: Offers a single view of users, tasks, and performance data across teams.
- Real-time decision-making: Enables faster administrative actions with live data insights.
- Enhanced productivity: Helps identify performance gaps and improve workflow efficiency.
- Data transparency: Provides a clear audit trail through real-time activity monitoring.
- Scalable platform management: Supports multiple departments, user types, and platforms in one dashboard.
- Reduced downtime: Early detection of performance or engagement drops through active monitoring.
- Improved collaboration: Encourages inter-departmental efficiency through shared visibility of performance metrics.
KPIs to Track in Software Application Administration and Monitoring Dashboard
- Total Registered Users: Measures overall platform adoption.
- New Users (Monthly): Tracks user acquisition and onboarding performance.
- Daily Active Users (DAU): Evaluates active engagement across time periods.
- Total Tasks/Projects: Monitors work volume and project pipeline.
- Tasks Completed (%): Reflects team performance and efficiency levels.
- Average Task Completion Time: Measures productivity and response efficiency.
- Overdue Tasks: Identifies operations that are delayed and require attention.
- Team Performance: Compares performance across departments to optimize workload distribution.
- Recent Activity Feed: Tracks real-time administrative and user actions for accountability.
Frequently Asked Questions
1. What is the purpose of a software application administration and monitoring dashboard?
It helps organizations monitor user adoption, track operational progress, and analyze overall application performance through centralized data visualization.
2. How does this dashboard help administrators?
It provides a unified view of application health, user activity, and departmental performance, making it an essential application performance monitoring and administration dashboard.
3. What types of teams can use it?
Departments such as product management, engineering, marketing, and support teams can utilize the software operations and admin monitoring dashboard platform to track their performance and workload.
4. How does this dashboard improve efficiency?
By consolidating user data and operational metrics, the dashboard facilitates rapid performance evaluations and informed administrative decisions.