The Server Load Management Dashboard template provides IT and operations teams in the gaming industry with detailed insights into server performance, player activity, and cost analysis. Spread across two screens, this dashboard helps optimize server uptime, manage costs, and monitor key performance trends to enhance the gaming experience.
Server Performance and Player Activity
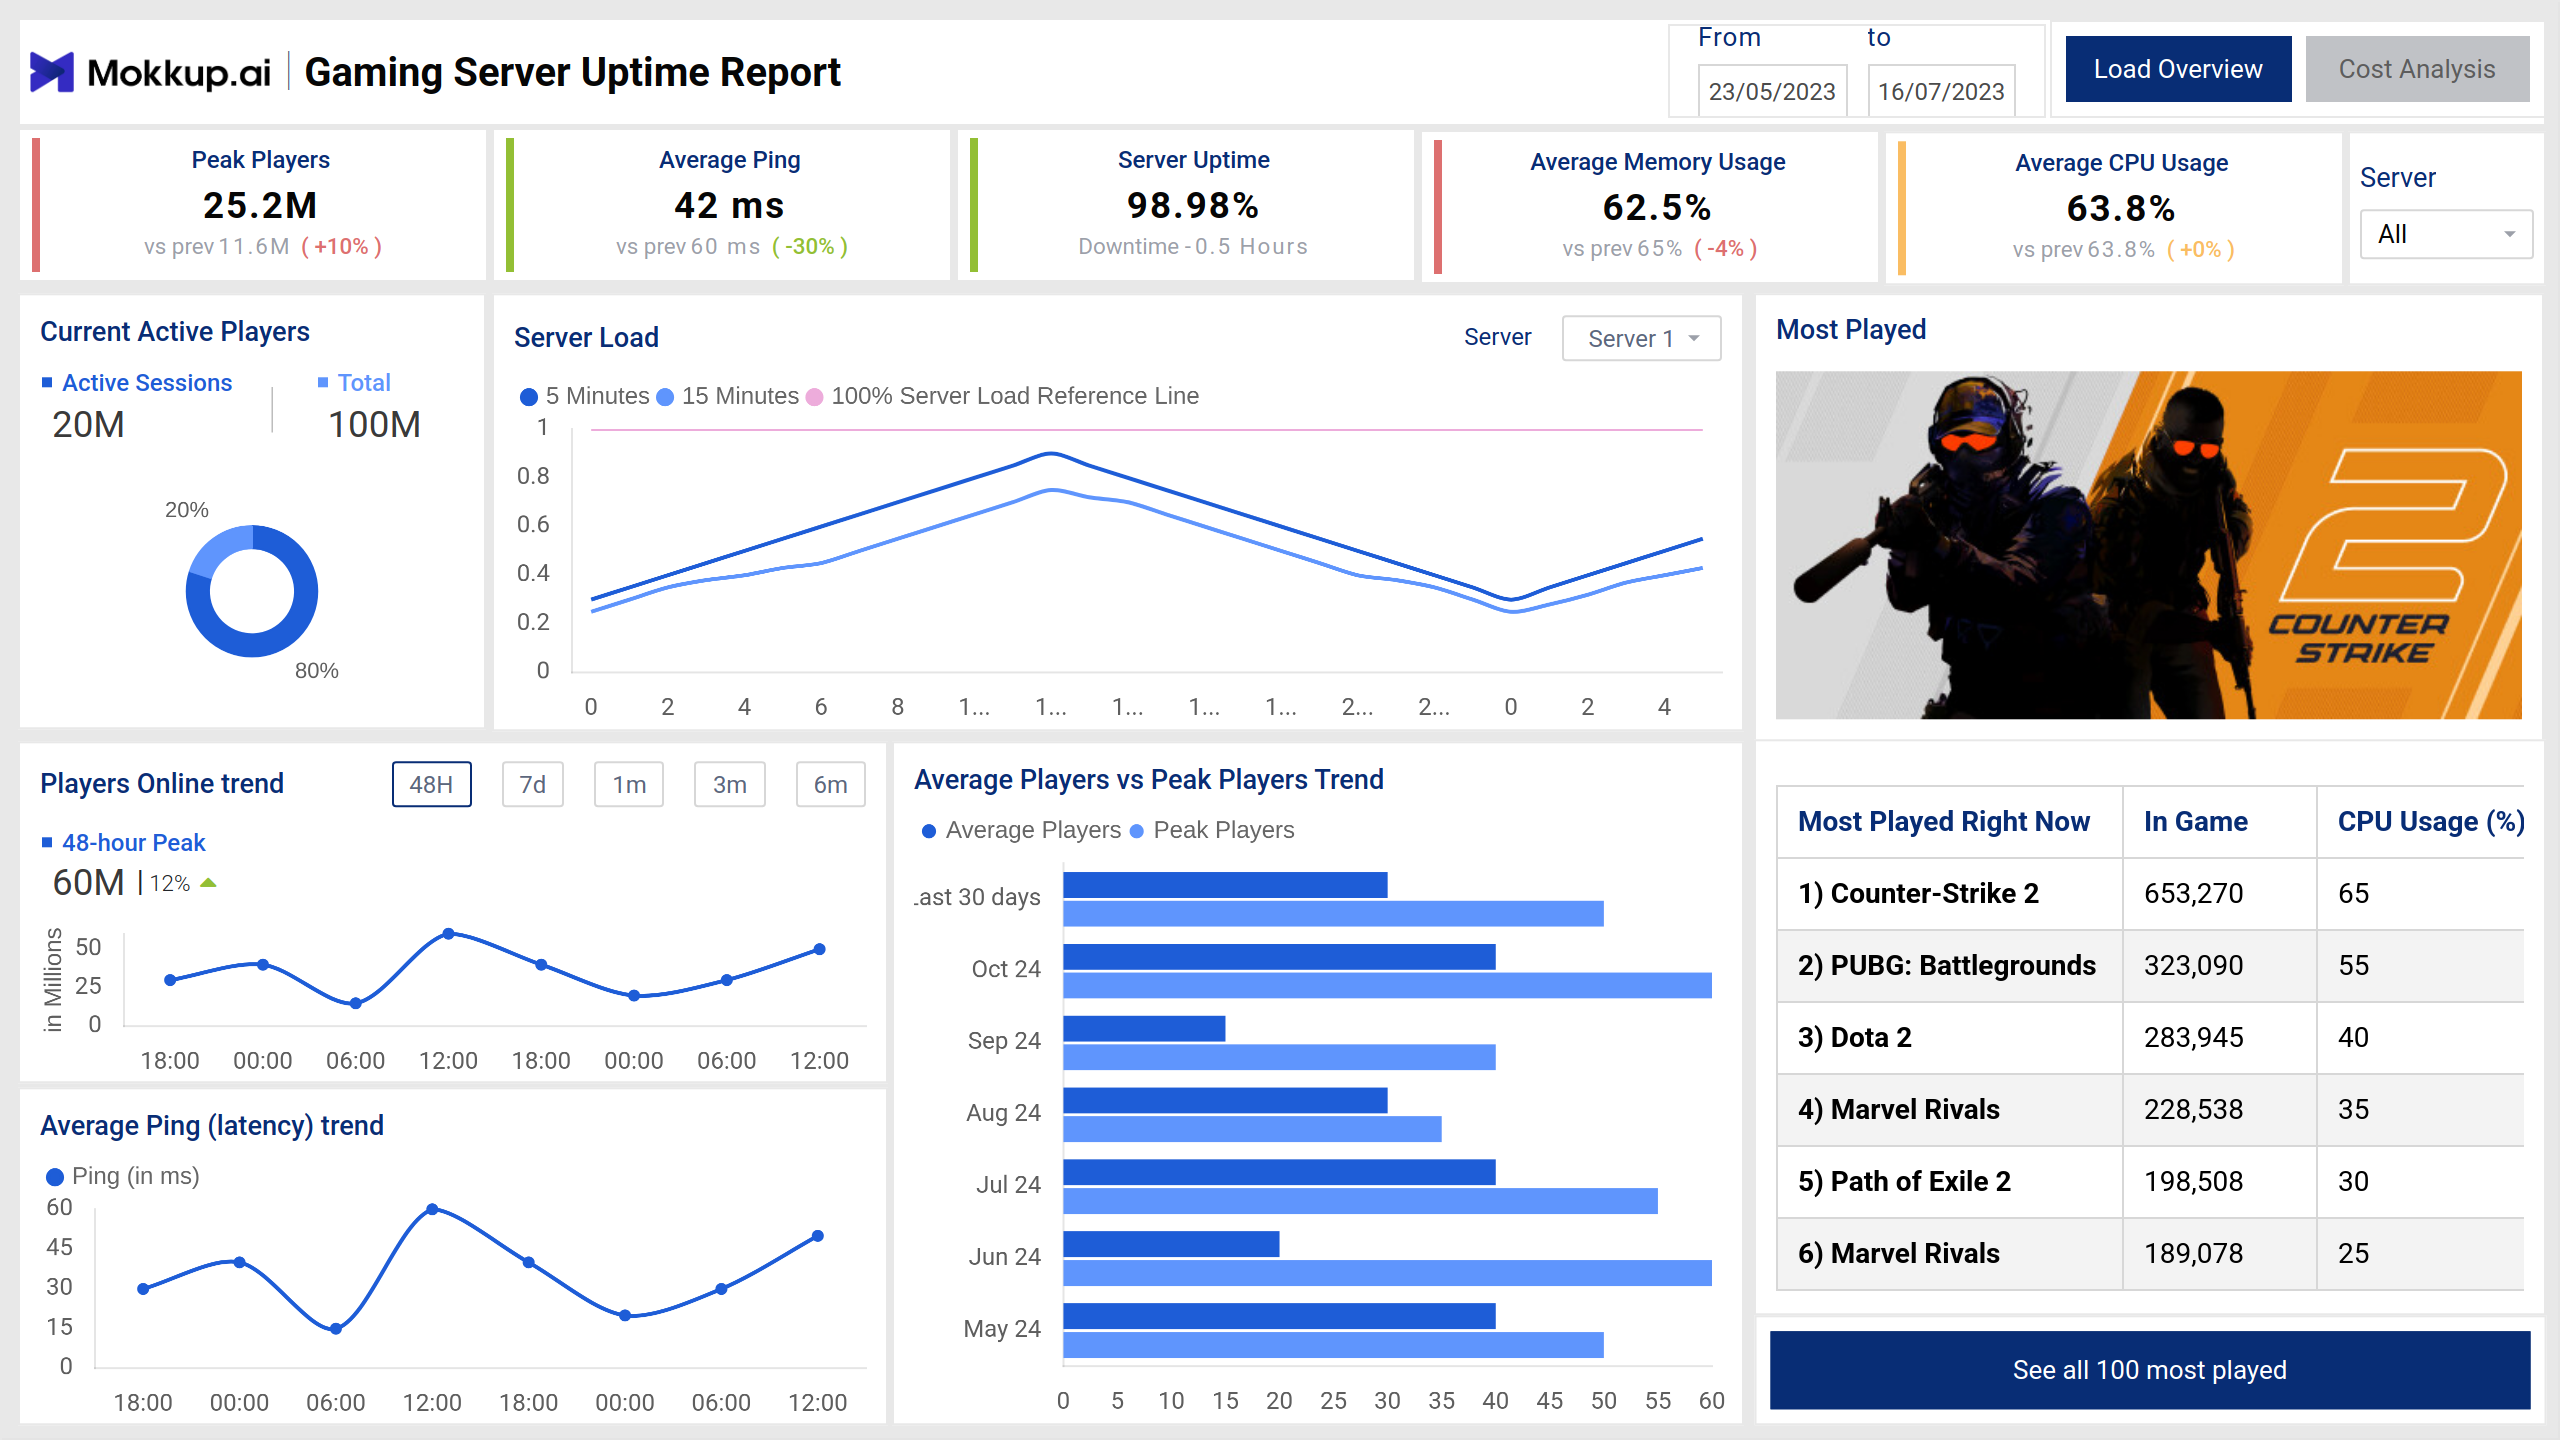
This screen focuses on server uptime, load, and player activity, enabling proactive monitoring of server health and usage patterns. It highlights fluctuations in engagement, system efficiency, and response times, helping users monitor overall trends. The insights help in optimizing performance and ensuring a seamless experience across different usage periods.
Key Terms to Know
- Peak Players: Maximum number of concurrent players during the selected period.
- Average Ping: Average latency (in milliseconds) experienced by players.
- Server Uptime: Percentage of time the server remained operational.
- Average Monthly Usage: Average utilization percentage for the month.
- Average CPU Usage: Average server CPU usage during the selected period.
- Current Active Players: The number of online players is displayed as part of total capacity.
- Server Load: Identifies peak utilization hours and possible overloads.
- Players Online Trend: Helps assess player activity trends over different timeframes.
- Average Ping: Tracks spikes in latency that may affect gameplay.
- Average Players vs Peak Players Trend: Compares average player count with peak players.
- Most Played Games: Displays the top 6 most played games.
Cost and Performance Analysis
This screen provides insights into server costs, usage efficiency, and regional breakdowns to support cost optimization strategies. It highlights spending patterns, resource consumption, and correlations between activity levels and expenditures. The visual breakdown helps in identifying cost drivers and optimizing performance while maintaining stability across various locations.
Key Terms to Know
- Total Server Cost: Overall expenditure for server infrastructure.
- Average Cost per Player: Cost incurred per active player.
- Estimated Server Cost: Projected costs based on usage patterns.
- Server Cost Trend: Tracks actual vs. estimated server costs over time.
- Server Usage by Region: Visualizes server usage and costs across regions.
- Cost Distribution by Servers: Identifies servers with the highest and lowest cost impact.
- Server Cost and Player Load: Demonstrates a strong positive correlation, helping identify cost-efficient servers.
- Server-Related Performance Metrics: Summarizes server-related metrics for detailed analysis.
Dashboard Template Insights
Here are the key insights the dashboard wireframe provides:
- Displays workload distribution across servers, helping prevent overutilization and downtime.
- Tracks resource consumption trends to identify peak usage periods and optimize performance.
- Provides insights into system health, making it easier to detect and resolve bottlenecks.
- Helps in balancing workloads efficiently by analyzing usage patterns and capacity limits.
Conclusion
This dashboard wireframe is a comprehensive tool for monitoring server performance, managing costs, and ensuring optimal gaming experiences. With real-time insights into server load, player activity, and cost analysis, IT and operations teams can proactively optimize resources, reduce latency, and enhance uptime reliability.