- Centralized Workforce Visibility: Provides a single view of staffing, productivity, and cost metrics during the holiday rush.
- Peak Season Workforce Planning: Supports data-driven hiring and scheduling to handle demand surges efficiently.
- Operational Efficiency Improvement: Optimizes productivity and customer-to-staff ratios for smoother operations.
- Seasonal Cost Optimization: Helps control labor costs by analyzing overtime, incentives, and temporary staffing spend.
- Workforce Agility Enablement: Allows quick schedule adjustments by tracking coverage gaps and absenteeism in real time.
- Integrated Labor Performance Tracking: Combines coverage, productivity, composition, and cost KPIs in one dashboard.
- Reduced Manual HR Reporting: Automates attendance, scheduling, and payroll tracking to save time and effort.
- Consistent Service Quality: Ensures optimal staffing levels across locations and shifts to maintain customer experience.
What is a Santa's Workforce & Elf Shift Management Dashboard?
A Santa's Workforce & Elf Shift Management Dashboard template is a specialized human resources and operations tool designed to monitor and optimize staffing levels, productivity, and costs during the high-demand Christmas season. It consolidates key metrics such as shift coverage, absenteeism, workforce productivity, and labor cost breakdown into a single visual platform.
By integrating peak season workforce planning, holiday staff productivity tracking, and seasonal labor cost optimization, the dashboard empowers HR and operations managers to ensure adequate coverage, manage seasonal staff, and maintain service quality. The dashboard wireframe acts as a central hub for analyzing workforce composition, tracking daily shift trends, and balancing customer-to-staff ratios across locations.
How to Create a Santa's Workforce & Elf Shift Management Dashboard
You don’t need to build your report from scratch—just start with a ready-to-use Santa's Workforce & Elf Shift Management dashboard template from Mokkup. Add in your data and export it however you like. Here’s how to do it:
1. Create or Log in to Your Mokkup Account
Start by signing up on Mokkup.ai using your email. If you already have an account, just log in, and you’ll be good to go.
2. Choose and Customize Your Dashboard Template
Find the Santa's Workforce & Elf Shift Management Dashboard template in the Templates section. Use the drag-and-drop editor to adjust KPIs, edit filters, or add elements based on your data.
3. Export to Your BI Tool
Once your dashboard wireframe is ready, use the BI Tool Export feature to send it directly to Power BI or Tableau for further analysis and enhancements. You can also download the dashboard as a PDF, PNG, or JPEG, embed it on a platform, or invite your team to collaborate.
Note: This is a Pro template. You’ll need a Pro subscription on Mokkup to use and customize this dashboard wireframe. Upgrade anytime to unlock full access.
Santa's Workforce & Elf Shift Management Dashboard Example
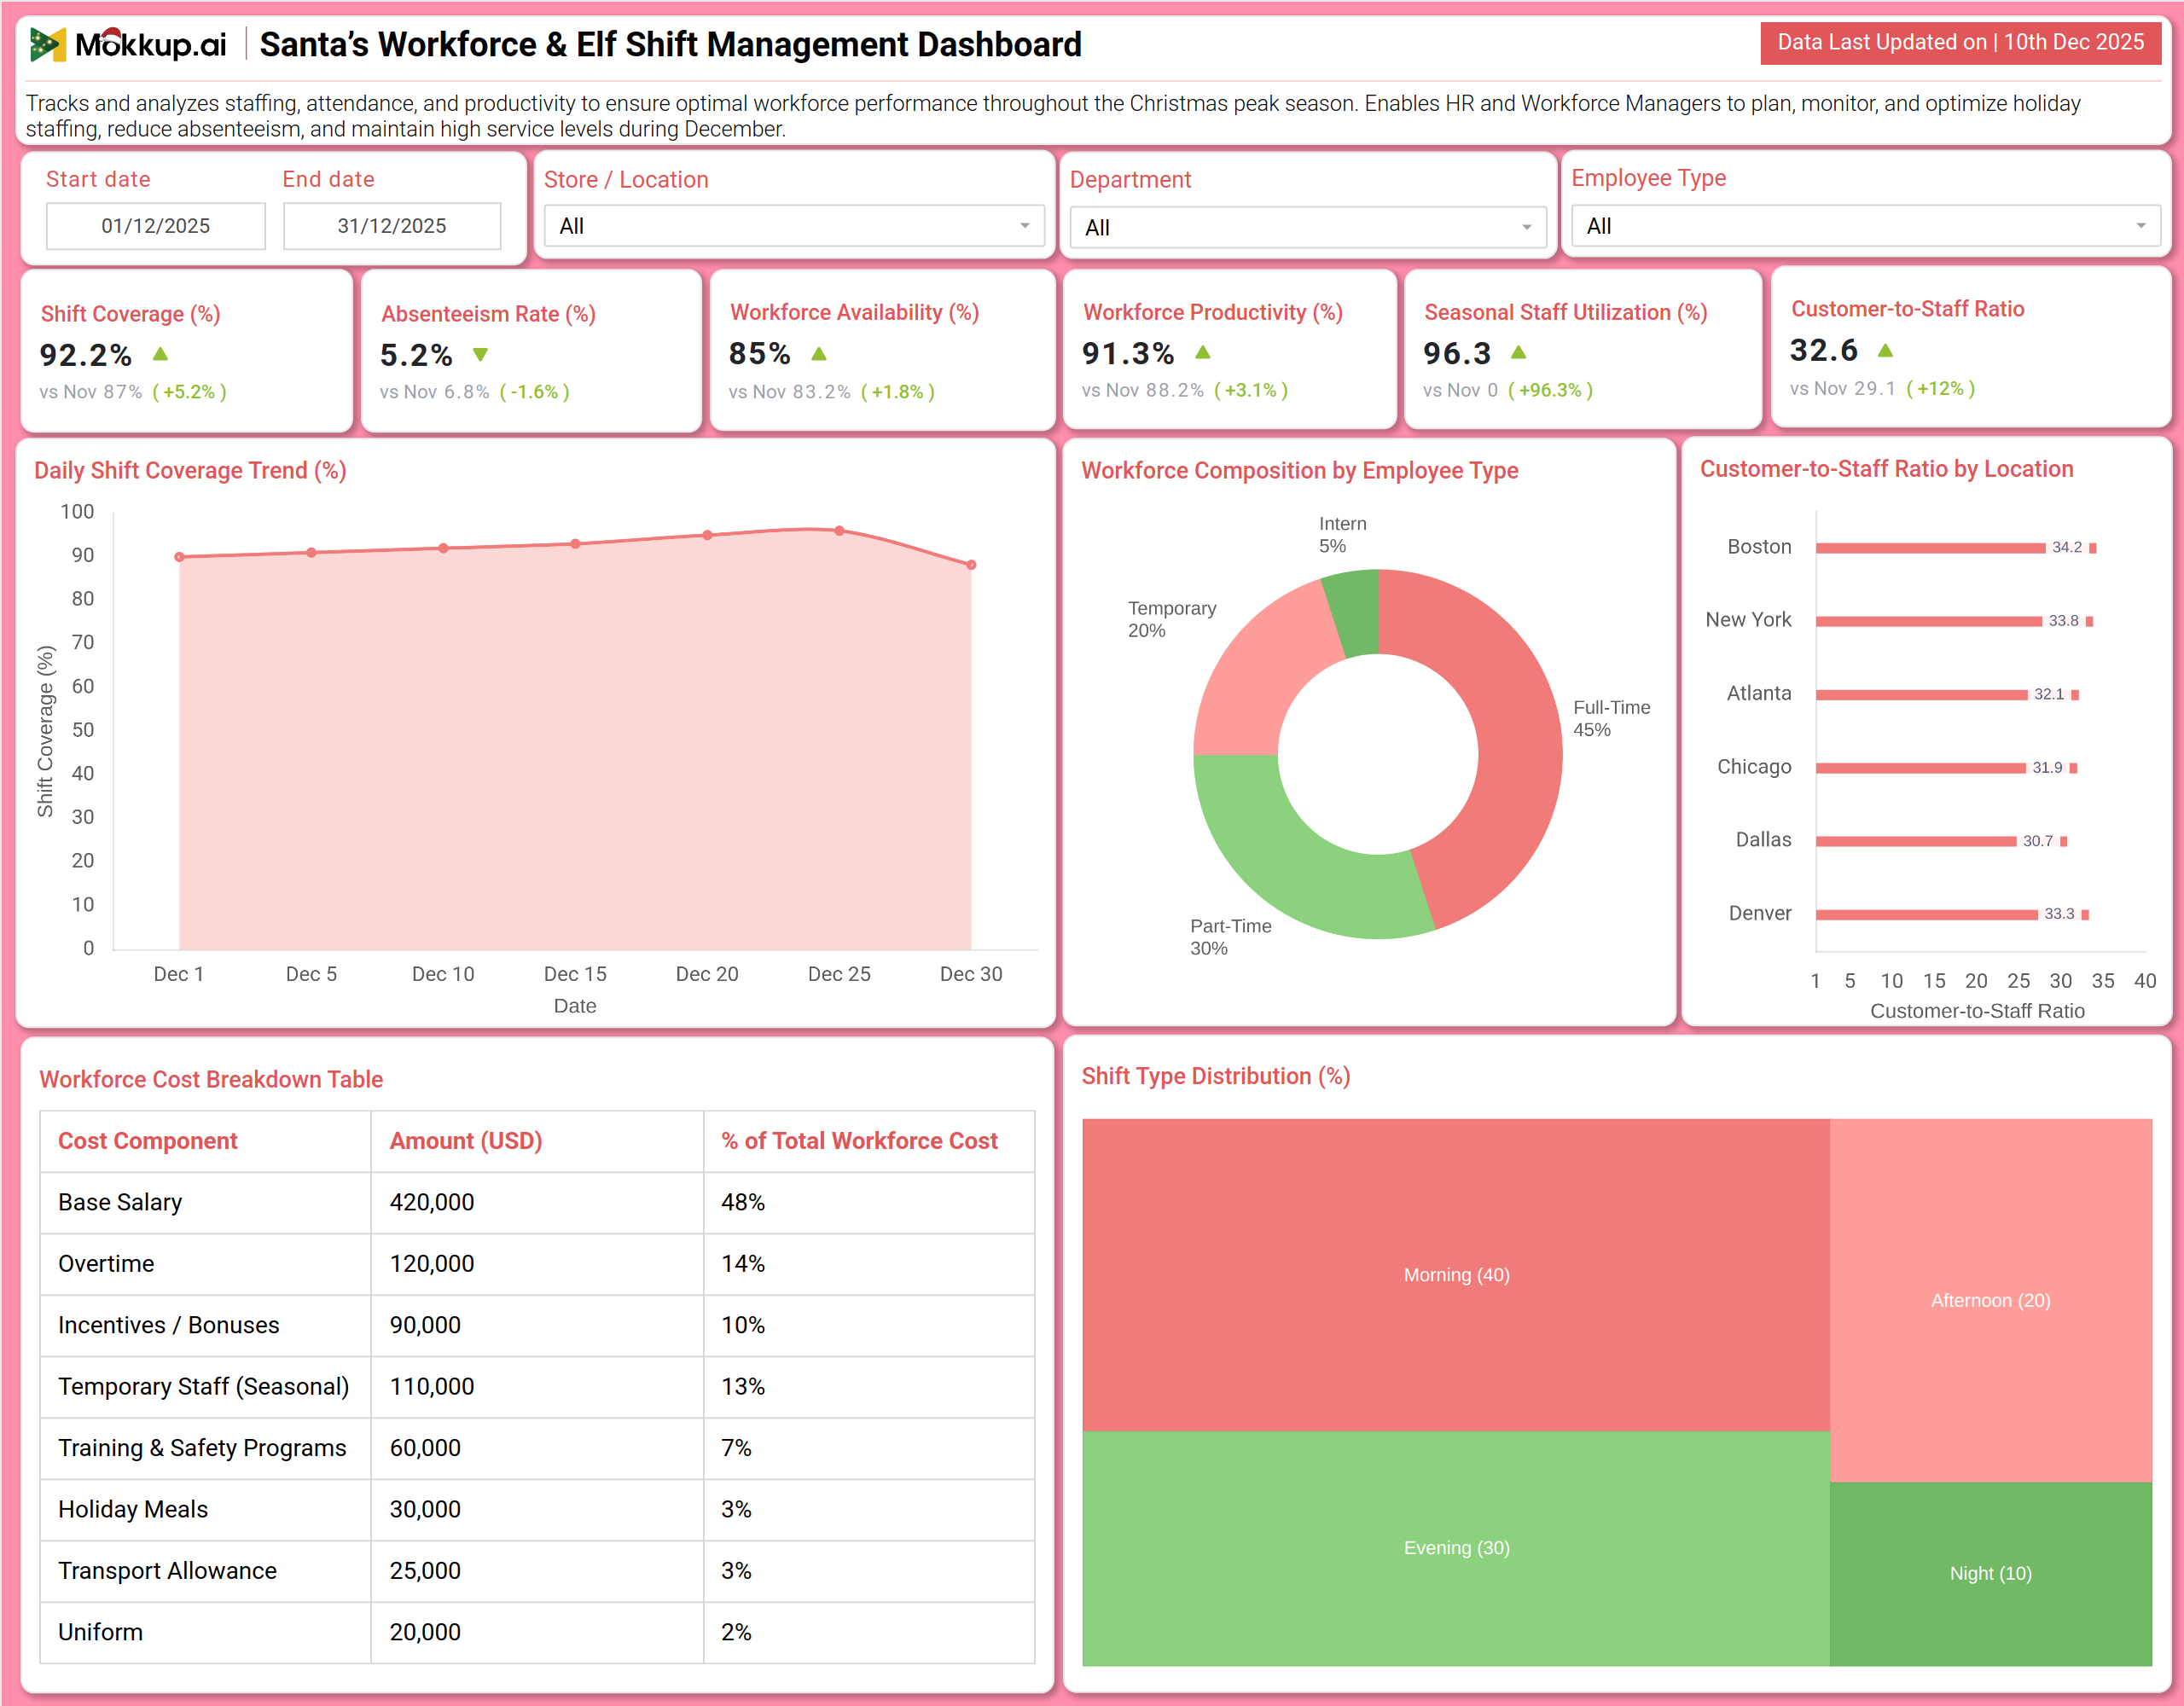
You can create a Santa's Workforce & Elf Shift Management Dashboard that brings together staffing efficiency, cost management, and workforce analytics into a unified view. A typical dashboard includes a Staffing Overview section, where users can track Shift Coverage, Absenteeism Rate, and Workforce Productivity. Visual charts like the Daily Shift Coverage Trend and Customer-to-Staff Ratio by Location reveal operational pressure points and coverage gaps. The Cost & Composition Analysis section builds on this by displaying a detailed Total Workforce Cost breakdown, Workforce Composition by Employee Type, and Shift Type Distribution. Together, these modules deliver crucial holiday labor management KPIs, enabling managers to align staffing with demand, control overtime expenses, and ensure a balanced mix of full-time, part-time, and seasonal workers.
How to Analyze Data in Santa's Workforce & Elf Shift Management Dashboard
Here is how you can analyze data from this dashboard:
- Shift Coverage Monitoring: Review coverage metrics to ensure all planned shifts are fully staffed to meet holiday operational demand.
- Absenteeism Trend Analysis: Track absenteeism rates to spot patterns that may disrupt schedules and require backup planning.
- Workforce Availability Assessment: Analyze the percentage of staff available and scheduled to understand true operational capacity.
- Workforce Productivity Review: Measure output versus expected performance to identify efficiency gaps during peak periods.
- Seasonal Staff Utilization Tracking: Evaluate how effectively temporary holiday staff are being deployed alongside core teams.
- Customer-to-Staff Ratio Analysis: Balance service quality and workload by comparing customer volume with staff availability.
- Daily Shift Coverage Trend: Study day-wise coverage trends to anticipate staffing needs based on demand fluctuations.
- Workforce Composition Breakdown: Review the mix of full-time, part-time, and seasonal staff for better workforce planning.
- Total Workforce Cost Analysis: Examine cost components like salaries, overtime, and seasonal labor to control budgets.
- Shift Type Distribution Review: Ensure optimal scheduling across morning, afternoon, evening, and night shifts to match traffic patterns.
Benefits of Santa's Workforce & Elf Shift Management Dashboard
The following are the benefits of using this dashboard:
KPIs to Track in Santa's Workforce & Elf Shift Management Dashboard
The following key KPIs can be tracked by using this dashboard:
- Shift Coverage (%): The percentage of scheduled shifts that are filled by available staff.
- Absenteeism Rate (%): The percentage of scheduled staff who are absent without prior arrangement.
- Workforce Availability (%): The percentage of total workforce that is scheduled and ready to work.
- Workforce Productivity (%): A measure of employee output efficiency against established benchmarks.
- Seasonal Staff Utilization (%): The proportion of total labor hours contributed by temporary or seasonal employees.
- Customer-to-Staff Ratio: The average number of customers per available staff member at a given time.
- Total Workforce Cost (USD): The sum of all labor-related expenses, including salaries, overtime, bonuses, and benefits.
- Overtime Cost (% of Total): The percentage of total workforce cost attributable to overtime pay.
Frequently Asked Questions
Q1. What is the purpose of this workforce dashboard?
It helps HR managers, operations directors, and store managers plan, monitor, and optimize their staffing strategy during the Christmas peak to ensure adequate coverage, control labor costs, and maintain high productivity and service levels.
Q2. Can the dashboard predict staffing shortages?
Yes. By tracking the Daily Shift Coverage Trend and Workforce Availability, it can highlight days or locations at risk of being understaffed.
Q3. How does the dashboard help control labor costs?
The detailed Total Workforce Cost breakdown highlights spending on overtime, seasonal staff, and incentives, allowing managers to identify and address budget overruns.
Q4. Does it show if we have the right mix of employee types?
Yes. The Workforce Composition by Employee Type chart clearly shows the balance between full-time, part-time, and temporary staff.
Q5. Who uses this dashboard?
HR Directors, Workforce Managers, Store Operations Managers, Shift Supervisors, and Financial Controllers.