
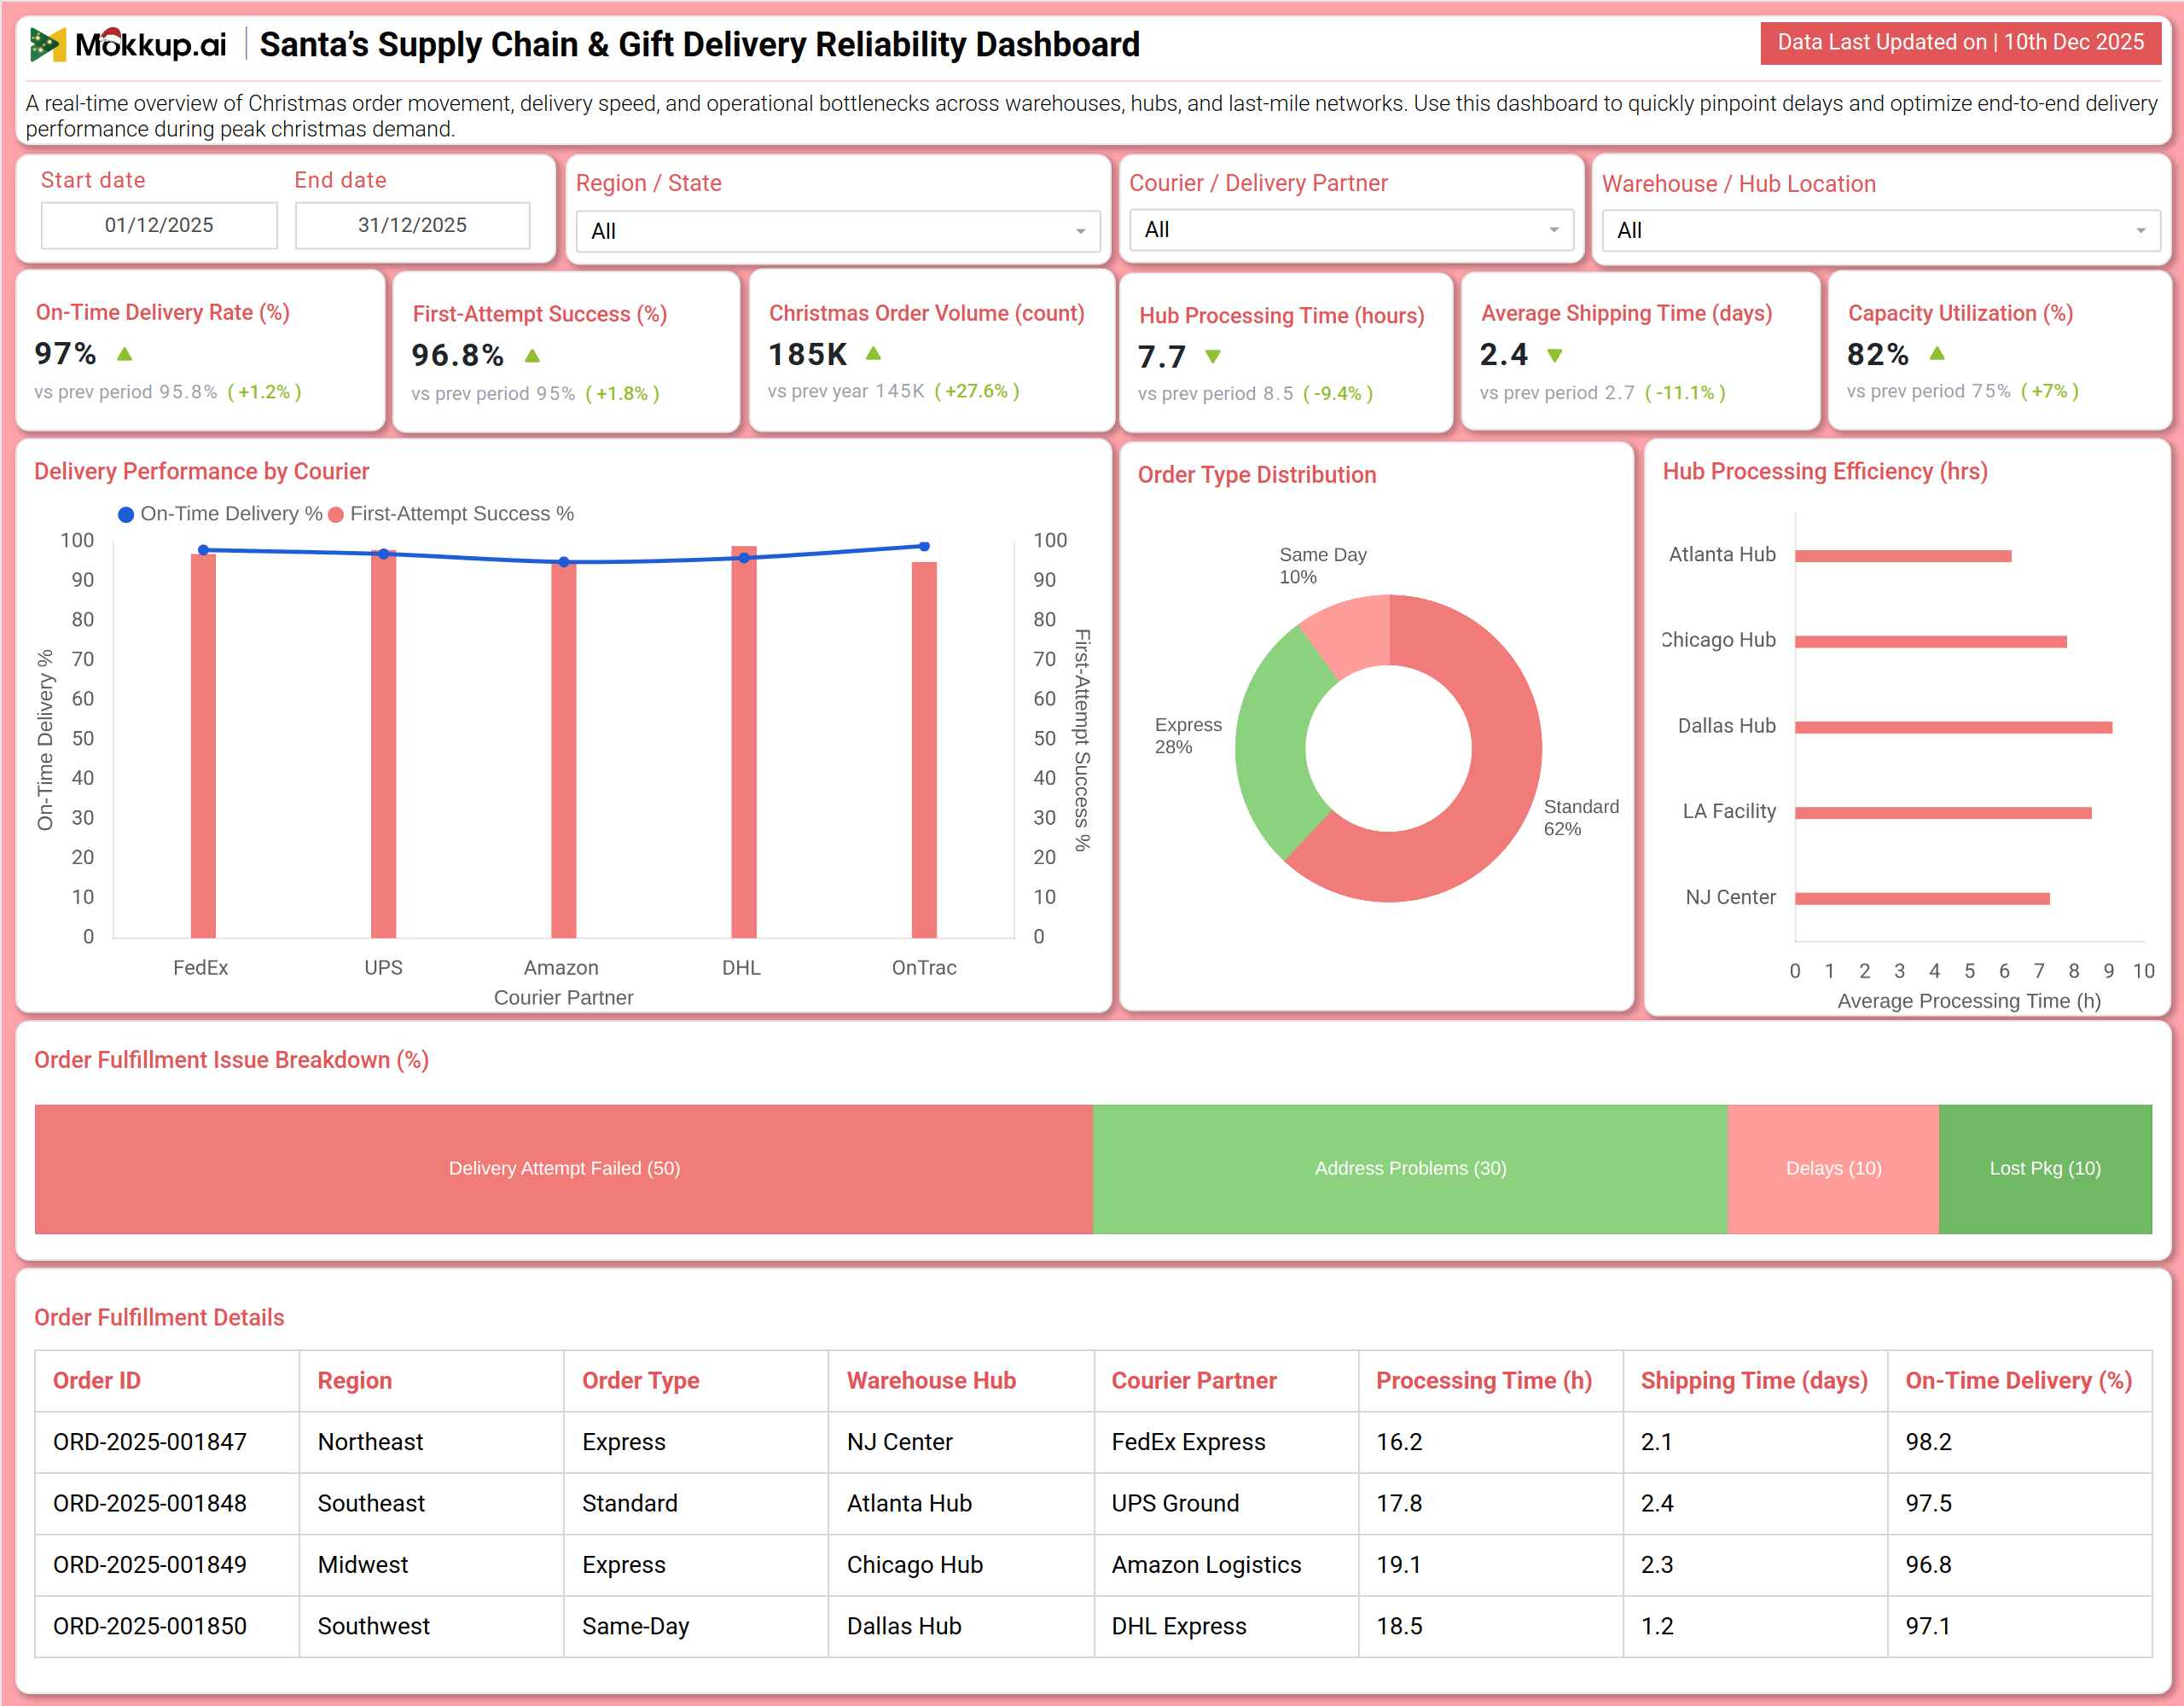
What is a Santa's Supply Chain & Gift Delivery Reliability Dashboard?
A Santa's Supply Chain & Gift Delivery Reliability Dashboard is a specialized operational tool designed to monitor and optimize the end-to-end gift fulfillment process during the peak holiday season. It consolidates key metrics such as on-time delivery, first-attempt success, hub efficiency, and order volume into a single visual platform. By integrating Christmas logistics performance monitoring, holiday supply chain bottleneck identification, and gift delivery reliability analytics, the dashboard helps logistics managers ensure timely deliveries, improve hub throughput, and enhance last-mile success rates. The dashboard serves as a command center for tracking courier performance, analyzing processing efficiency, and promptly addressing fulfillment issues to ensure customer satisfaction during the Christmas season.
How to Create a Santa's Supply Chain & Gift Delivery Reliability Dashboard
You don’t need to build your report from scratch—just start with a ready-to-use dashboard template from Mokkup. Add in your data and export it however you like. Here’s how to do it:
1. Create or Log in to Your Mokkup Account
Start by signing up on Mokkup.ai using your email. If you already have an account, just log in, and you’ll be good to go.
2. Choose and Customize Your Dashboard Template
Find the Santa's Supply Chain & Gift Delivery Reliability Dashboard template in the Templates section. Use the drag-and-drop editor to adjust KPIs, edit filters, or add elements based on your data.
3. Export to Your BI Tool
Once your dashboard wireframe is ready, use the BI Tool Export feature to send it directly to Power BI or Tableau for further analysis and enhancements. You can also download the dashboard as a PDF, PNG, or JPEG, embed it on a platform, or invite your team to collaborate.
Note: This is a Pro template. You’ll need a Pro subscription on Mokkup to use and customize this dashboard wireframe. Upgrade anytime to unlock full access.
Santa's Supply Chain & Gift Delivery Reliability Dashboard Example
You can create a Santa's Supply Chain & Gift Delivery Reliability Dashboard that brings together delivery performance, hub operations, and issue diagnostics into a unified view. A typical dashboard includes an Overview section, where users can track Christmas Order Volume, On-Time Delivery Rate, and First-Attempt Success. Visual charts, such as Delivery Performance by Courier and Hub Processing Efficiency, reveal the comparative speed and reliability of partners and facilities. The Hub & Courier Analysis section builds on this by displaying a detailed Order Fulfillment Issue Breakdown and a granular table of Order Fulfillment Details. Together, these modules deliver crucial holiday logistics KPI tracking that helps teams proactively manage capacity, expedite problem resolution, and maintain high service levels for all gift orders.
How to Analyze Data in Santa's Supply Chain & Gift Delivery Reliability Dashboard
Here is how you can analyze data from this dashboard:
- Monitor Christmas Order Volume: Track the total number of orders to understand demand intensity during peak holiday periods and ensure warehouses, couriers, and inventory are adequately prepared.
- Track On-Time Delivery Rate: Measure how consistently deliveries meet promised timelines to evaluate the overall reliability of the logistics and fulfillment network.
- Analyze First-Attempt Success Rate: Evaluate last-mile delivery effectiveness by determining the frequency with which packages are successfully delivered on the first attempt, which reflects address accuracy and courier efficiency.
- Review Hub Processing Time: Identify delays within warehouse sorting and dispatch operations to uncover operational bottlenecks that can impact downstream delivery timelines.
- Measure Average Shipping Time: Evaluate transit speed from dispatch hubs to final delivery locations to understand overall shipping performance and spot regional delays.
- Monitor Capacity Utilization: Ensure fulfillment centers and hubs operate at optimal capacity, preventing overload and associated delays caused by resource strain.
- Study Delivery Performance by Courier: Compare courier partners based on delivery speed, reliability, and success rates to support informed carrier selection and contract negotiations.
- Examine Hub Processing Efficiency: Pinpoint underperforming facilities that may need process improvements, staffing adjustments, or automation support.
- Investigate Order Fulfillment Issue Breakdown: Analyze causes of delivery failures or delays, such as address issues or failed delivery attempts, to enable targeted corrective actions.
- Scrutinize Order Fulfillment Details: Drill down into individual orders to quickly identify and troubleshoot delivery issues, providing responsive customer service.
Benefits of Santa's Supply Chain & Gift Delivery Reliability Dashboard
The following are the benefits of using this dashboard:
- Centralized Supply Chain Visibility: Provides a unified view of the entire holiday fulfillment journey from order placement to final gift delivery.
- Enhanced Christmas Logistics Performance Monitoring: Helps ensure service level agreements (SLAs) are consistently met, even during high-volume festive demand.
- Faster Bottleneck Identification: Enables proactive detection and resolution of supply chain issues before they escalate into customer-impacting delays.
- Improved Gift Delivery Reliability Analytics: Strengthens customer trust by reducing missed deliveries and minimizing support inquiries.
- Higher Operational Efficiency: Optimizes hub processing workflows and courier performance to improve speed and accuracy across the network.
- Stronger Peak Season Delivery Tracking: Combines volume, speed, and quality metrics into a single view for better holiday execution.
- Reduced Manual Reporting Effort: Automates KPI tracking and consolidation, freeing teams from the time-consuming task of maintaining spreadsheets.
- Better Daily Operational Preparedness: Equips operations teams with detailed, actionable insights for daily reviews and rapid issue resolution.
KPIs to Track in Santa's Supply Chain & Gift Delivery Reliability Dashboard
The following key KPIs can be tracked by using this dashboard:
- On-Time Delivery Rate (%): The percentage of orders delivered by the promised date and time.
- First-Attempt Success Rate (%): The percentage of deliveries completed on the very first attempt.
- Christmas Order Volume (count): The total number of gift orders processed during the holiday season.
- Hub Processing Time (hours): The average time an order spends being processed within a distribution hub.
- Average Shipping Time (days): The average duration from hub dispatch to customer delivery.
- Capacity Utilization (%): The percentage of available warehouse or hub capacity being used.
- Order Fulfillment Issue Rate (%): The breakdown of orders affected by specific problems like failed deliveries or delays.
- Courier Performance Score (%): A composite or comparative metric rating delivery partners on on-time and first-attempt success.
Frequently Asked Questions
1. What is the purpose of this supply chain dashboard?
It helps logistics and operations teams ensure the reliable, timely, and efficient delivery of gifts during the high-volume Christmas season by monitoring every stage of the fulfillment process.
2. Can the dashboard identify slow warehouses?
Yes. The Hub Processing Efficiency chart directly compares average processing times across different facilities to highlight bottlenecks.
3. How does the dashboard assist in selecting delivery partners?
By comparing On-Time Delivery and First-Attempt Success rates side-by-side for each courier, it provides data for evaluating partner performance.
4. Does it show why deliveries are failing?
Yes. The Order Fulfillment Issue Breakdown categorizes the primary reasons for delivery failures, including address issues or failed attempts.
5. Who uses this dashboard?
Supply chain managers, logistics coordinators, warehouse supervisors, operations directors, and customer service leads.