
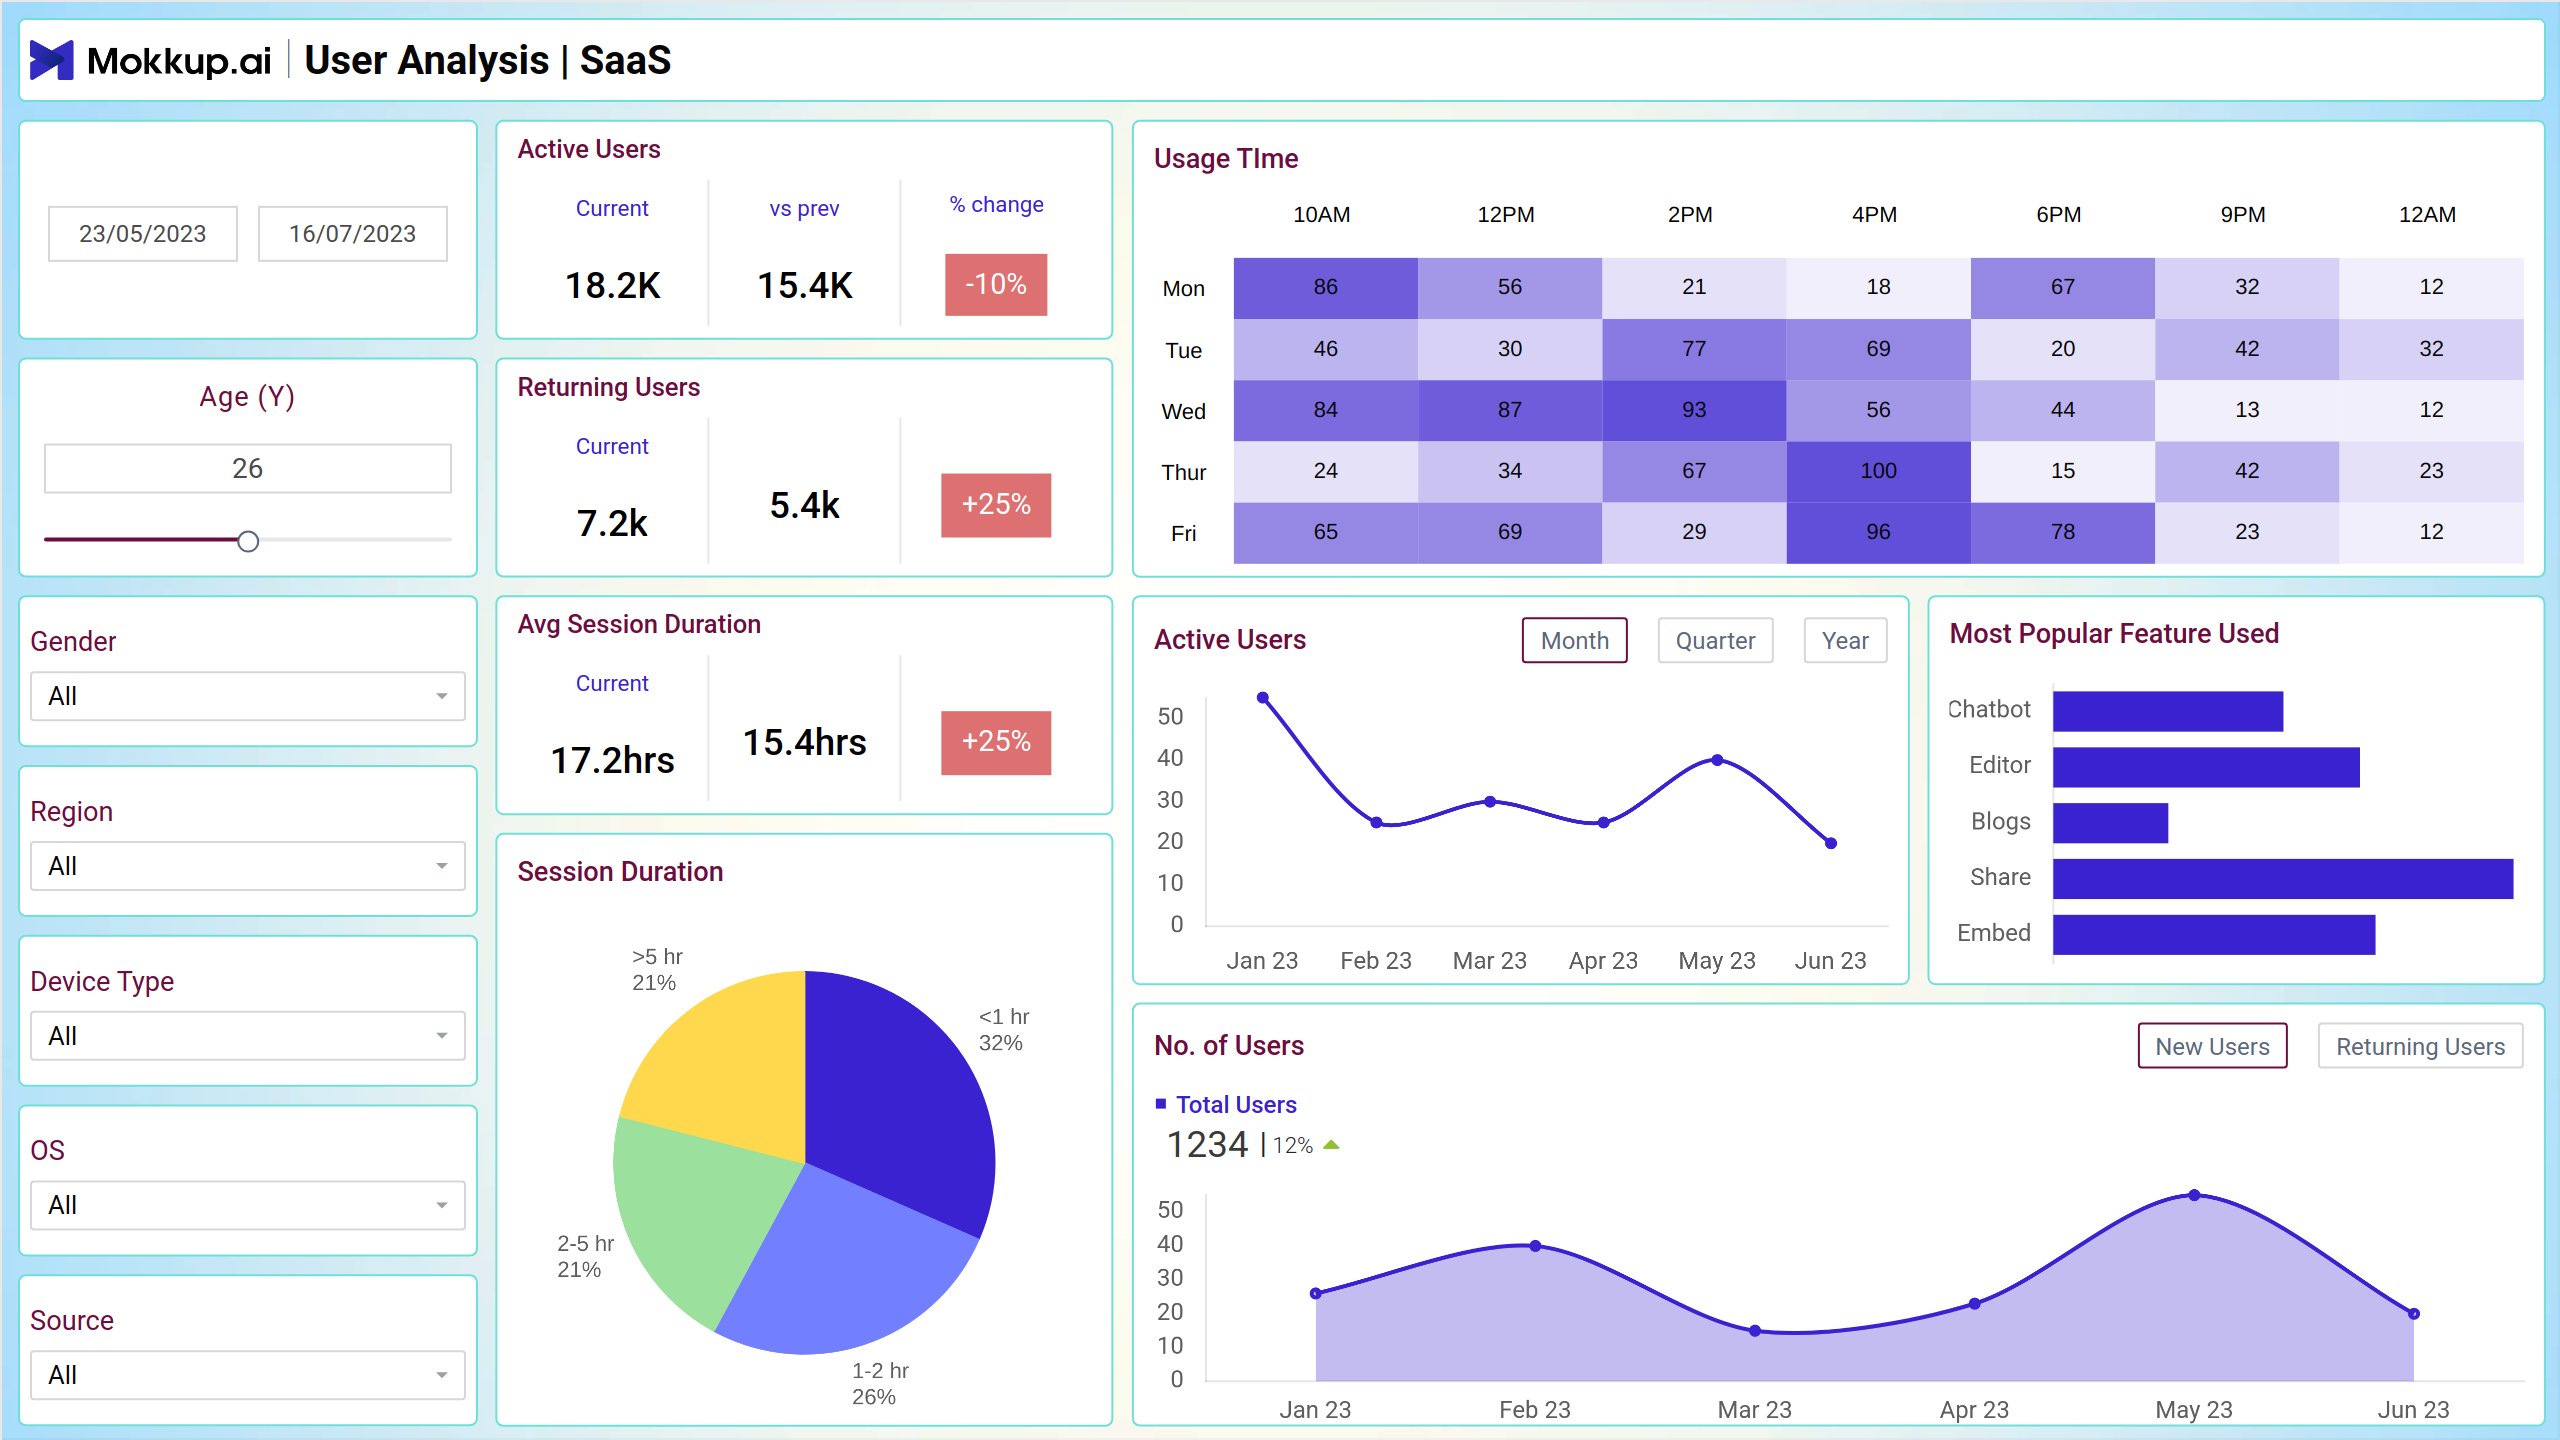
This dashboard wireframe offers a comprehensive breakdown of user data analysis across four screens. From insights into User Activity, it tracks engagement metrics and feature popularity. Moving to Demographic Insights explores user demographics and distribution. Opportunity Metrics screen delves into revenue generation and customer relationship analysis. Finally, the Comparative Analysis screen provides benchmarks and trends for strategic decision-making.
User Activity
This is a comprehensive screen providing insights into user engagement and behavior. Track Active Users to gauge current platform activity, while average session duration offers a glimpse into user interaction patterns. Identify the Most Popular Feature Used to optimize user experience and monitor Session Duration to understand user engagement depth. Usage Time provides an overview of overall platform utilization, empowering informed decision-making.
Key Terms to consider:
- Active Users: The number of users currently engaged with the platform or service.
- Avg Session Duration: The average amount of time users spend in a single session.
- Most Popular Feature Used: The feature within the platform or service that is most frequently accessed or utilized by users.
- Session Duration: The length of time a user spends engaged in a single session on the platform or service.
- Usage Time: The overall duration of time that users spend utilizing the platform or service.
Demographic Insights
This screen is designed to delve into user demographics and preferences. Gain insights into Geographic Distribution, understanding where your users are located globally. Explore Age Distribution to tailor your platform to different age demographics. Analyze OS and Device Distribution to optimize compatibility and user experience. Gender Distribution provides valuable insights for targeted marketing strategies and inclusive design practices.
Key Terms to consider:
- Geographic Distribution: The spread of users across different regions or locations.
- Age Distribution: The distribution of users based on their age demographics.
- OS Distribution: The distribution of users according to the operating systems they use, such as Windows, macOS, Android, or iOS.
- Device Distribution: The distribution of users based on the types of devices they use, such as smartphones, tablets, or computers.
- Gender Distribution: The distribution of users based on their gender identities.
Opportunity Metrics
A comprehensive solution for analyzing key metrics vital to business growth. Monitor Conversion Rate to track user engagement, while Avg Revenue/Active User provides insights into revenue generation. Understand Customer Lifetime Value Distribution to optimize long-term relationships, and analyze Customer Churn Rate vs Time to mitigate attrition. Revenue tracking offers a holistic view of your business's financial performance.
Key Terms to consider:
- Conversion Rate: The percentage of users who take a desired action, such as making a purchase or signing up for a service, out of the total number of visitors or users.
- Avg Revenue/Active User: The average revenue generated per user over a specific period of time.
- Customer Lifetime Value Distribution: The distribution of the total value a customer brings to a business over their entire relationship with that business, encompassing all purchases and interactions.
- Customer Churn Rate vs Time: The rate at which customers stop using a product or service over a specified period, analyzed over time to identify trends and patterns.
- Revenue: The total income generated by a business from its sales of goods or services over a specific period.
Comparative Analysis
This screen is a comprehensive solution for analyzing key metrics vital to business growth. Monitor Conversion Rate to track user engagement, while Avg Revenue/Active User provides insights into revenue generation. Understand Customer Lifetime Value Distribution to optimize long-term relationships, and analyze Customer Churn Rate vs Time to mitigate attrition. Revenue tracking offers a holistic view of your business's financial performance.
Key Terms to consider:
- Conversion Rate Comparison: A comparison of the percentage of users who take a desired action, such as making a purchase, across different time periods or segments to assess changes or trends.
- New User by Source: The identification and tracking of where new users are coming from, such as through direct visits, referrals, or marketing campaigns.
- Avg. Customer Satisfaction Score: The average score representing the level of satisfaction reported by customers based on surveys or feedback mechanisms.
- Revenue Per User: The average amount of revenue generated by each individual user over a specific period of time.
- Most Used Activity/Feature: The activity or feature within a product or service that is most frequently accessed or utilized by users.
- Avg Session Time: The average duration of time that users spend engaged in a single session on the platform or service.
Dashboard Template Insights
- The dashboard wireframe provides a comprehensive analysis of user data across screens.
- Opportunity Metrics and Comparative Analysis offer vital insights.
- Businesses can use these insights for informed decision-making and strategic planning and the goal is to optimize performance and enhance user experience.
Conclusion
This dashboard wireframe serves as a powerful tool for businesses seeking to understand and leverage user data effectively. By providing insights into user activity, demographics, and revenue metrics, it empowers informed decision-making and strategic planning. With a focus on optimizing engagement, revenue generation, and customer satisfaction, this dashboard equips businesses with the tools they need to thrive in today's competitive landscape.