
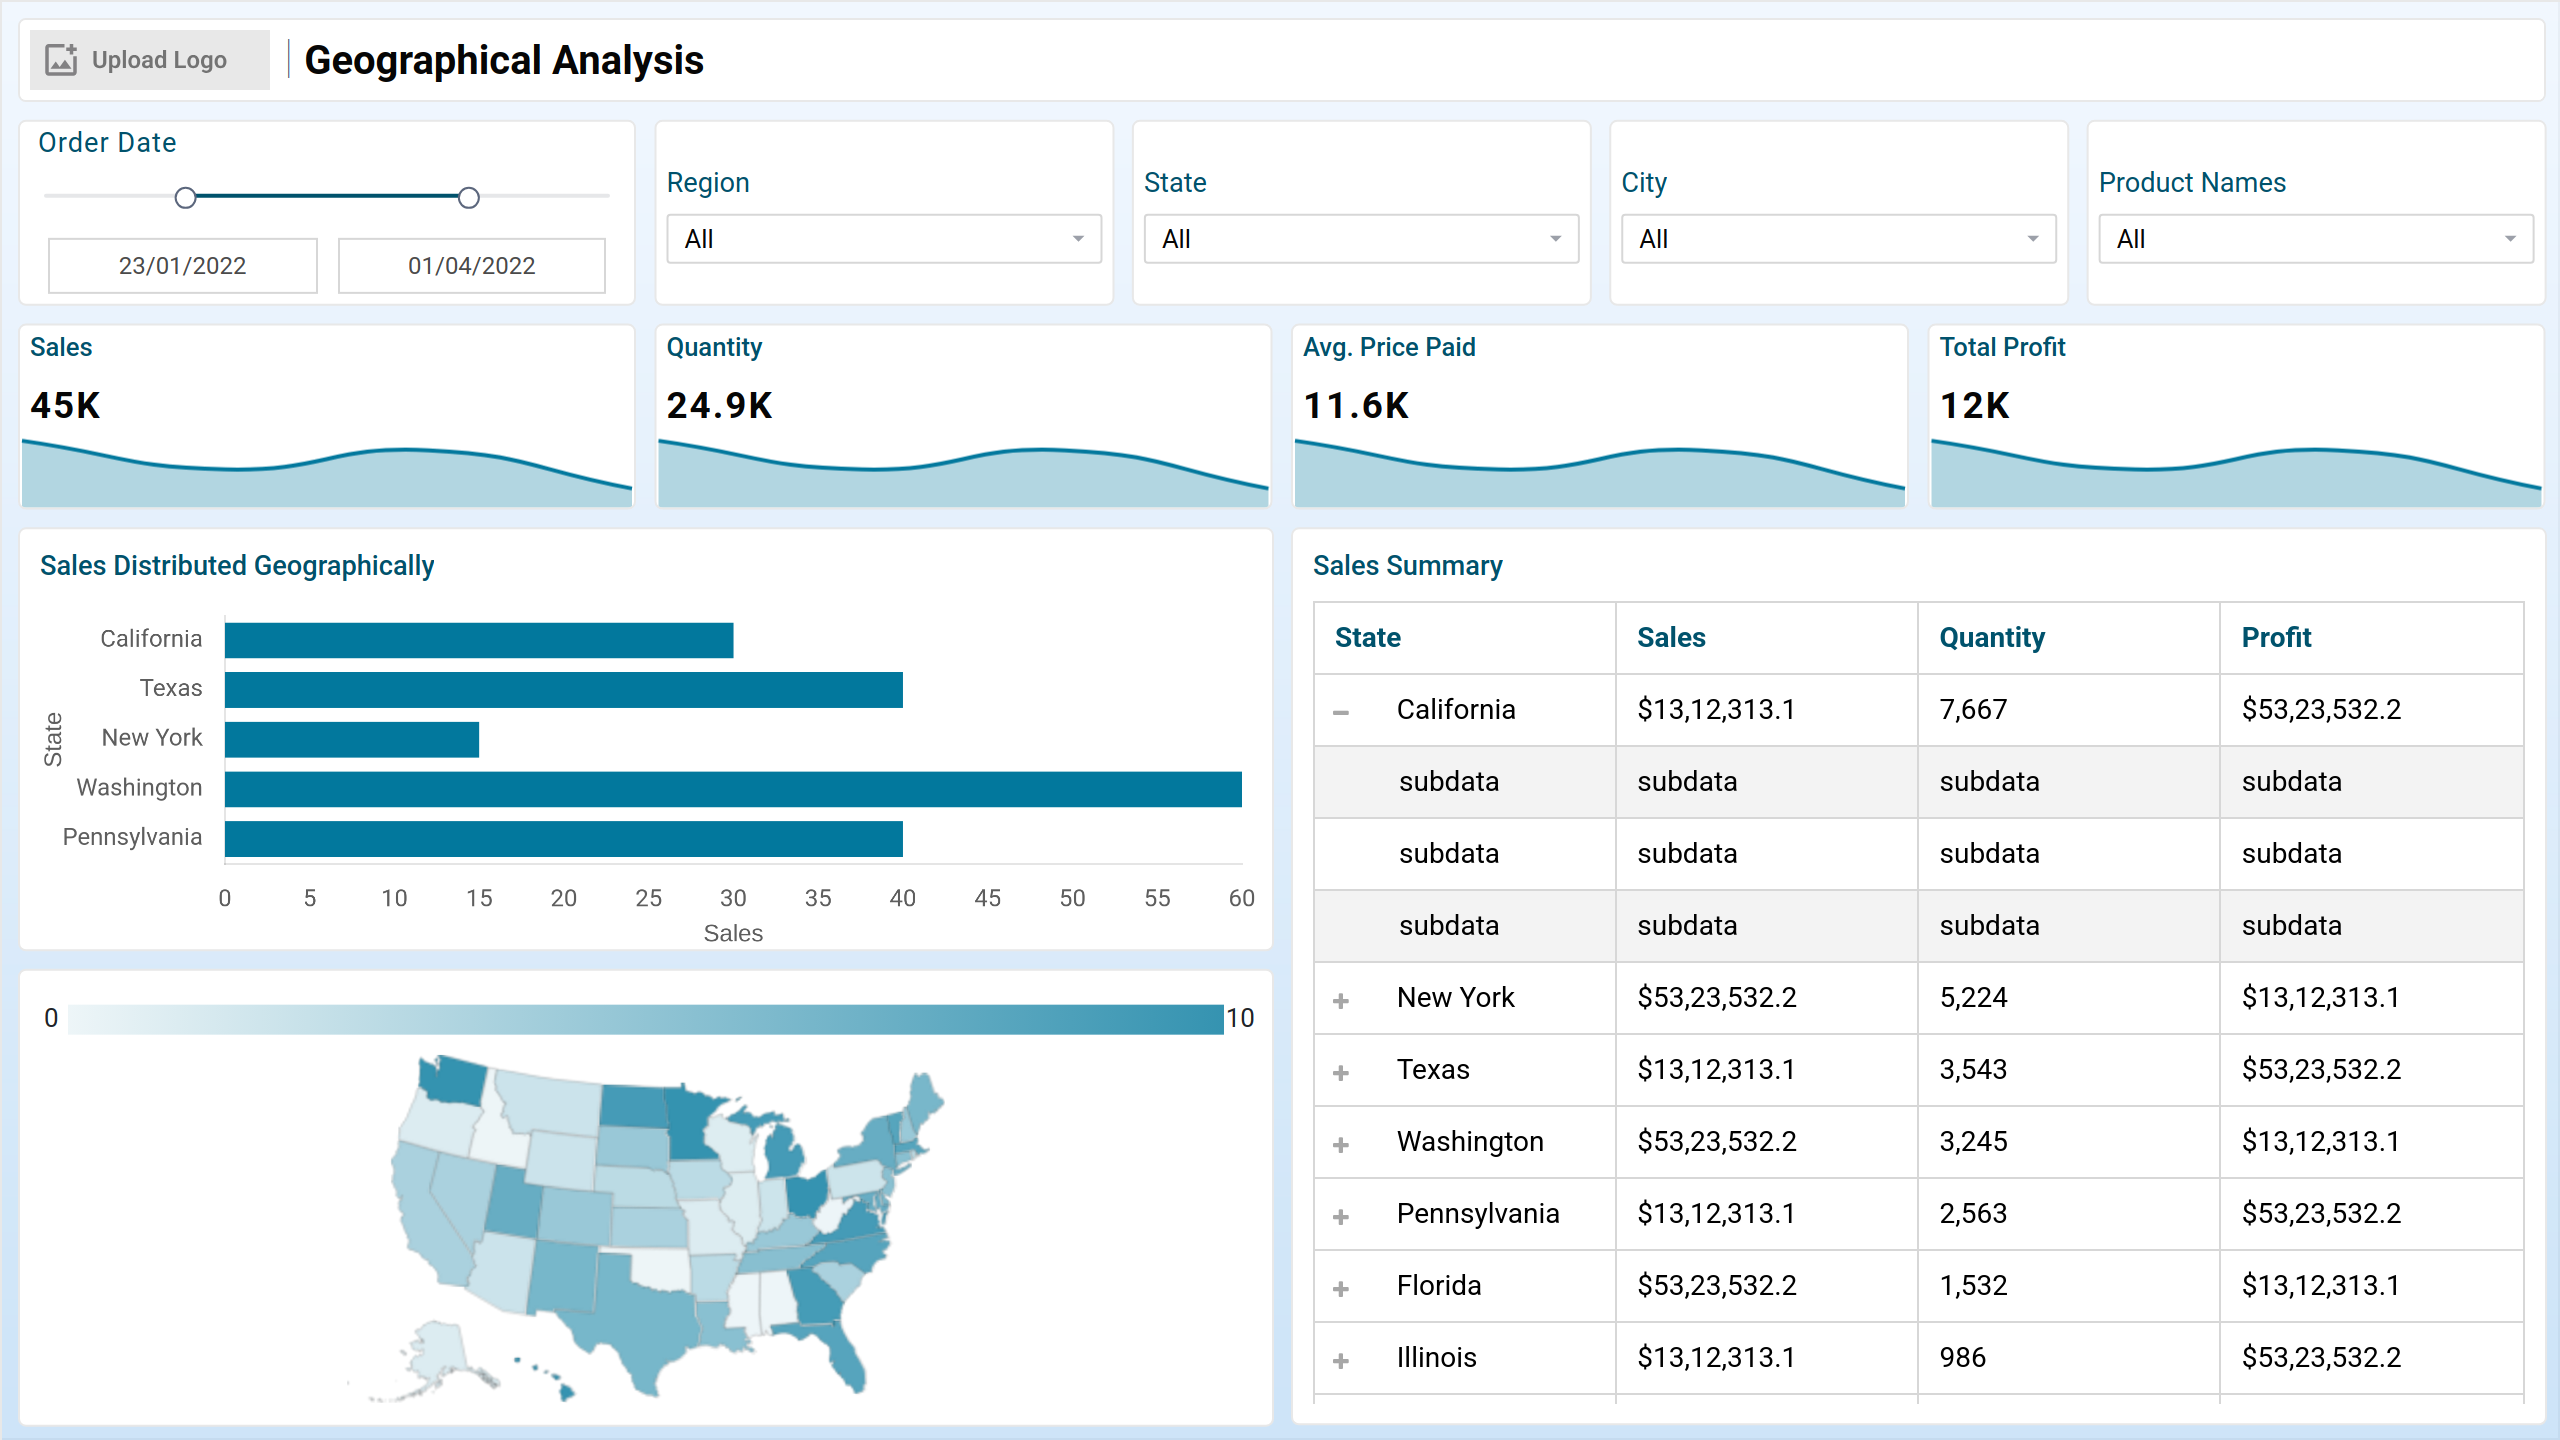
The SaaS Geographical Analysis dashboard template has endless possibilities. Organizations can gain important knowledge on software usage, client preferences, and ideal customer base expansion through geographical data and sales trend analysis, giving them a competitive edge.
This dashboard provides comprehensive region-wise analysis, including SAAS sales performance, returns, customer behavior, pricing, and product preferences.
Summary Overview
In order to establish a business successfully, geographic analysis is essential. Optimizing marketing efforts and budget allocation involves having a thorough understanding of client geographies, lucrative regions, and product preferences.
Key Terms to Know:
- Sales Distributed Geographically - Essential for business success, geographic analysis enables optimization of marketing efforts and budget allocation by understanding client geographies, lucrative regions, and product preferences.
- Sales Summary - A comprehensive overview of sales performance, providing valuable insights for strategic decision-making and business optimization.
- Average price paid - A key metrics influencing sales strategy, helping businesses gauge potential customer behaviar and make informed pricing decisions for increased profitability.
Detailed Analysis
Businesses can ensure efficient resource use by reevaluating marketing expenditures depending on regional revenue and profitability. Additionally, understanding regional product preferences helps with the effective launch of new items.
Key Terms to Know:
- Lost Sales State Wise - Tracking lost sales state-wise allows businesses to identify specific regions where sales potential may be untapped, enabling targeted strategies for improvement.
- Cancelled Orders - Monitoring canceled orders provides insights into customer behavior and potential issues, allowing businesses to refine their processes and reduce order cancellations.
- Product names & Region - Analyzing particular product and their performance in different regions helps businesses tailor marketing strategies, optimize inventory, and meet specific regional demand patterns.
Refunds and Returns
With the use of this dashboard, organizations can evaluate regional sales trend, design targeted pricing and marketing plans, track trends in product purchases, and measure consumer satisfaction.
Key Terms to Know:
- Regional Sales Distribution - Understanding regional sales distribution is vital for businesses to tailor marketing strategies and allocate resources effectively based on geographic demand.
- Top Cities by Sale - Identifying top-performing cities in terms of sales helps businesses focus marketing efforts, enhance customer engagement, and capitalize on lucrative markets.
- Regional Split - Analyzing the regional split provides insights into the contribution of different regions to overall sales, guiding businesses in strategic decision-making and resource allocation.
- Top Products by Sales - Identifying the top-selling products enables businesses to prioritize marketing efforts, optimize inventory, and capitalize on high-demand items for increased sales and profitability.
Dashboard Template Insights
- The Geographical Analysis Dashboard offers critical insights into software usage, client preferences, and customer base expansion.
- Provides comprehensive region-wise analysis, underscoring the significance of geographic analysis for business success.
- Helps decision-makers establish pricing plans and identify growth opportunities.
- Utilizes metrics such as Average Price Paid (APP) and revenue-generating cities to inform strategies.
- Demonstrates how APP influences company decisions and tracks the effects of promotional activities on sales.
- Highlights areas with high refund rates, enabling companies to address operational issues promptly.
Conclusion
The Geographical Analysis Dashboard enables SaaS organizations to utilize geographical data and obtain a deeper insight into consumer behavior across countries. Businesses can improve marketing initiatives, customize pricing tactics, and raise general customer satisfaction by using the data provided.