
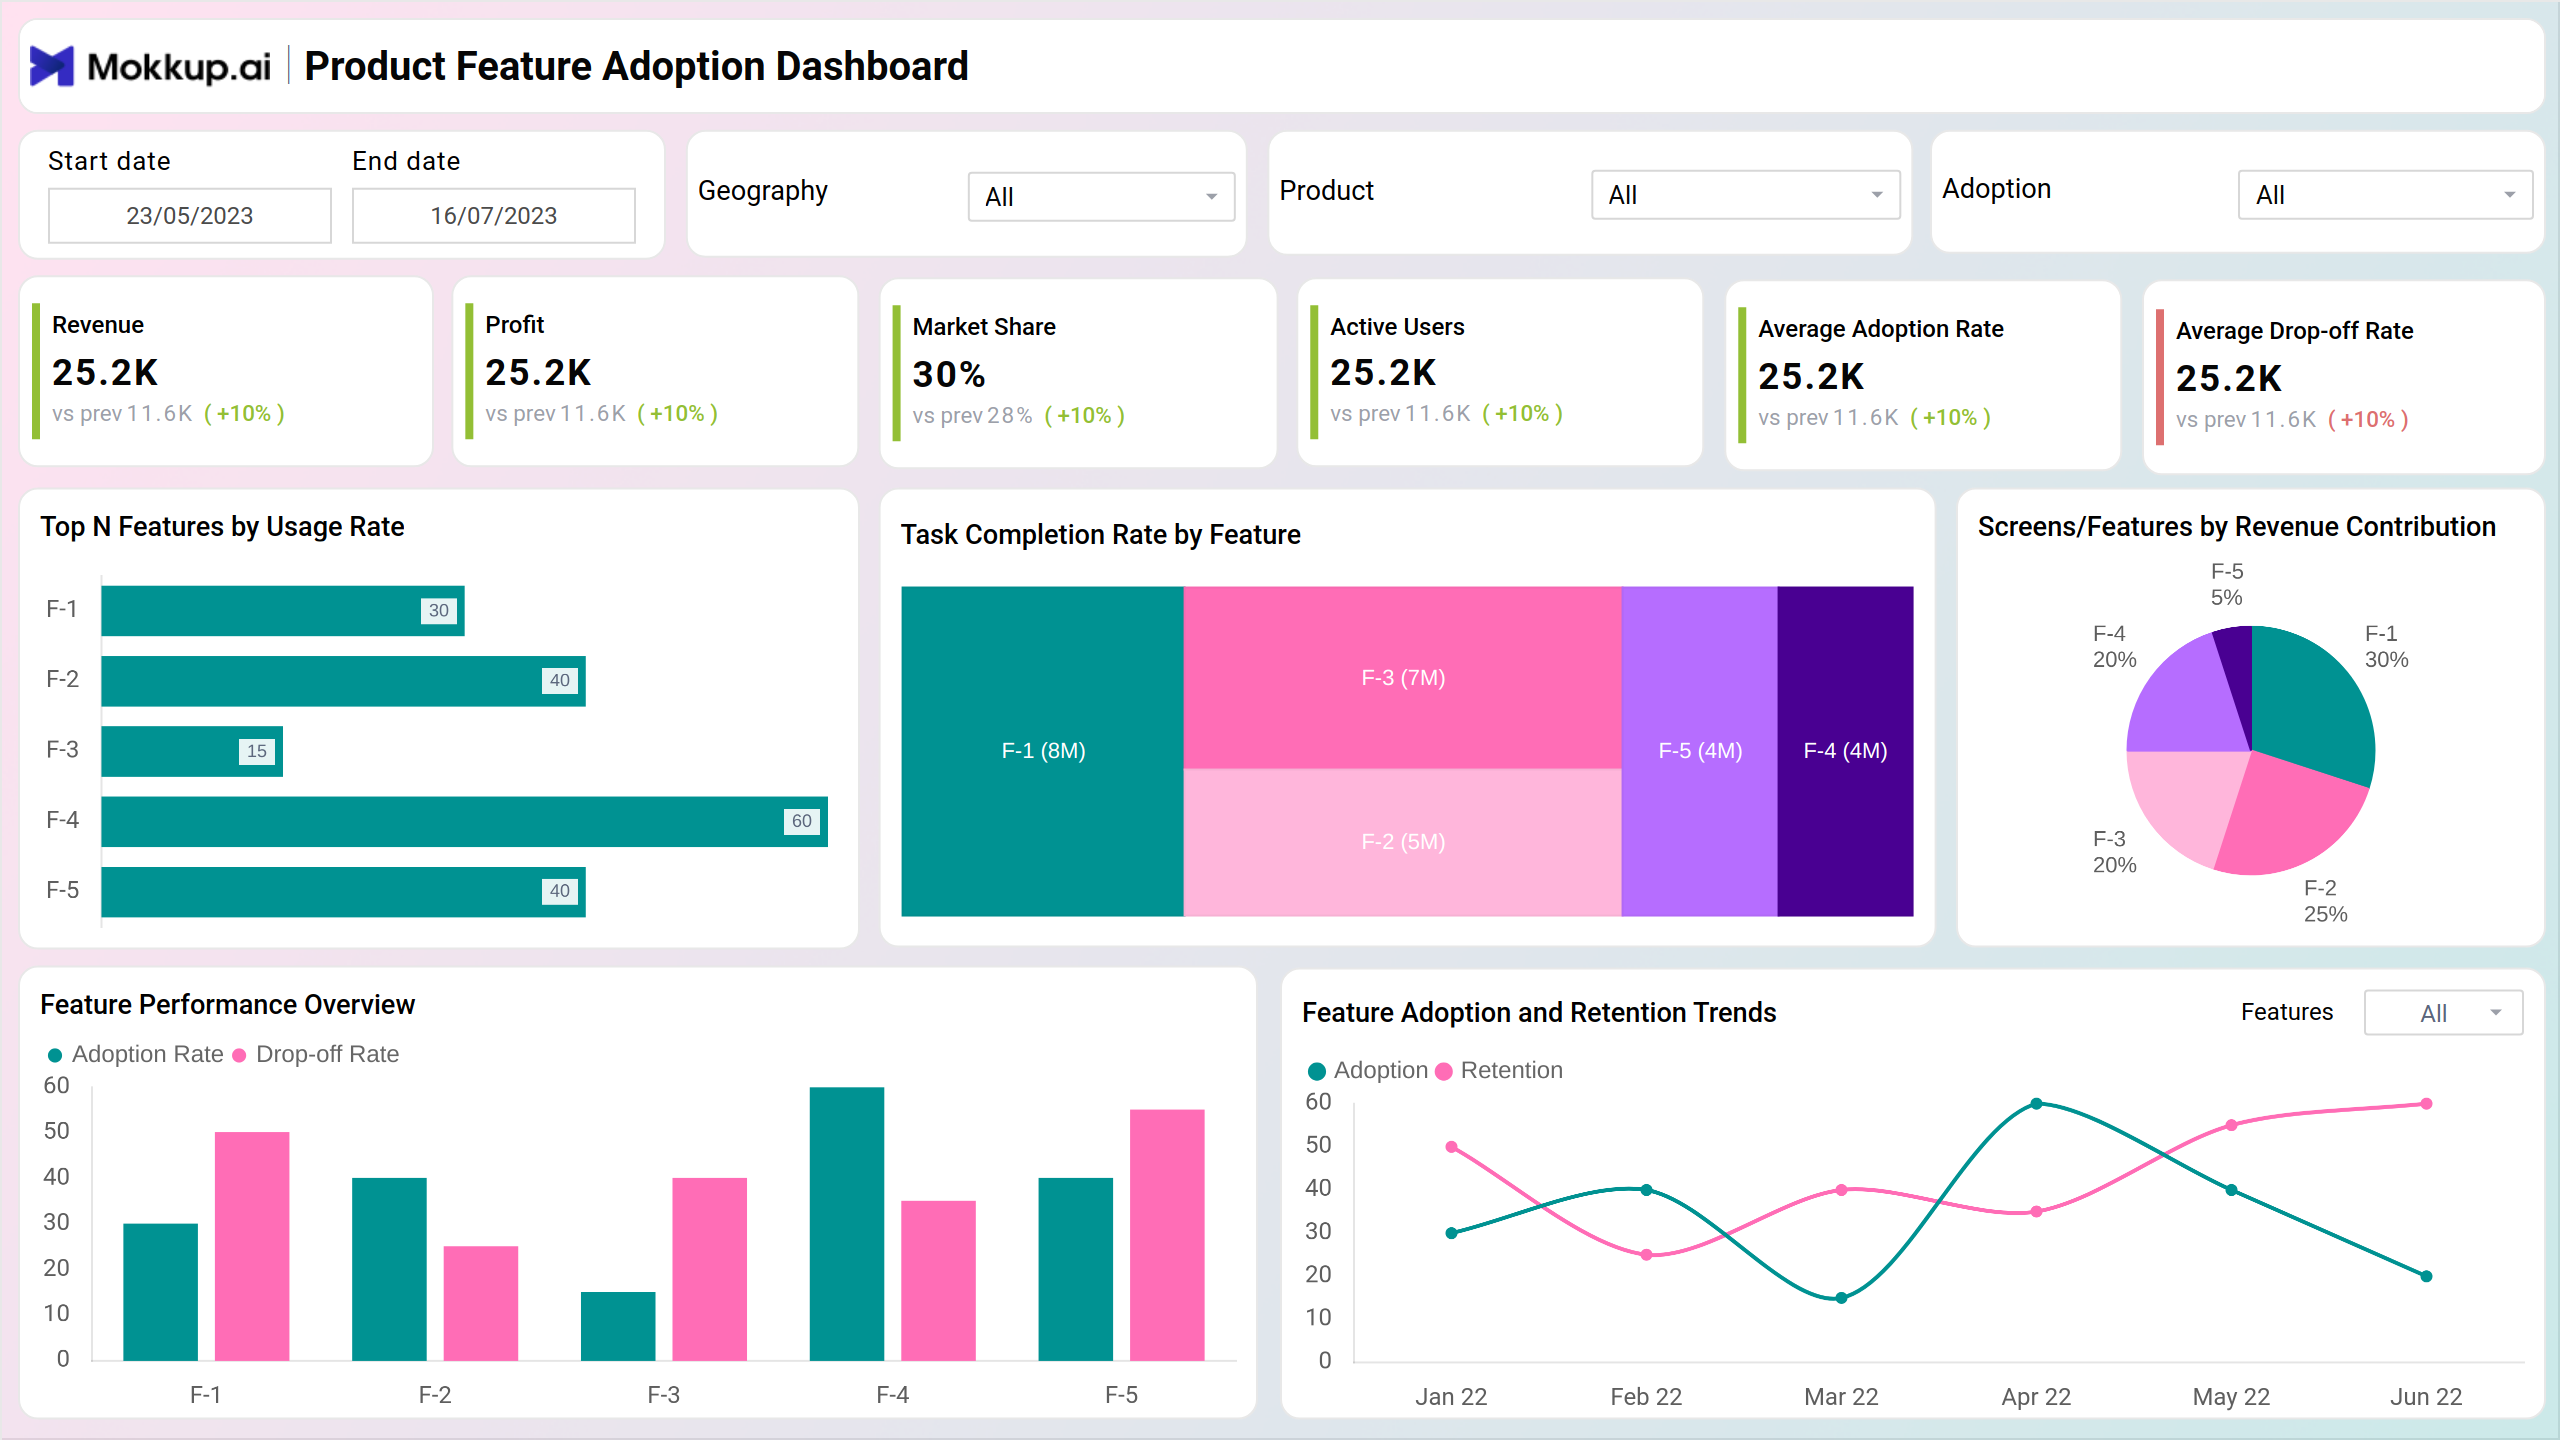
The SaaS Feature Adoption Report dashboard template offers valuable insights into how users engage with your software's different features. It tracks key metrics like adoption rates, user activity, and feature performance, helping you understand which features resonate with users and identify areas for improvement to enhance the overall user experience.
It is divided into two main screens: Overview and Detailed.
Overview
This screen offers a detailed view of user engagement with various product features. It tracks key metrics such as feature usage frequency, session duration, repeat usage rates, and customer concerns.
Key Terms to Know
- Revenue: The total revenue earned, showing a 10% increase compared to the previous period.
- Profit: The profit generated, also reflecting a 10% increase.
- Market Share: The percentage of market control, showing a 2% increase from the previous period.
- Active Users: The total number of active users, with a 10% increase compared to the previous period.
- Average Adoption Rate: The average percentage of users adopting new features, showing a 10% growth.
- Average Drop-off Rate: The percentage of users who discontinued usage, reflecting a 10% reduction.
- Top N Features by Usage Rate: A ranking of the top features based on user engagement, with Feature 1 showing the highest usage rate.
- Task Completion Rate by Feature: A comparison of the completion rates for tasks across different features, indicating the highest completion with Feature 1.
- Feature Performance Overview: A visual representation of adoption rates versus drop-off rates for each feature, showing performance trends.
- Feature Adoption and Retention Trends: A graph tracking the adoption and retention trends for various features over time, indicating fluctuations in user interest.
- Screens/Features by Revenue Contribution: A pie chart showing how each feature contributes to overall revenue, with Feature 1 contributing the largest share.
Detailed
This view provides a comprehensive overview of key metrics related to feature usage, adoption, and performance. It tracks revenue, active users, and market share, offering insights into user engagement and feature popularity. With detailed views of task completion rates, adoption trends, and feature performance, this dashboard helps identify areas for optimization and guides data-driven decisions
Key Terms to Know
- Feature Usage Frequency: Measures how often users interact with a specific feature.
- Session Duration on Feature (Minutes): Tracks the average time users spend on a feature per session.
- Repeat Usage Rate: Indicates the percentage of users who return to use a feature multiple times.
- Feature Stickiness Rate: Represents the feature's ability to retain users over time.
- Feature NPS (Net Promoter Score): Gauges user satisfaction and loyalty towards a specific feature.
Dashboard Template Insights
This dashboard wireframe provides key insights into user engagement and feature performance. Here are some important takeaways:
- It highlights the adoption rates of various features, helping identify which ones are most and least utilized by users.
- Tracks user activity to assess feature stickiness and how often features are revisited.
- Provides detailed insights into user feedback and concerns, allowing for targeted improvements.
- Enables monitoring of feature performance over time, supporting data-driven decisions for future updates.
Conclusion
This dashboard provides a clear view of feature usage trends and user feedback, empowering you to make informed decisions about product enhancements. By focusing on features with the highest potential for growth, you can drive user satisfaction, increase adoption rates, and ultimately boost the success of your SaaS product.