
What is a Retail Customer Retention Dashboard?
A Retail Customer Retention Dashboard helps businesses monitor how well they’re keeping existing customers over time. It compiles data from transactions, retail loyalty tracking systems, and engagement activities to provide insights into shopper behavior. With this centralized churn analysis dashboard, retail teams can identify at-risk customers, track repeat purchase metrics, and evaluate the effectiveness of loyalty campaigns.
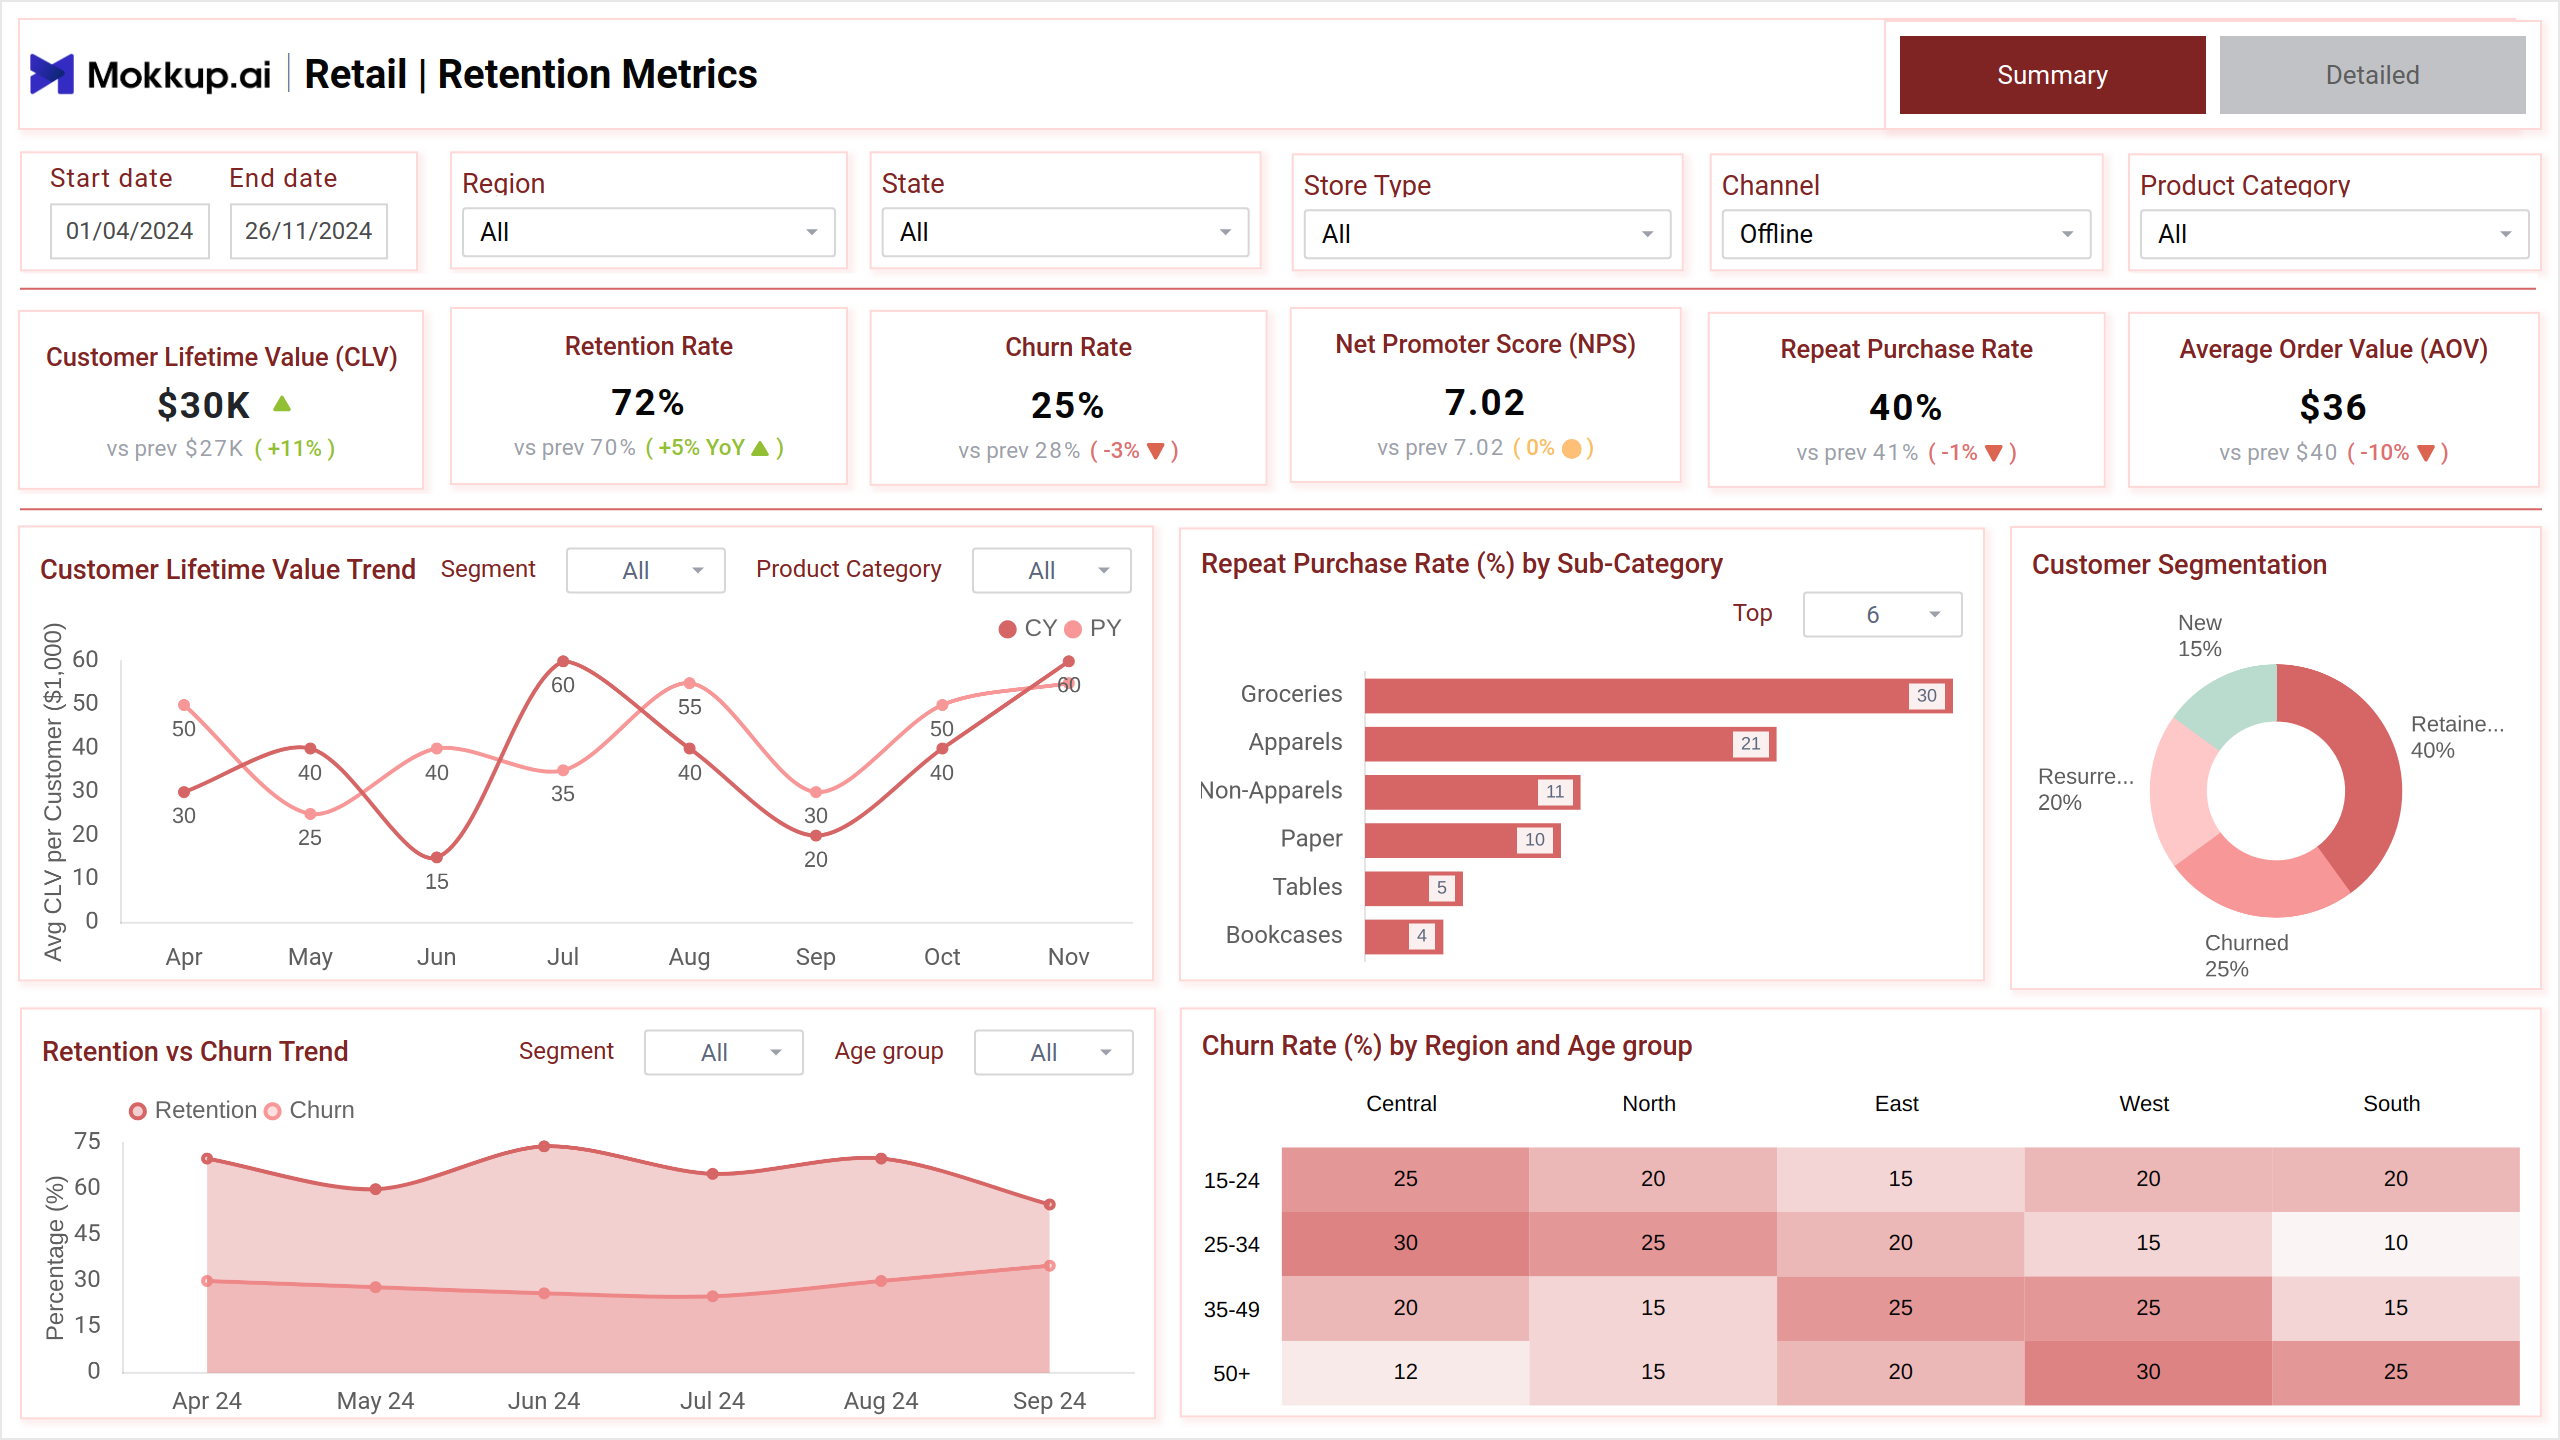
Customer Retention Dashboard Example
Design your own customer retention dashboard using a layout that highlights key metrics like repeat purchase rates, churn trends, and lifetime value. As part of the AI retail dashboard templates collection, the Mokkup Retail Customer Retention Dashboard offers a clean, structured view of data across customer segments and timeframes. Powered by the Mokkup.ai customer retention tool, you can easily upload your data, customize the layout, and export to Power BI or Tableau for advanced reporting. Whether you're running a boutique or a multi-location retail chain, this template provides the insights you need to build stronger customer relationships.
How to Analyze Data in Retail Retention Dashboards
Retail retention dashboards help you understand what keeps customers coming back—and what might be driving them away. With a clean split between summary and detailed views, this dashboard makes it easy to spot trends, assess retention efforts, and tailor your strategies.
- Summary View: Get a quick snapshot of key metrics like total customers, repeat purchase rate, churn risk, and average order value. Ideal for reviewing overall retention performance at a glance.
- Detailed View: Dive deeper into customer segments, past campaign effects, repeat behavior, and purchase frequency. Perfect for uncovering patterns and fine-tuning loyalty initiatives.
How to Create a Customer Retention Dashboard for Retail
You don’t need to start from scratch. Use Mokkup.ai’s retail retention template to get up and running in minutes. Here’s how:
1. Create or Log in to Your Mokkup Account
Sign up or log in at Mokkup.ai to access pre-built templates.
2. Select and Customize the Dashboard Template
Go to the Templates section and choose the Retail Customer Retention Dashboard. Use the drag-and-drop editor to adjust metrics like customer lifetime value, churn rate, loyalty points, or frequency of visits. Apply filters by store location, date range, or customer type.
3. Export to Your BI Tool
When ready, export your dashboard to Power BI, Tableau, or save as PDF/PNG. Share it with your marketing or CRM teams for collaboration.
Note: This is a Pro template. To use and customize this dashboard, you’ll need a Pro subscription on Mokkup. Upgrade anytime to unlock full access.
Benefits of Customer Retention Dashboards
Customer retention dashboards help retail teams make informed decisions using historical and behavioral data. With Mokkup’s visual customer journey dashboard templates, you can clearly see how customers interact with your brand at every stage. Looking for a free retention dashboard example? Mokkup offers ready-to-use layouts that let you:
- Boost Repeat Purchases: Identify loyal shoppers and offer targeted incentives.
- Reduce Churn: Spot at-risk customers early and win them back with personalized offers.
- Enhance Campaigns: Understand which loyalty efforts are working and which need adjustment.
- Align Teams: Give marketing, CRM, and sales teams a shared view of retention goals.
KPIs to Track in Customer Retention Dashboards
To measure the success of your retention efforts, focus on these essential KPIs:
- Repeat Purchase Rate: Percentage of customers who’ve made more than one purchase.
- Customer Lifetime Value (CLV): Total expected revenue from a customer over their relationship with your brand.
- Churn Rate: Percentage of customers who stop buying within a specific period.
- Retention Rate: Percentage of customers retained compared to a baseline.
- Average Order Value (AOV): The average spend per transaction across repeat customers.
Frequently Asked Questions
1. How can this dashboard improve our customer retention strategy?
By showing who’s returning, who’s at risk of leaving, and how campaigns are performing, the dashboard gives you the clarity needed to strengthen loyalty programs, refine offers, and reduce churn.
2. Can I customize the dashboard for different customer segments?
Yes. Use filters to isolate data by location, purchase behavior, or customer type. This makes it easy to tailor insights for specific audience groups or campaigns.