
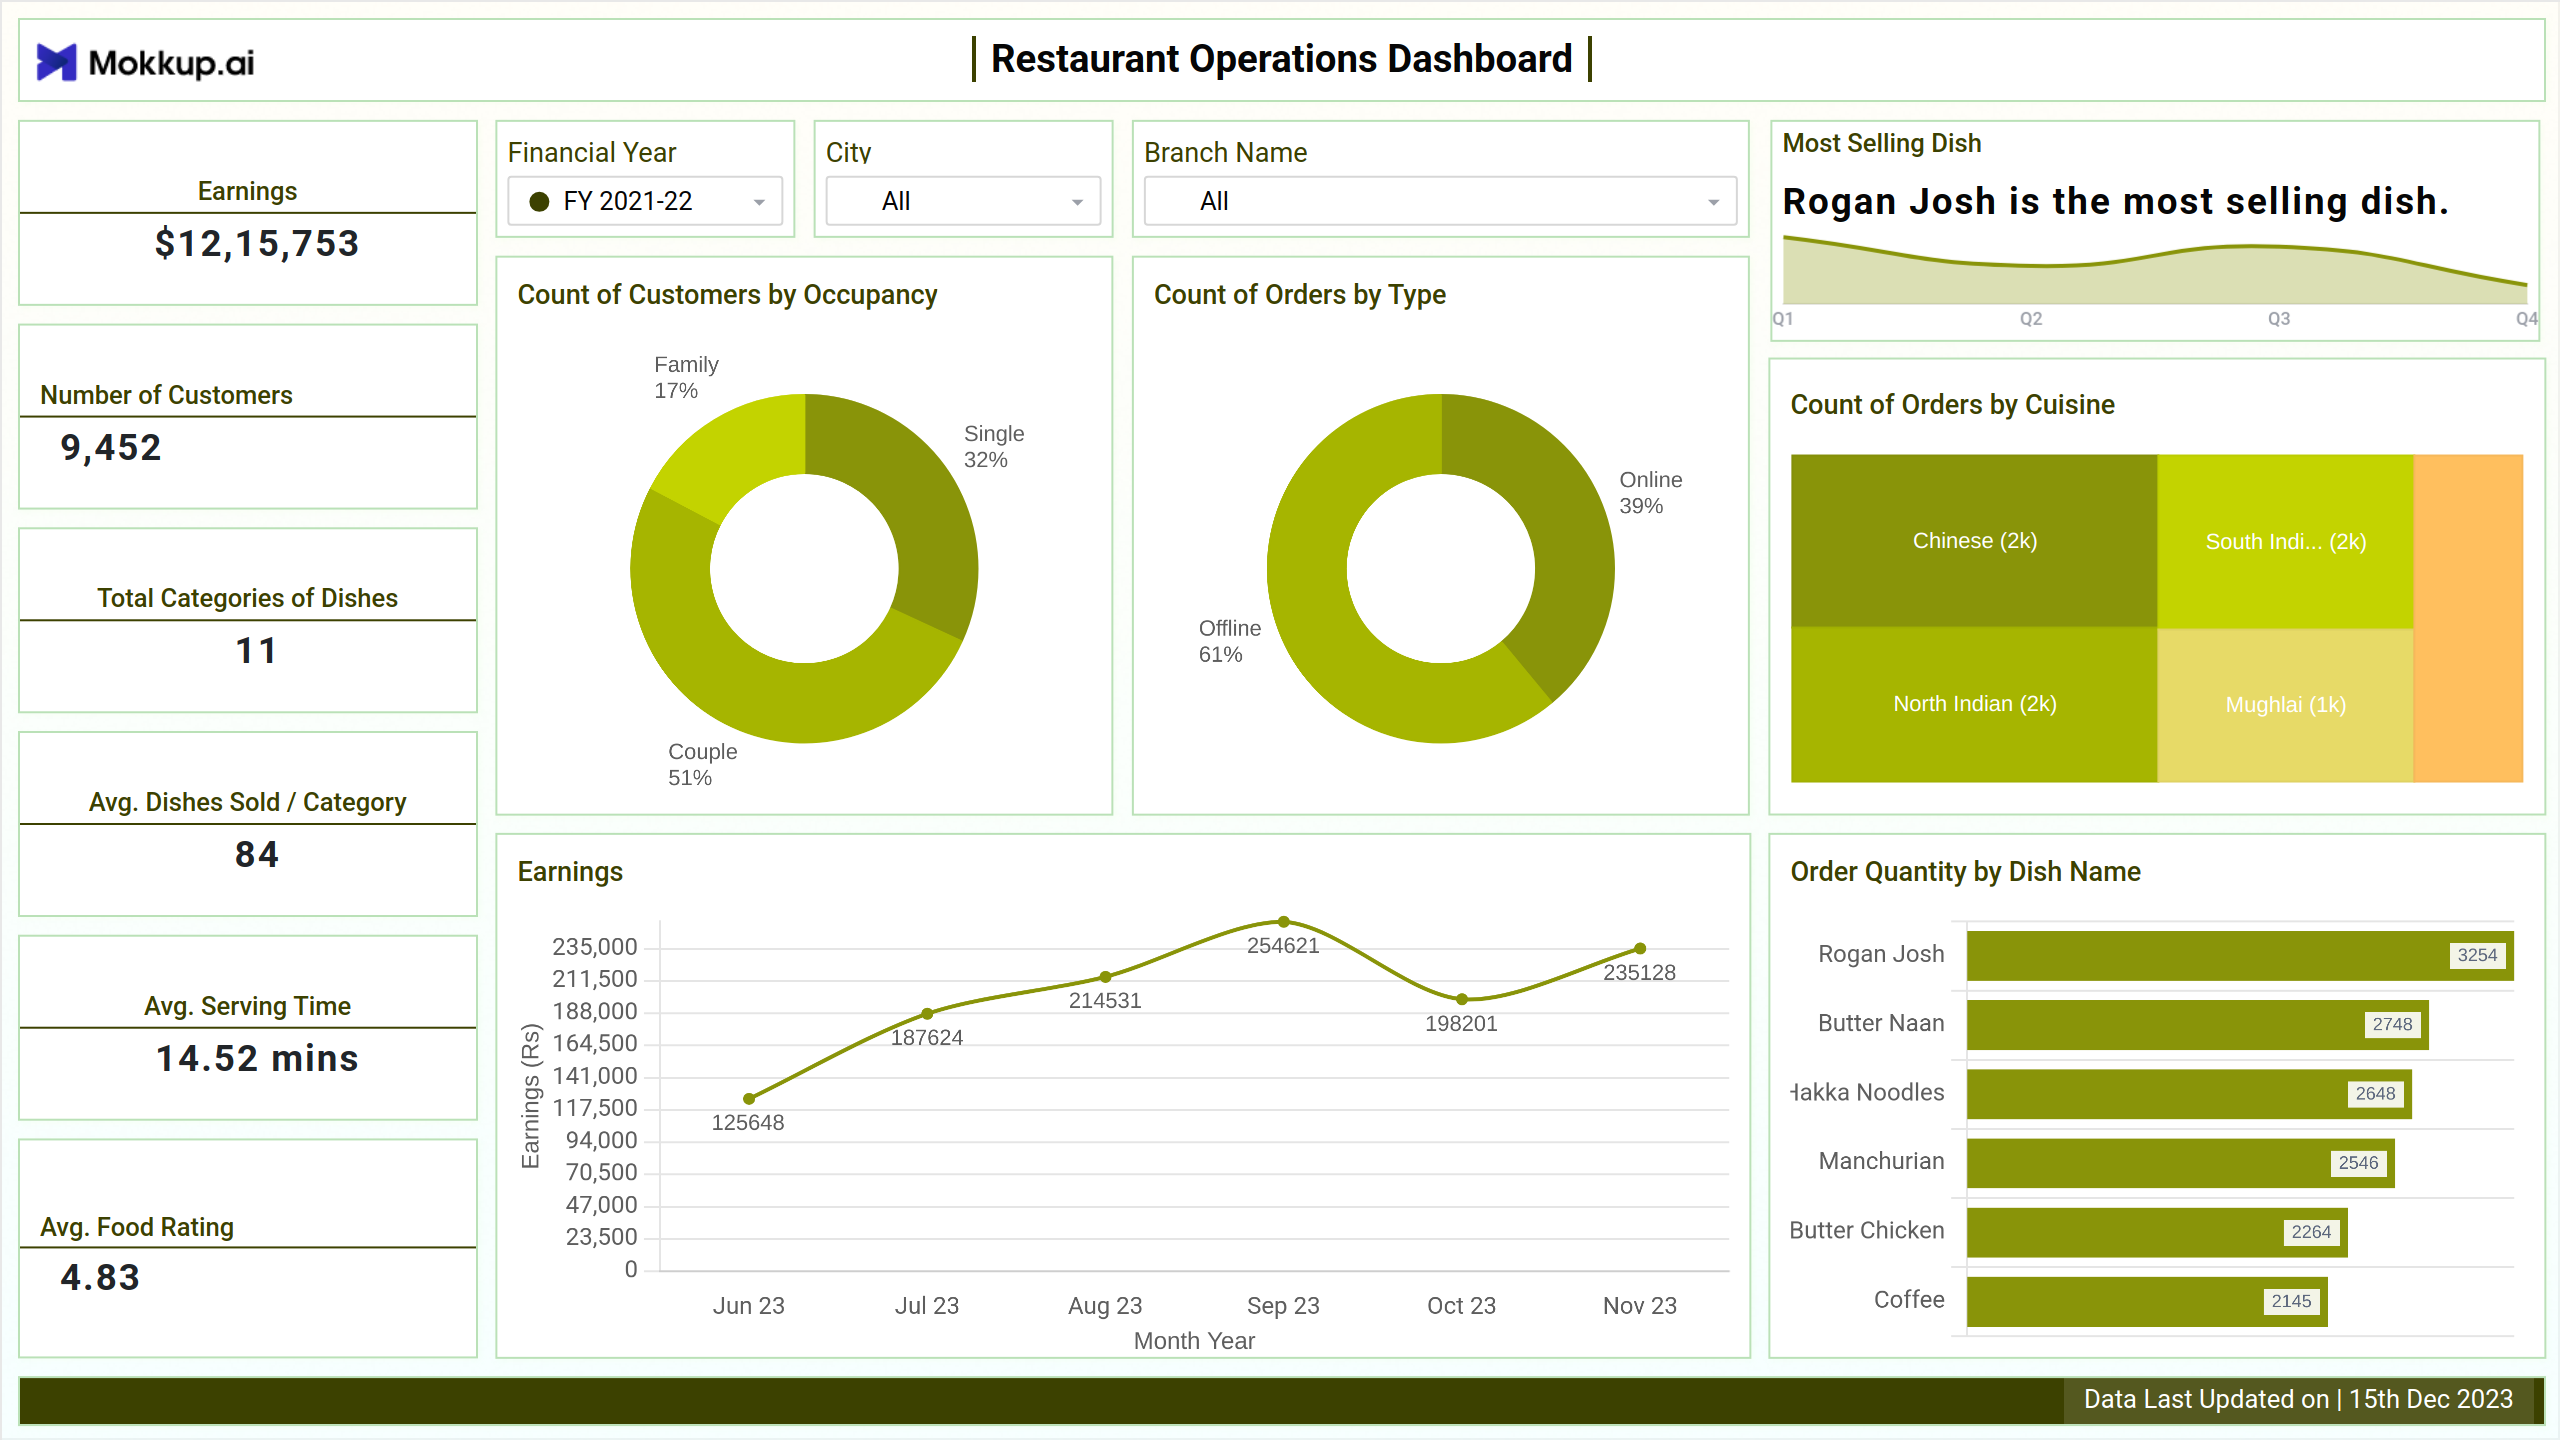
A restaurant operations dashboard template provides a comprehensive view of the restaurant's performance. The dashboard aims to make informed decisions about the operations by accessing data about key performance indicators (KPIs) such as earnings, the most selling dish, average serving time, and more. The dashboard can be specified as per the user's needs and requirements. It can include charts, graphs, and tables that display information like sales, menu item popularity, number of customers, and other essential metrics. The data displayed on the dashboard can help make informed decisions, identify trends, make data-driven decisions, and optimize operations. This helps restaurateurs to monitor and enhance key operational metrics. It streamlines management processes, fostering profitability and customer loyalty in the competitive restaurant industry.
Key Terms to Know
- KPIs: The Key performance indicators (KPIs) provide insights into the various aspects of restaurant management, such as the category of dishes and the dishes being served.
- Treemap: The treemap represents the hierarchical representation of the values similar to the tree diagram.
- Bar Chart: The bar chart represents the demand for the various dishes. The most extended length of the bar represents the highest demand, and the shorter length of the bar represents the lowest demand.
- Line Chart: The line chart represents the monthly earnings trend. The chart depicts the restaurant's earnings margin over various months.
Dashboard Template Insights
This dashboard wireframe, in general, provides valuable insights into the performance and assists restaurant managers in making data-driven decisions to improve customer experience and increase revenue. Among the key insights that can be gained are:
- The sales and revenue data can help determine the most profitable items served by the restaurant to make informed decisions about menu changes and pricing.
- Keeping track of the most in-demand food can help track the inventory levels to improve efficiency and avoid running out of popular items.
- It can help plan the marketing drive based on the type of customers and the orders placed through different mediums.
Conclusion
Restaurant managers can draw several conclusions about their performance by analyzing the data on a restaurant management analysis dashboard. Identify popular dishes, optimize pricing, understand peak times, and track staff performance. This knowledge empowers them to maximize profitability, enhance customer experience, and ensure your restaurant thrives.