
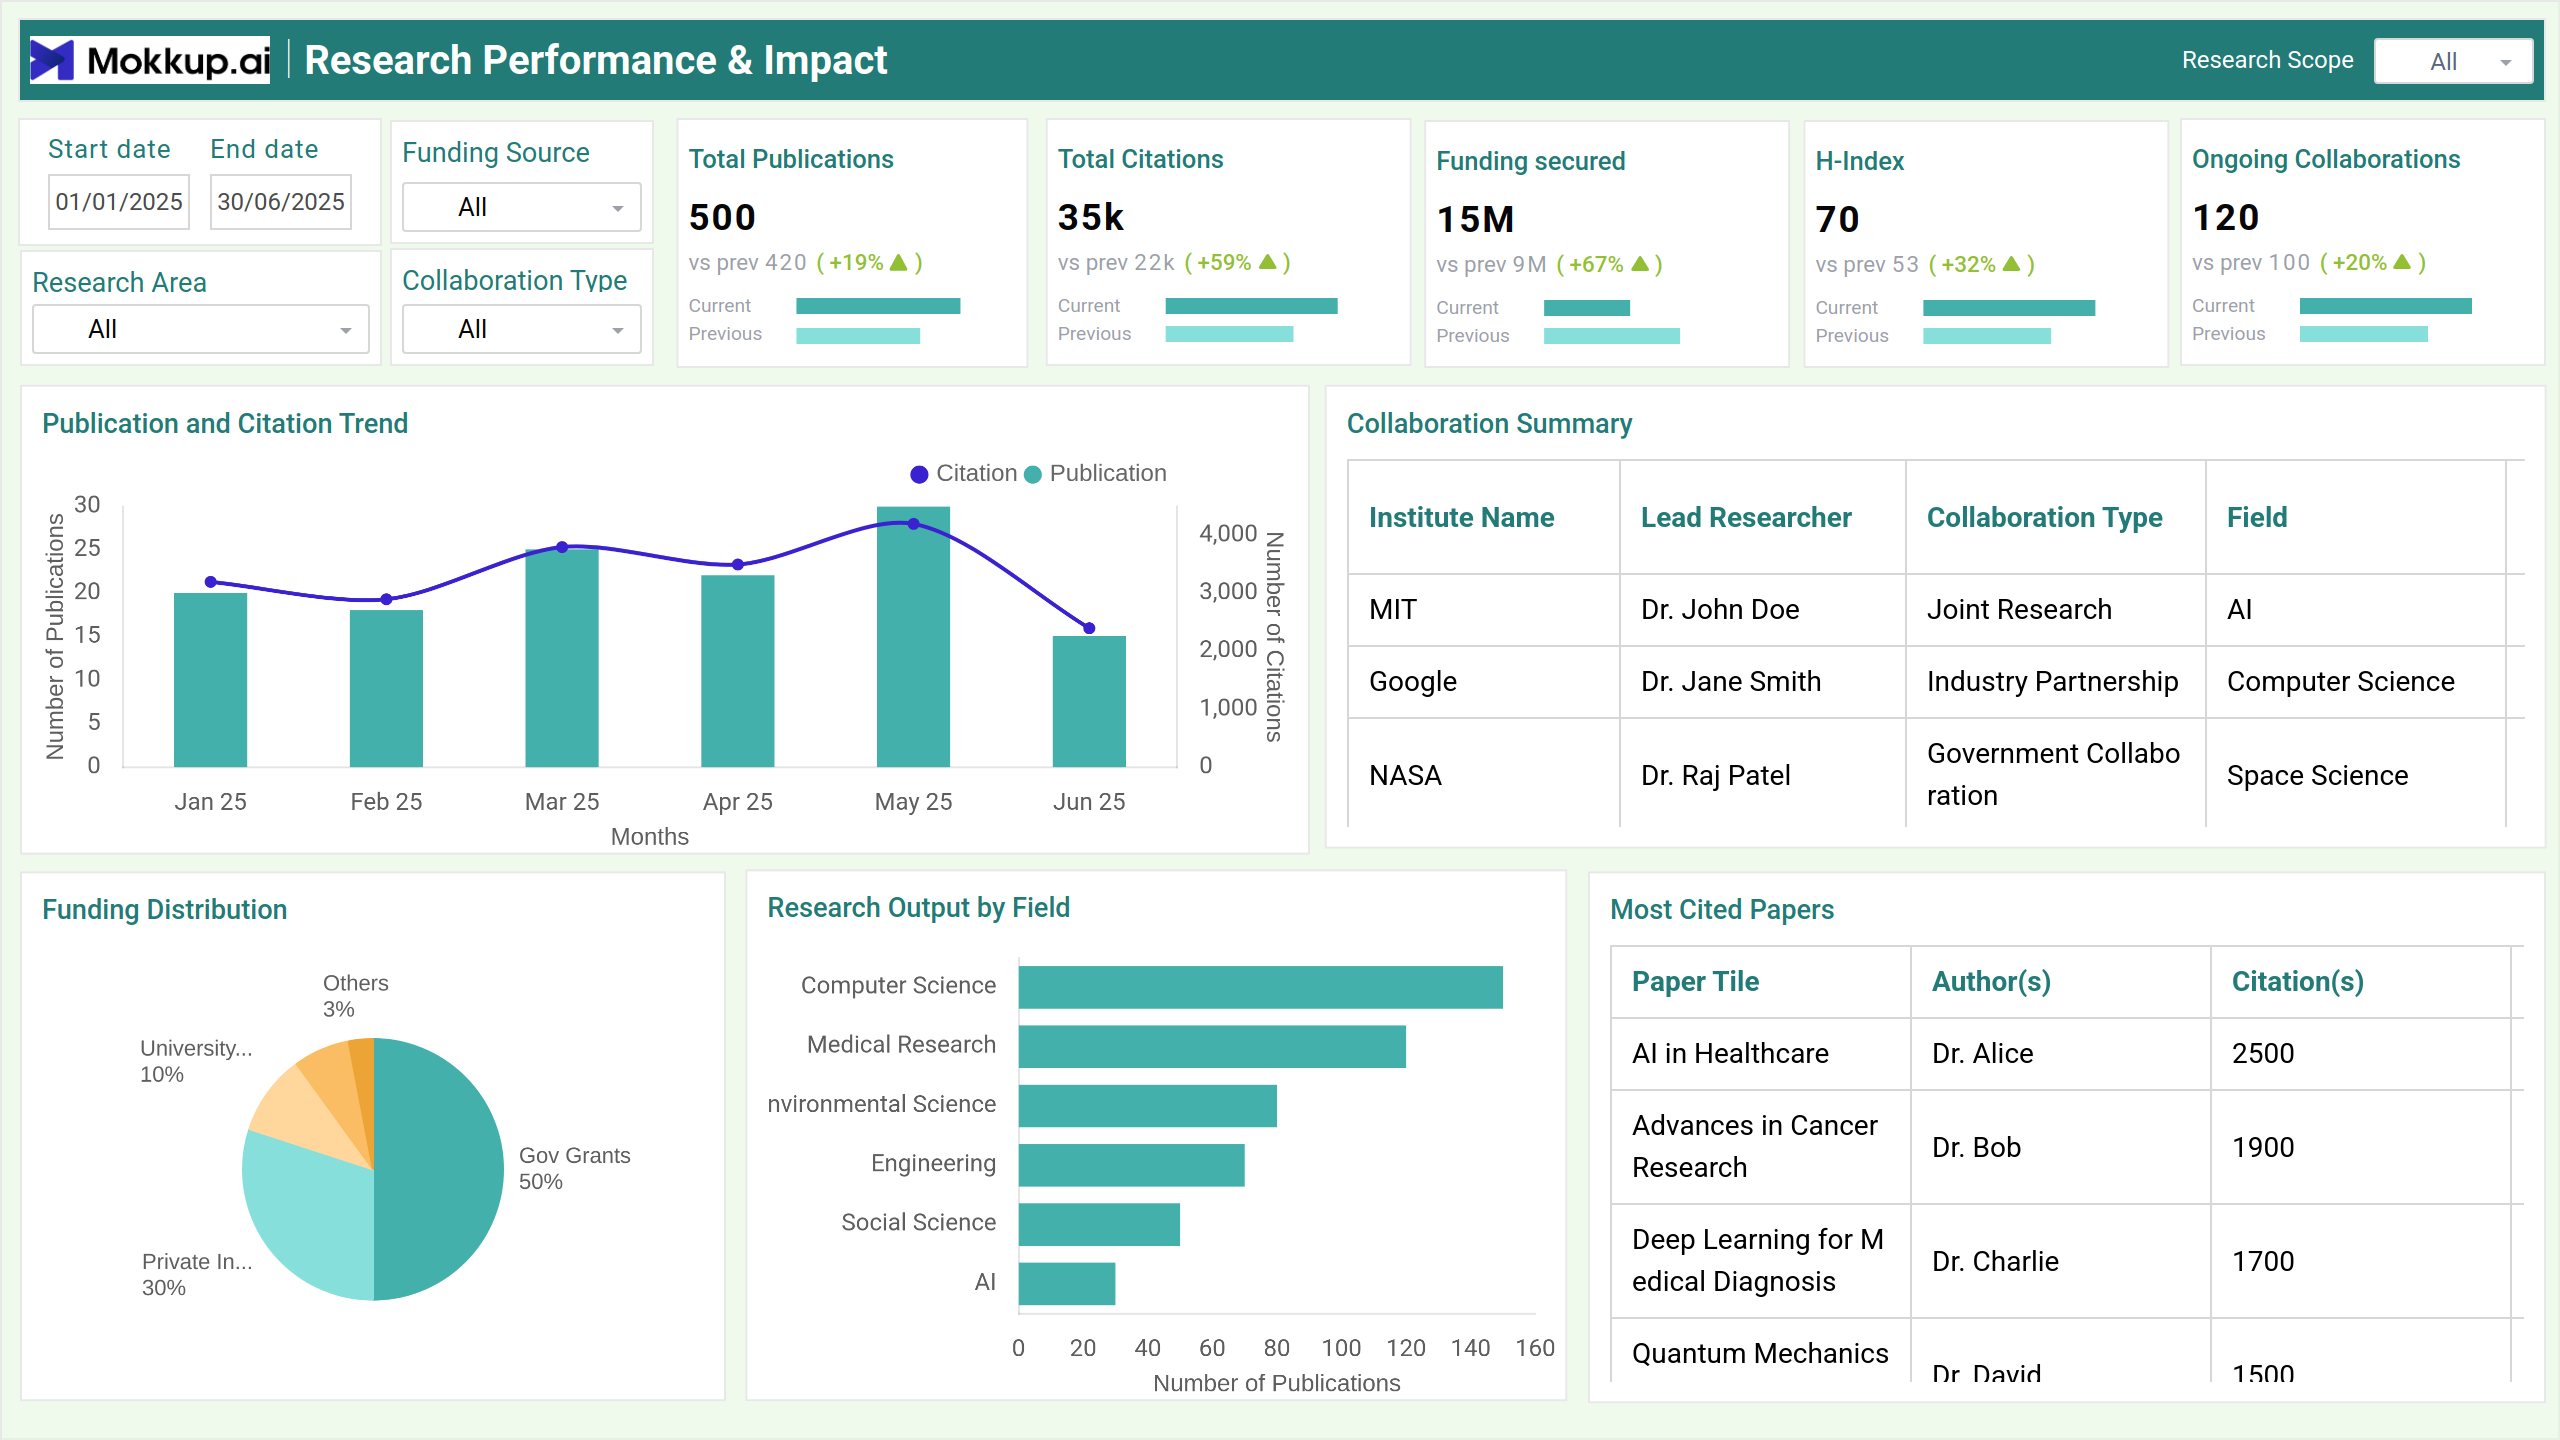
The Researcher Impact & Growth dashboard is a comprehensive template designed to help universities, research institutions, and funding bodies assess research impact, track project success, identify future opportunities, optimize research productivity, secure funding, and foster collaborations. The dashboard wireframe helps decision-makers, enabling them to refine their research strategies, enhance funding acquisition, and drive meaningful academic and scientific advancements.
Research Performance & Impact
This screen provides an overview of a researcher’s contributions and their impact in the academic and scientific community. By analyzing key performance metrics and trends, institutions can assess the effectiveness of their research programs and strategize for greater influence.
- Date Range: Specify the time period for performance analysis.
- Funding Source: Filter based on funding organizations.
- Research Area: Select specific fields of research.
- Collaboration Type: Distinguish between institutional, national, and international collaborations.
- Research Scope: Choose between individual, team, department, or university-level analysis.
- Total Publications: Number of research papers published within the selected period.
- Total Citations: Aggregate citations received across all publications.
- Funding Secured: Total amount of research funding obtained.
- H-Index: Measures the productivity and impact of published work.
- Ongoing Collaborations: Number of active collaborative research projects.
- Publication and Citation Trend: Displays the correlation between research output and citation impact over time.
- Collaboration Summary: Summarizes collaborations across different research areas and institutions.
- Funding Distribution: Illustrates funding allocation across different sources.
- Research Output by Field: Compares research productivity across different disciplines.
- Most Cited Papers: Highlights the top research papers with the highest citations.
Research Project Analysis
This screen evaluates the status and progress of research projects, helping institutions track their success rates, milestones, and challenges. The insights provided support strategic planning and resource allocation.
- Date Range: Select timeframe for project analysis.
- Funding Source: Analyze projects based on their financial backing.
- Research Area: Focus on specific fields of study.
- Project Status: Filter by active, completed, or failed projects.
- Research Scope: Choose analysis at researcher, team, department, or university level.
- Project Type: Filter projects based on funding status (funded/unfunded).
- Active Projects: Number of ongoing research projects.
- Completed Projects: Total projects successfully completed.
- Project Success Rate: Percentage of projects that met their objectives.
- Failed Projects: Number of projects that did not achieve intended outcomes.
- Avg. Project Duration: Average time taken to complete a project.
- Research Area Distribution: Shows the proportion of projects across different research fields.
- Project Phase Breakdown: Displays project distribution across various phases.
- Milestone Progress: Tracks project milestones with an option to select individual projects.
- Reason for Failure: Identifies common reasons for project failures.
- Patent Application and Approval: Visualizes the journey of patent applications from submission to approval.
- Project Details: Provides a detailed view of individual projects, including key metrics and milestones.
Future Opportunities and Growth
This screen helps researchers and institutions identify emerging opportunities, secure funding, and expand collaborations. By tracking upcoming grants, industry trends, and conference invites, stakeholders can align their research strategies for future success.
- Research Scope: Select researcher, team, department, or university level.
- Date Range: Analyze future opportunities within a specific timeframe.
- Funding Range: Filter potential funding sources based on budget.
- Research Area: Focus on relevant fields of study.
- Collaboration Type: Identify opportunities for institutional, industry, or international partnerships.
- Upcoming Grants: Number of grant opportunities available.
- New Collaborators: Potential new research collaborators identified.
- Trending Topic: Shows the Current trending research topic based on publication count.
- Industry Mentions: Frequency of research topics mentioned in industry reports and discussions.
- Conference Invites: Number of conference invitations received.
- Conference Submission Trend: Tracks submission trends with accepted, rejected, and pending applications.
- Collaboration Opportunities: Lists available opportunities for research partnerships.
- Industry Mentions Trend: Displays research mentions in reports, policies, and media.
- Funding Opportunities by Deadline: Shows upcoming funding opportunities sorted by submission deadlines.
- Emerging Research Topics: Highlights trending research topics gaining attention.
Dashboard Template Insights
By using the insights provided by the dashboard wireframe, institutions can strategically enhance their research efforts and growth potential.
- Monitoring these trends helps assess the impact and outreach of research efforts.
- Understanding research collaborations aids in fostering strategic partnerships.
- Insights into funding trends help researchers optimize their grant application strategies.
- Identifying reasons for project failures can improve future project planning and execution.
- Keeping track of funding and collaboration prospects ensures continued research innovation and development.
Conclusion
The Researcher Impact & Growth dashboard template empowers researchers and institutions with data-driven insights to enhance productivity, impact, and future opportunities. By systematically tracking key research metrics, institutions can make informed decisions to drive innovation, secure funding, and expand their research influence globally.