
What is a Realty Performance Analysis Dashboard?
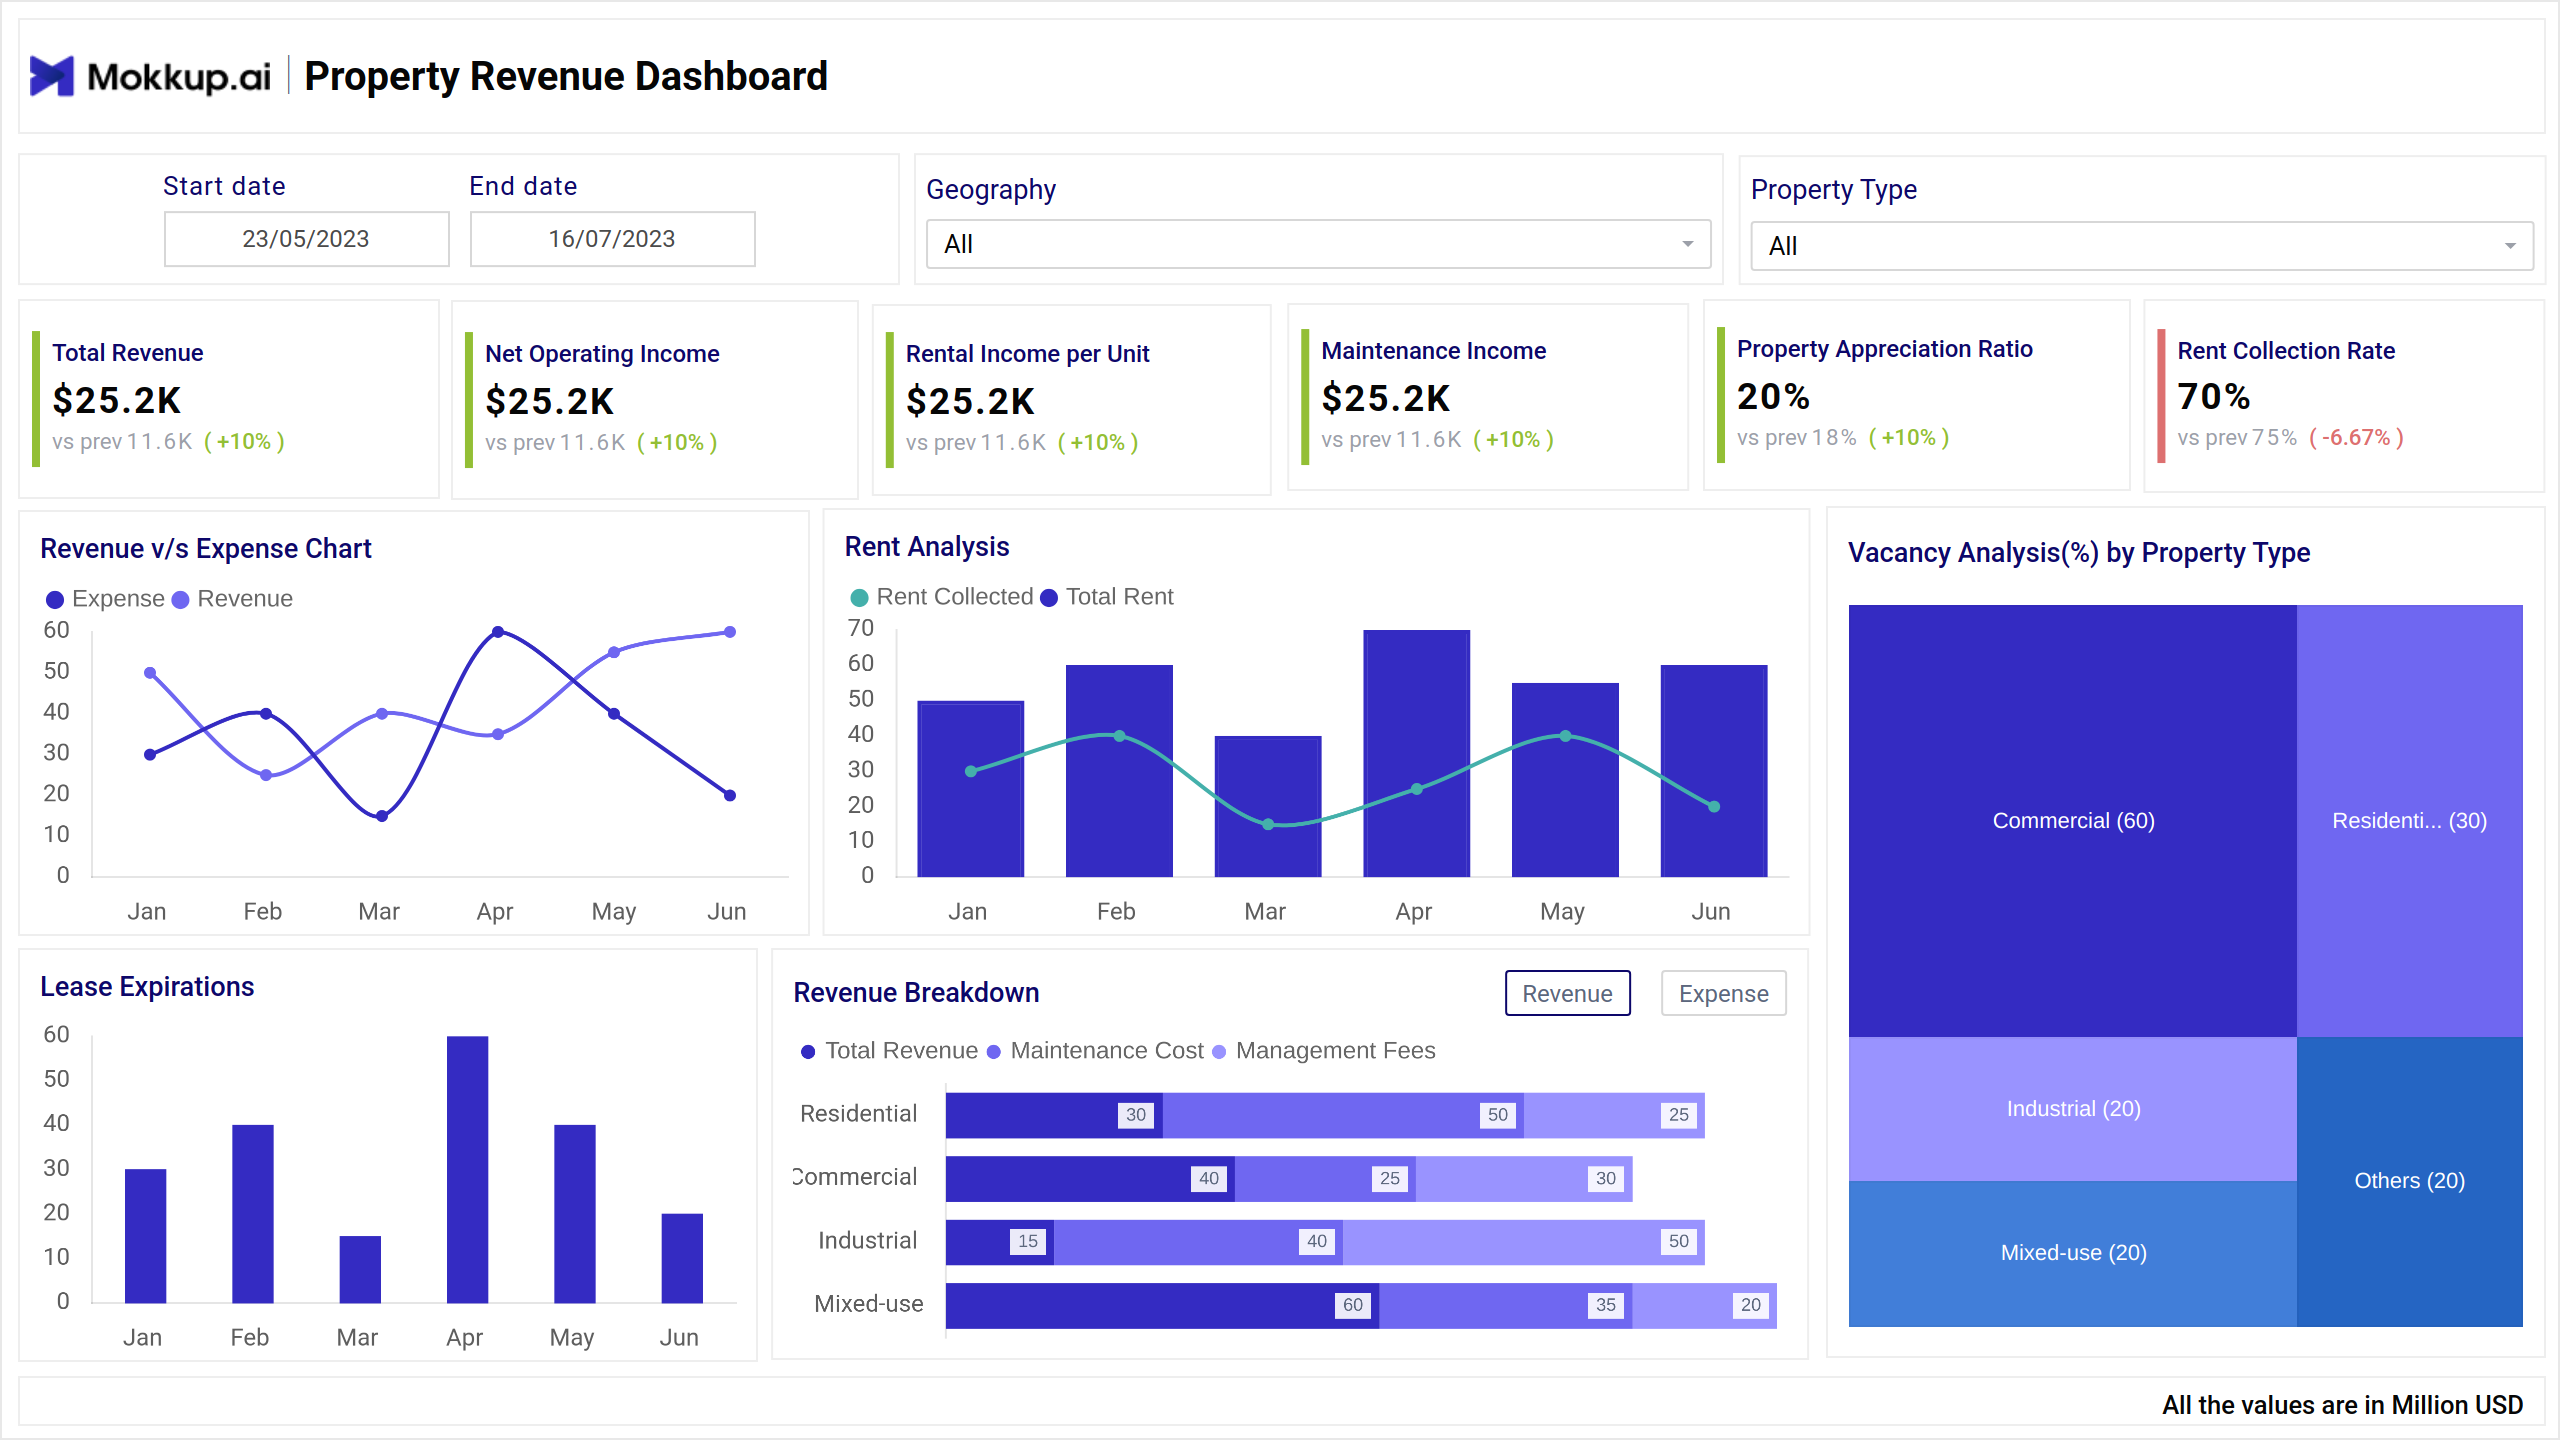
The Realty Performance Analysis Dashboard template provides insights into revenue performance, rental income, property appreciation, and vacancy trends. It allows users to analyze property metrics and trends over a defined date range, geography, and property types.
Real Estate Performance Dashboard Example
The Realty Performance Analysis Dashboard template gives property managers and real estate analysts a clear view of financial and operational performance across properties. Ideal for property management professionals, leasing teams, and portfolio analysts, this dashboard wireframe helps monitor occupancy rates, analyze market trends, and make informed decisions to maximize returns and manage property portfolios effectively.
How to Analyze Data in Real Estate Dashboards
To evaluate Mokkup.ai real estate dashboard, focus on key performance metrics like revenue, rent trends, and property appreciation. The dashboard wireframe provides visual insights filtered by date, region, and property type to support better investment decisions.
- Analyze total revenue, rental income per unit, and net operating income. Visual comparisons of revenue vs. expenses highlight profitability over time.
- Use filters for geography and property type to assess rent collection rates, lease expirations, and maintenance income. Track property appreciation and monitor vacancy rates with visual breakdowns by category.
How to Create a Real Estate Performance Dashboard
You don’t need to build your report from scratch—just start with a ready-to-use sample Realty Performance Analysis Dashboard template from Mokkup. Add in your data and export it however you like. Here’s how to do it:
1. Create or Log in to Your Mokkup Account
Start by signing up on Mokkup.ai using your email. Already have an account? Just log in, and you’re good to go.
2. Choose and Customize Your Dashboard Template
Find the Realty Performance Analysis Dashboard in the Templates section. Use the drag-and-drop editor to adjust KPIs, edit filters, or add elements based on your data.
3. Export to Your BI Tool
Once your dashboard wireframe is ready, use the BI Tool Export feature to send it directly to Power BI or Tableau for further analysis and enhancements. You can also download the dashboard as a PDF, PNG, or JPEG, embed it on a platform, or invite your team to collaborate.
Note: This is a Pro template. To use and customize this dashboard wireframe, you’ll need a Pro subscription on Mokkup. Upgrade anytime to unlock full access.
Benefits of Realty Performance Dashboards
Realty Performance Dashboards help property managers, investors, and leasing teams stay on top of financial, occupancy, and market performance. By consolidating real estate KPIs into one view, they support smarter decision-making and efficient portfolio management.
- Improved Portfolio Oversight: Monitor rental income, property appreciation, and occupancy rates across multiple properties in real time.
- Faster Decision-Making: Visual insights into property performance help identify profitable opportunities and underperforming assets quickly.
- Better Vacancy Management: Track vacancy trends to optimize tenant acquisition strategies and reduce income loss.
- Revenue Trend Analysis: Evaluate revenue patterns over time to make informed pricing and investment decisions.
- Customizable Filtering: Segment data by property type, region, or timeframe for granular analysis and targeted actions.
These dashboards centralize complex data into a clear, visual format, making performance tracking more intuitive.
KPIs to Track in Realty Dashboards
The investment property dashboards provide key financial and operational metrics to help property managers and investors assess the health and profitability of their real estate portfolios. Here are essential KPIs to include:
- Total Revenue: Displays the overall income generated from all properties, including rent, maintenance, and other services.
- Net Operating Income (NOI): Represents the profit after deducting operating expenses, offering a true measure of property profitability.
- Rental Income per Unit: Shows the average rental income earned per unit, helping compare performance across properties or time periods.
- Maintenance Income: Tracks revenue earned from property maintenance services, which may include repairs or facility fees.
- Property Appreciation Ratio: Measures the increase in property value over time, helping assess long-term investment returns.
- Rent Collection Rate: Indicates the percentage of rent collected out of the total due, reflecting tenant payment reliability and cash flow health.
Frequently Asked Questions
Q1. What does a Realty Performance Dashboard track?
It tracks total revenue, rental income, net operating income, property appreciation, and vacancy rates to evaluate property performance and profitability.
Q2. Who uses a real estate dashboard?
Property managers, real estate investors, and financial analysts use the dashboard to monitor portfolio health, rental trends, and operational efficiency.
Q3. How does the dashboard help improve decision-making?
The dashboard supports data-driven decisions on investments and property management by offering real-time, visual insights into rent collection, lease expirations, and regional trends.