What is a Public Health Safety Report
The public safety dashboard template provides an overview of essential public health and safety metrics. It enables organizations and policymakers to monitor health trends, assess safety measures, and address potential risks proactively. With insights into key areas such as disease prevalence, vaccination coverage, emergency response times, and environmental health factors, this template supports data-driven decision-making to safeguard community well-being.
How to Create a Public Health Safety Dashboard
You don’t need to start from scratch—simply use a ready-made dashboard template from Mokkup. Input your data and export it in your preferred format. Here’s how:
1. Create or Log in to Your Mokkup Account
Sign up on Mokkup.ai using your email address. Existing users can log in directly.
2. Choose and Customize Your Dashboard Template
Navigate to the Templates section and select the Public Health Safety Dashboard. Use the drag-and-drop editor to modify KPIs, adjust filters, or add new visual elements based on your data.
3. Export to Your BI Tool
Once your dashboard wireframe is ready, use the BI Tool Export feature to transfer it to Power BI or Tableau for deeper analysis. You can also download it as a PDF, PNG, or JPEG, embed it on a website, or invite colleagues to collaborate.
Note: This is a Pro template. You’ll need a Pro subscription on Mokkup to use and customize this dashboard wireframe. Upgrade anytime to unlock full access.
Public Health Safety Dashboard Example
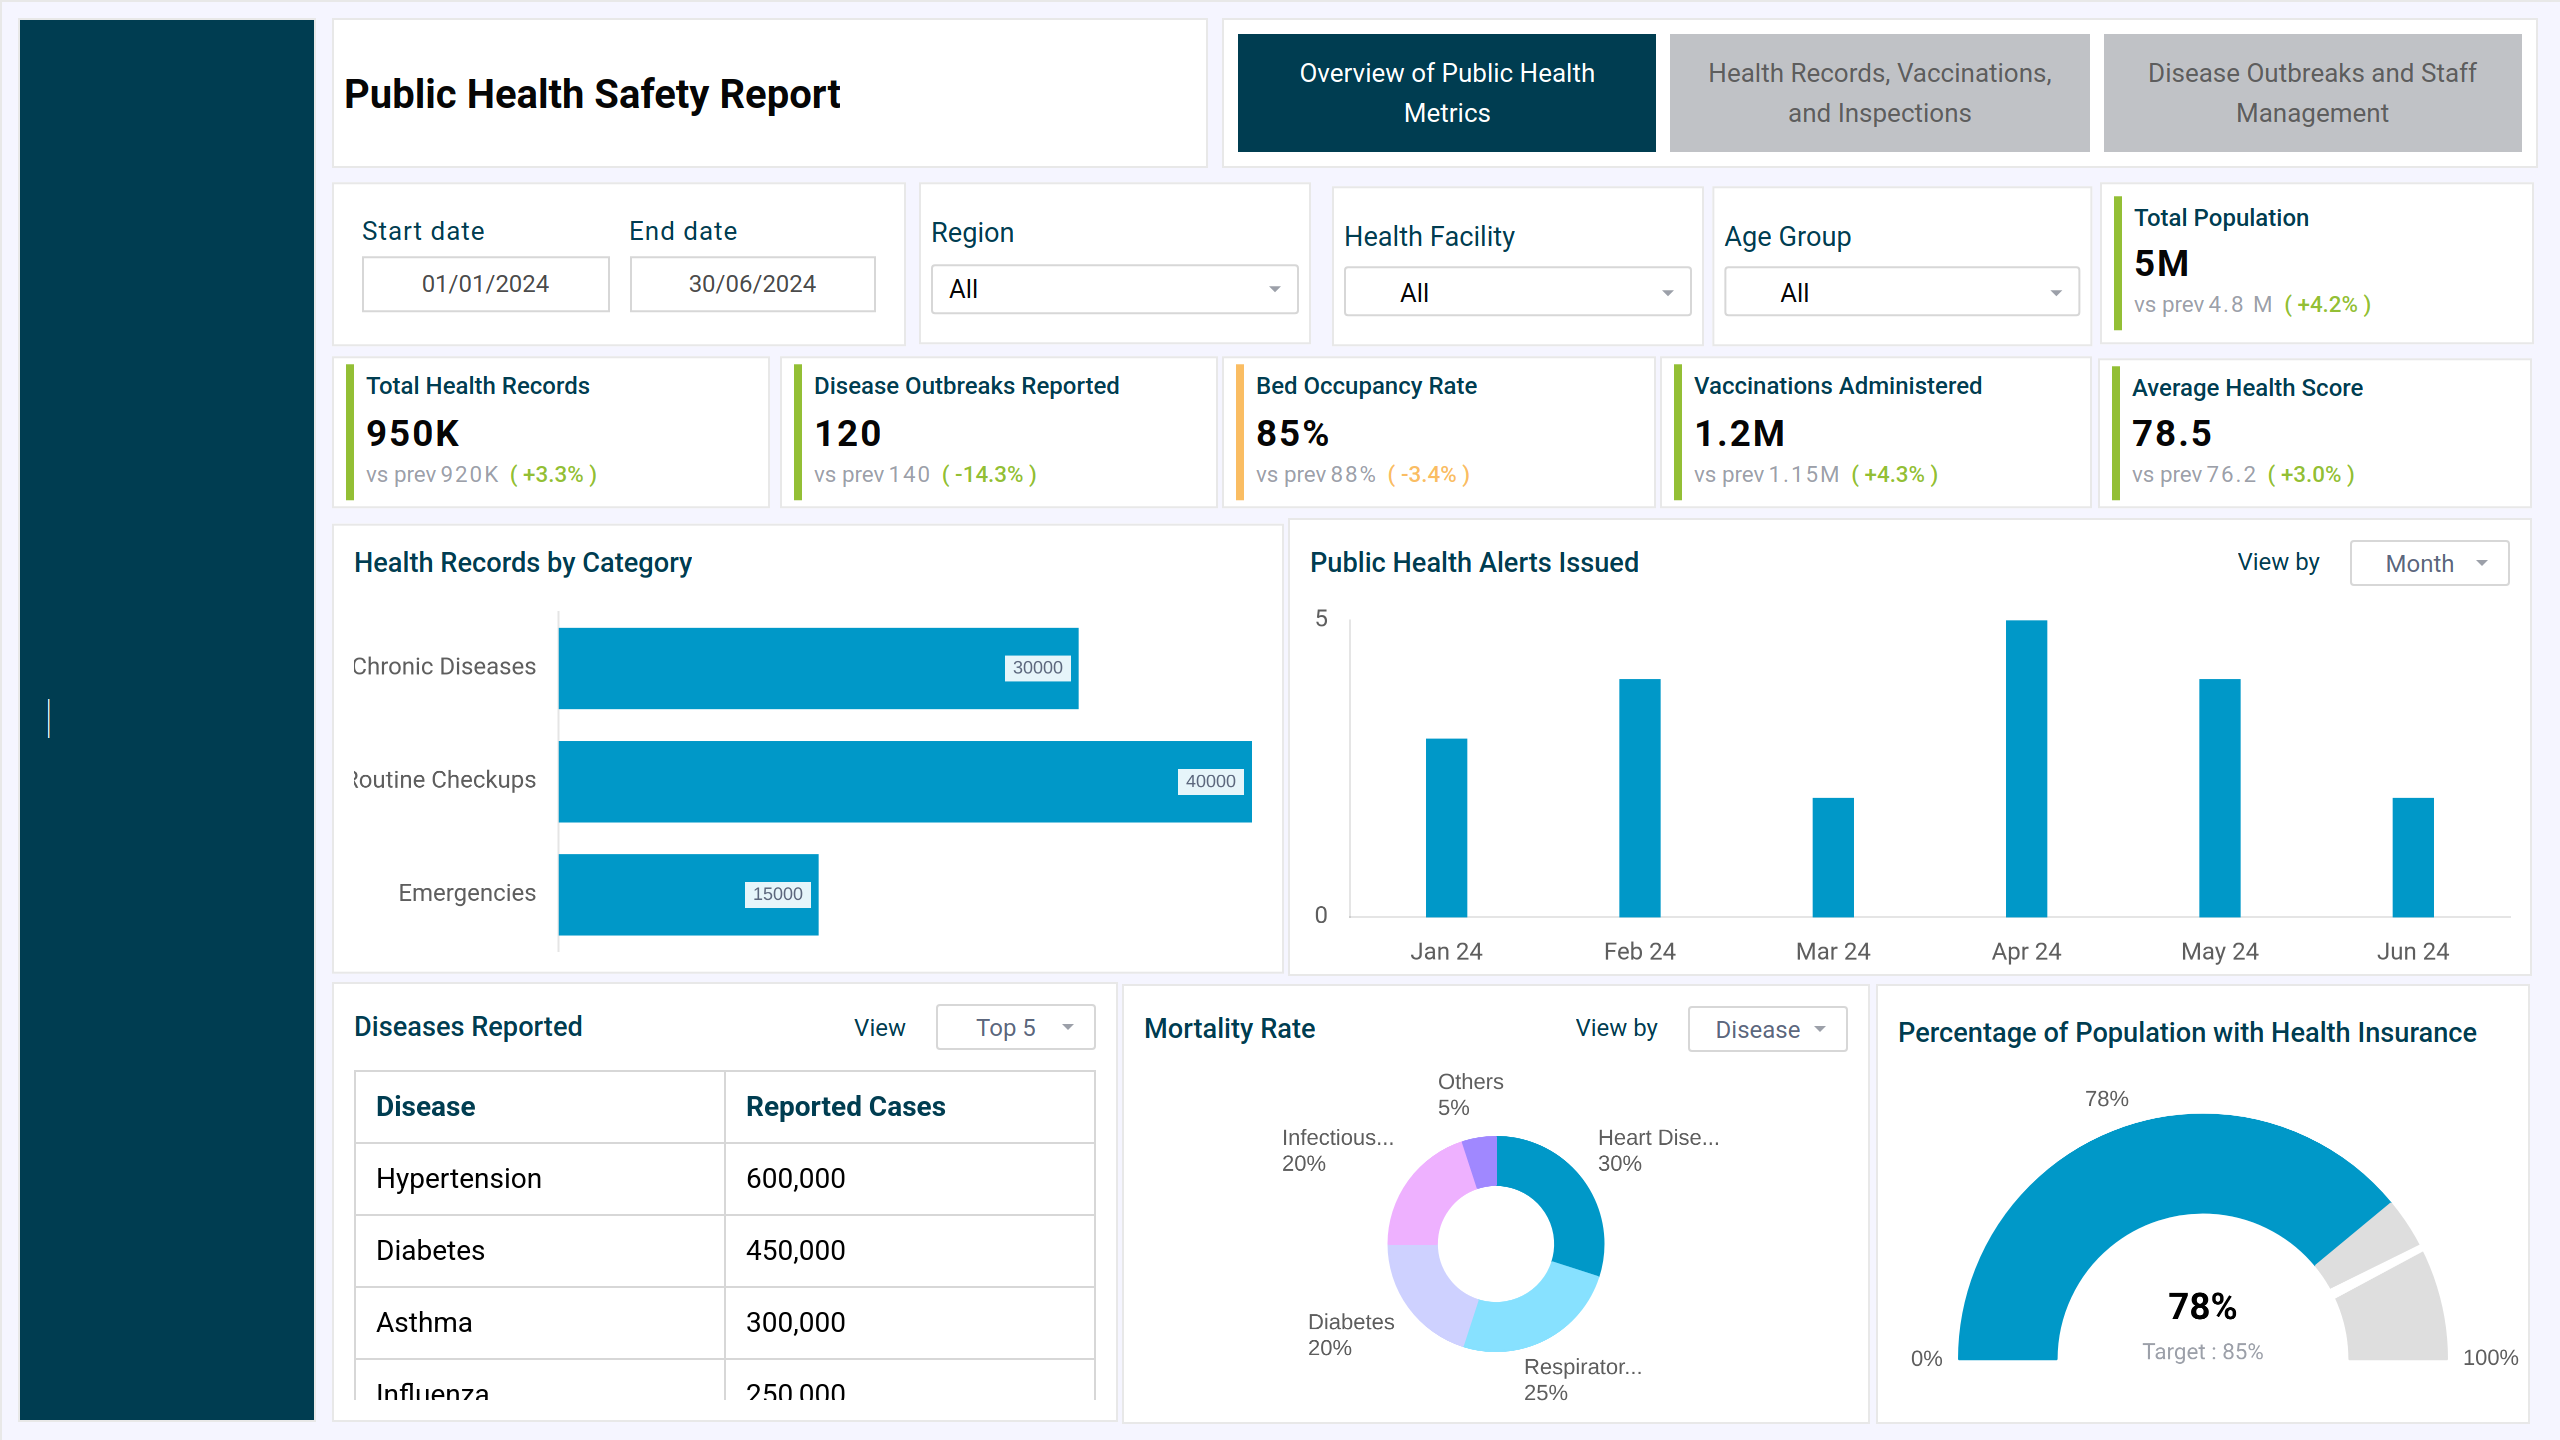
Mokkup has designed the public safety analytics dashboard to monitor and analyze critical data related to essential health metrics, including vaccine tracking, disease outbreaks, inspections, and health record management. The dashboard typically features a clean and organized layout, with key metrics displayed through charts, maps, and tables for easy understanding. Customizable elements allow users to tailor the display based on specific needs, such as adjusting time frames, geographic regions, or the type of incidents to track. Filters enable users to drill down into particular categories, like crime type or emergency response, by different regions or times of day.
How to Analyze Data in Public Safety Dashboards
This is the best public safety dashboard, which uses a systematic approach to uncover patterns, assess performance, and guide decision-making. You can start analyzing data in this dashboard by applying filters and tracking trends over time with line graphs.
You can also:
- Use heat maps to identify crime or accident hotspots.
- Compare KPIs like response times, incident volume, or resolution rates against goals or historical data.
- For detailed insights, drill down into specific categories (e.g., crime types, time of day).
- Identify anomalies such as sudden spikes or drops that may indicate new issues or improvements.
Benefits of Public Safety Dashboards
This dashboard can be also be deemed as emergency services dashboard used by public health organizations for a range of benefits like:
Real-time monitoring of incidents for quicker and more effective response.
- Improved resource allocation based on data-driven insights.
- Trend analysis to identify patterns in crime, accidents, or emergency calls.
- Proactive risk management by pinpointing high-risk areas and times.
- Better strategic planning with visualized data aiding long-term safety initiatives.
- Increased situational awareness for law enforcement and emergency services.
You can also see the drug distribution dashboard for monitoring and managing drug distribution across regions, facilities, or retail points.
KPIs to Track in Public Safety Dashboards
Here are key metrics that you can track with this community safety dashboard:
- Total Users: the total number of people covered in the health system.
- Total Health Records: Determines the database's total number of health records.
- Vaccines Administered: This shows the total number of vaccines provided.
- Active Disease Outbreaks: This is the number of ongoing disease outbreaks.
- Inspections Completed: Monitors the number of health and safety inspections conducted.
- Vaccination Records By Vaccine Type: A pie chart showing vaccination distribution across several vaccine types.
- Health Records by Category: A horizontal bar chart divides health records into three categories: chronic conditions, routine checkups, and emergencies.
- Inspections vs. Health Records Over Time: A column containing a line chart comparing the number of inspections and health records.
- Vaccination Trend Over Time: A line chart that shows the trend of vaccinations administered over time.
FAQs
1. Who prepares public health safety reports?
These reports are typically prepared by government health departments, public health agencies (e.g., CDC, WHO), hospitals, or academic institutions engaged in health surveillance and epidemiological research.
2. What kind of data is typically visualized in dashboards?
You can visualize data points like case counts and mortality rates, geographic spread (heatmaps or choropleth maps), hospitalization and ICU capacity, vaccination progress, air/water quality levels, and food safety alerts or recall information.