
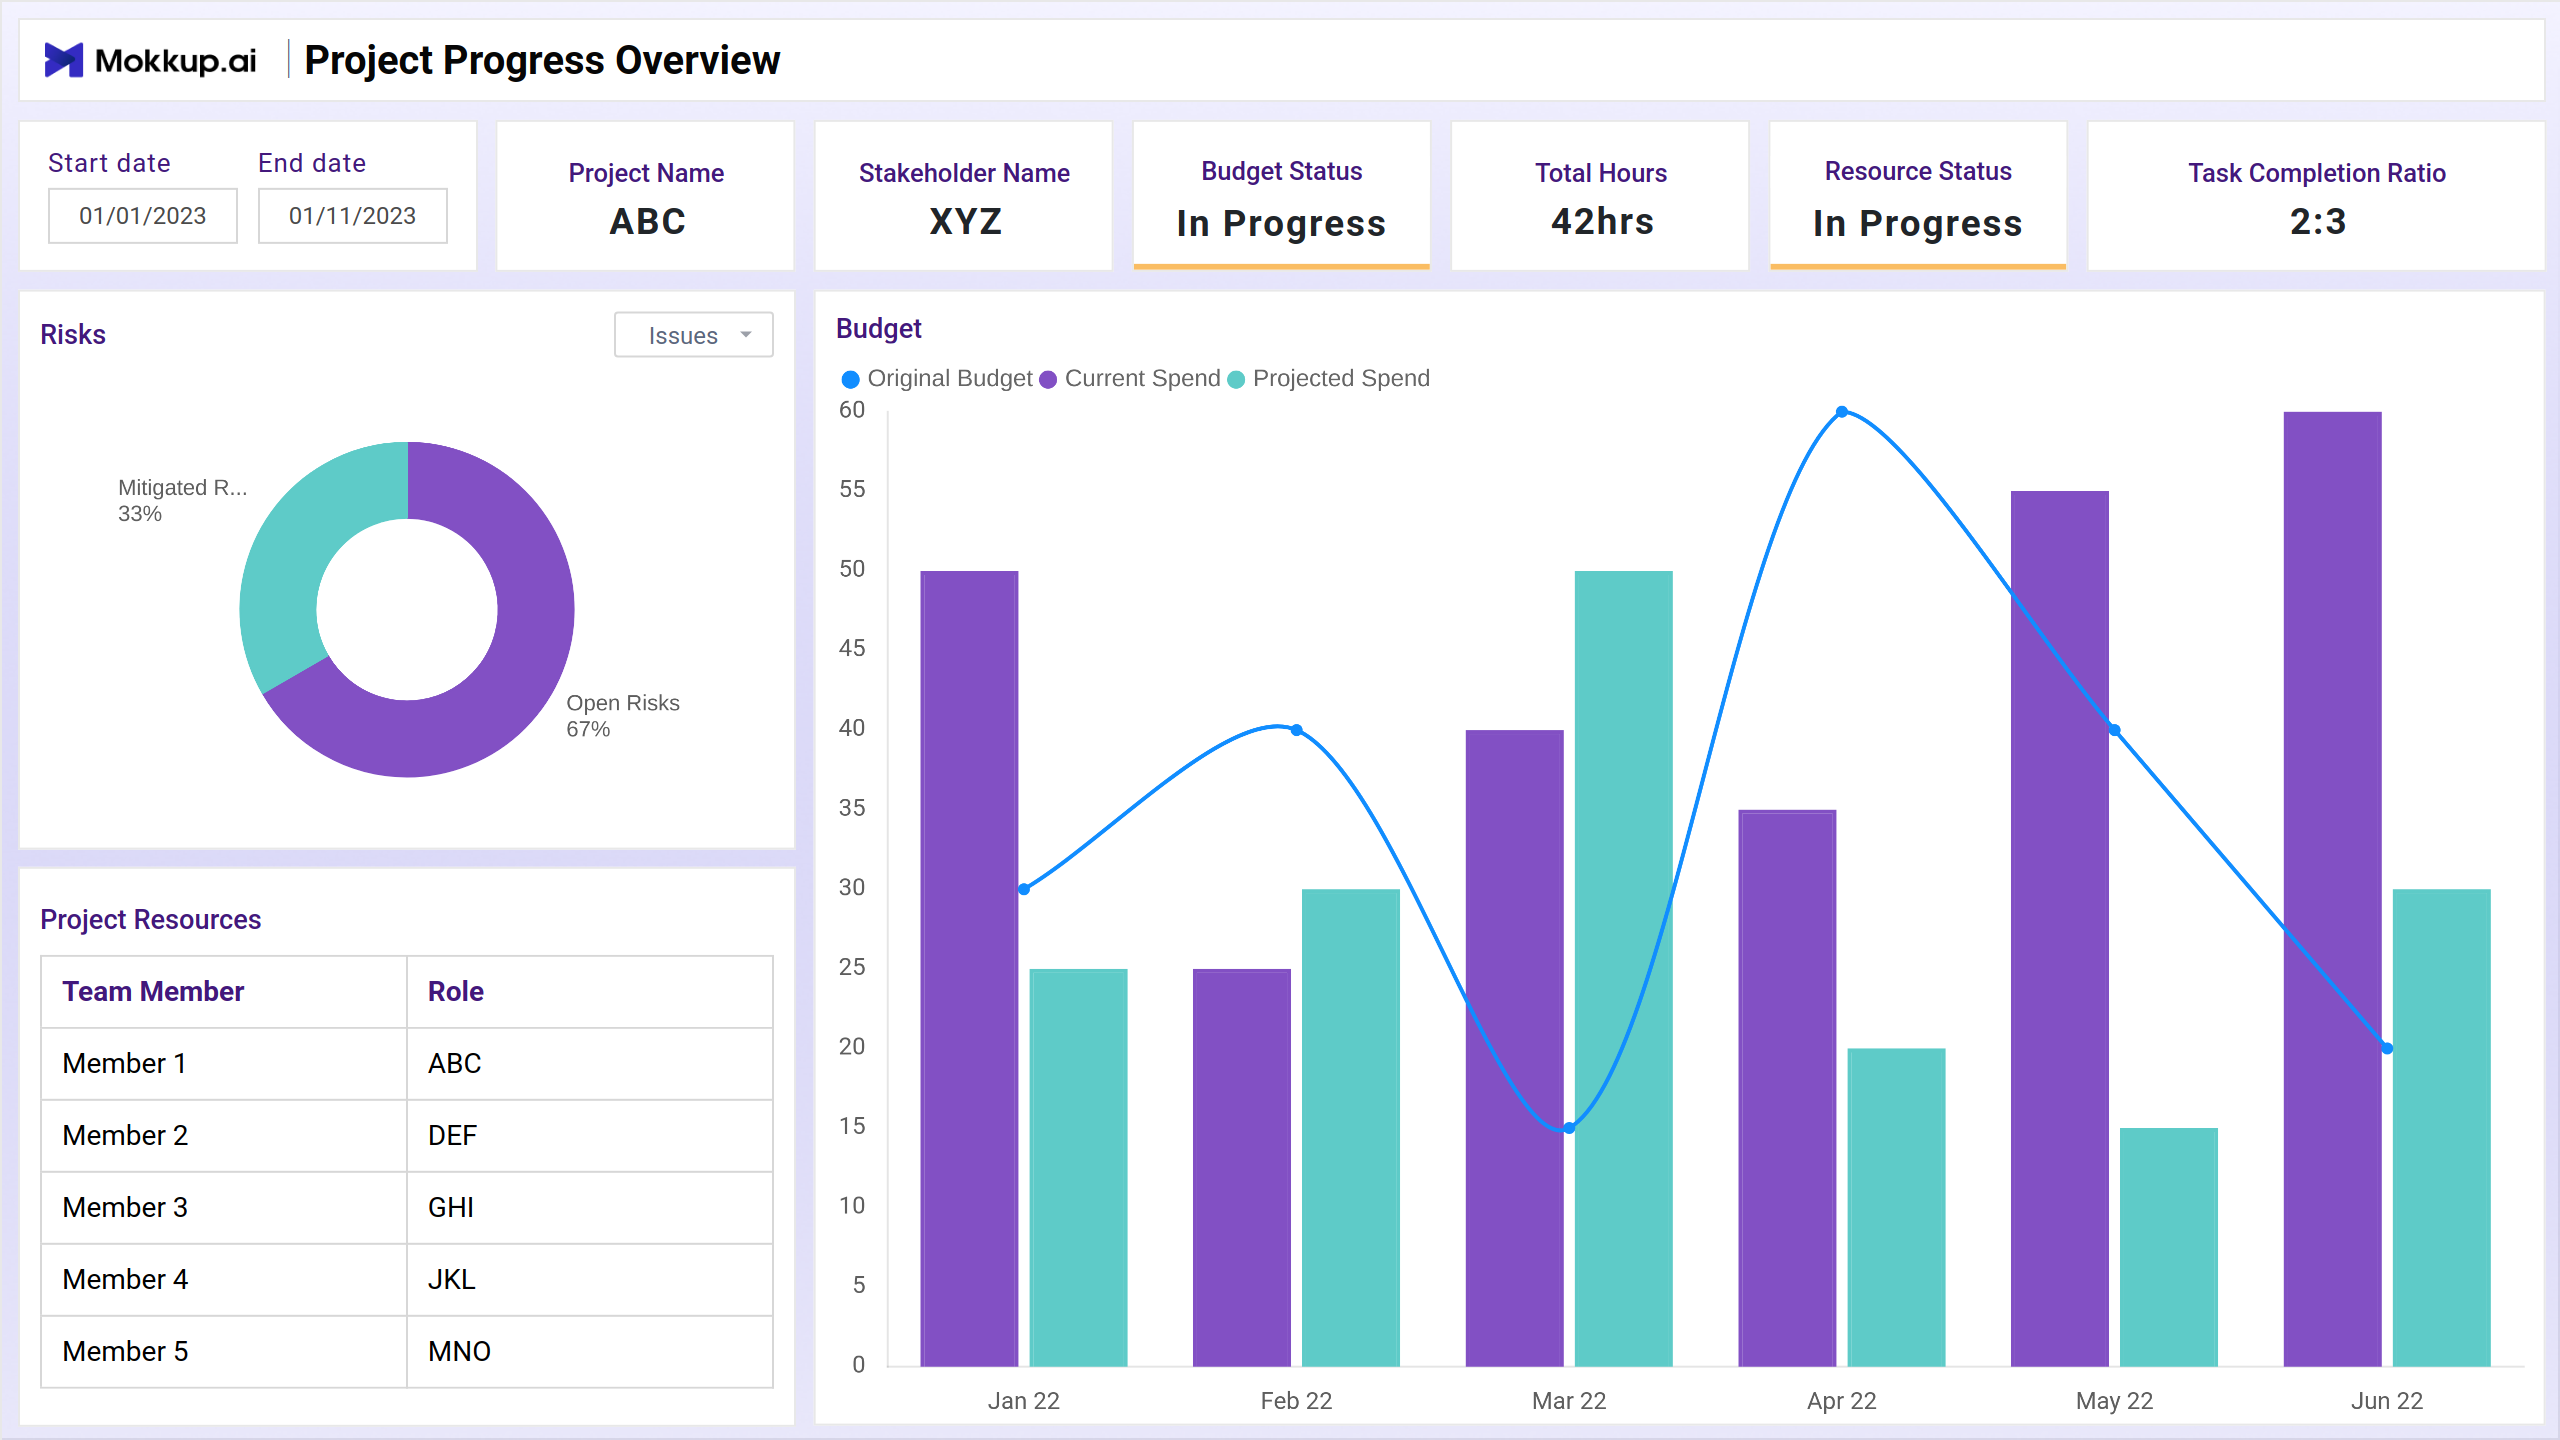
It is a comprehensive dashboard for effective project management. It offers insights into ongoing projects' progress, including Project Name, Overall Product Status, Projected End Date, and Key Achievements. Additionally, detailed metrics on Project Resources, Task Completion Ratio, Budget, Immediate Tasks List, Error Rate, and Satisfaction Score empower managers to make informed decisions and ensure project success.
Screen 1: Summary
This screen is the central hub for monitoring ongoing projects' progress and key aspects. Here, essential information such as the Project Name, which identifies the specific project under review and the Overall Product Status, provides insights into the current stage of product development. The Projected End Date also offers a forecast for the completion timeline, while Key Achievements highlight noteworthy milestones and accomplishments within the project's journey.
Key Terms to consider:
- Project Name: Identifies the specific project being referenced.
- Overall Product Status: Indicates the current status of the project's overall product development.
- Projected End Date: Forecasts the expected completion date of the project.
- Key Achievements: Highlights significant milestones or accomplishments within the project.
Screen 2: Overview
This is a comprehensive screen for tracking vital project metrics. Project Resources section identifies the personnel, equipment, and materials allocated to the project. Task Completion Ratio provides insights into progress by measuring completed tasks against the total planned. Additionally, the Budget section details allocated funds, ensuring financial oversight throughout the project lifecycle.
Key Terms to consider:
- Project Resources: Identifies the available personnel, equipment, and materials allocated to the project.
- Task Completion Ratio: Measures the proportion of tasks completed compared to the total number of tasks planned.
- Budget: Specifies the allocated funds or financial resources for the project's execution.
Screen 3: Performance
This screen is designed to keep one informed and proactive in managing your projects effectively. The Immediate Tasks List offers a quick overview of tasks needing immediate attention, ensuring timely resolution. The Error Rate metric quantifies discrepancies within processes or systems, allowing for swift corrective action. Additionally, the Satisfaction Score measures stakeholder contentment, providing insights into project performance and client satisfaction.
Key Terms to consider:
- Immediate Tasks List: Provides a concise list of tasks that require immediate attention or action.
- Error Rate: Quantifies the frequency or percentage of errors occurring within a specific process or system.
- Satisfaction Score: Measures the level of satisfaction or contentment among stakeholders, users, or customers regarding a product or service.
Dashboard Template Insights
The Project Status Dashboard provides a comprehensive overview of ongoing projects, offering essential insights to facilitate effective project management. Screen 1 serves as the central hub, presenting key project aspects such as Project Name, Overall Product Status, Projected End Date, and Key Achievements.
Screen 2 offers a detailed overview of vital project metrics, including Project Resources, Task Completion Ratio, and Budget, ensuring efficient resource allocation and financial oversight. Screen 3 enhances proactive project management with features like the Immediate Tasks List, Error Rate, and Satisfaction Score, enabling timely resolution of issues and ensuring stakeholder satisfaction. Together, these screens provide a holistic view of project progress, facilitating informed decision-making and successful project outcomes.
Conclusion
The Project Status Dashboard provides a comprehensive toolkit for effective project management. With insights into progress, resource allocation, and stakeholder satisfaction across its screens, it equips managers to make informed decisions and ensure successful project outcomes.