
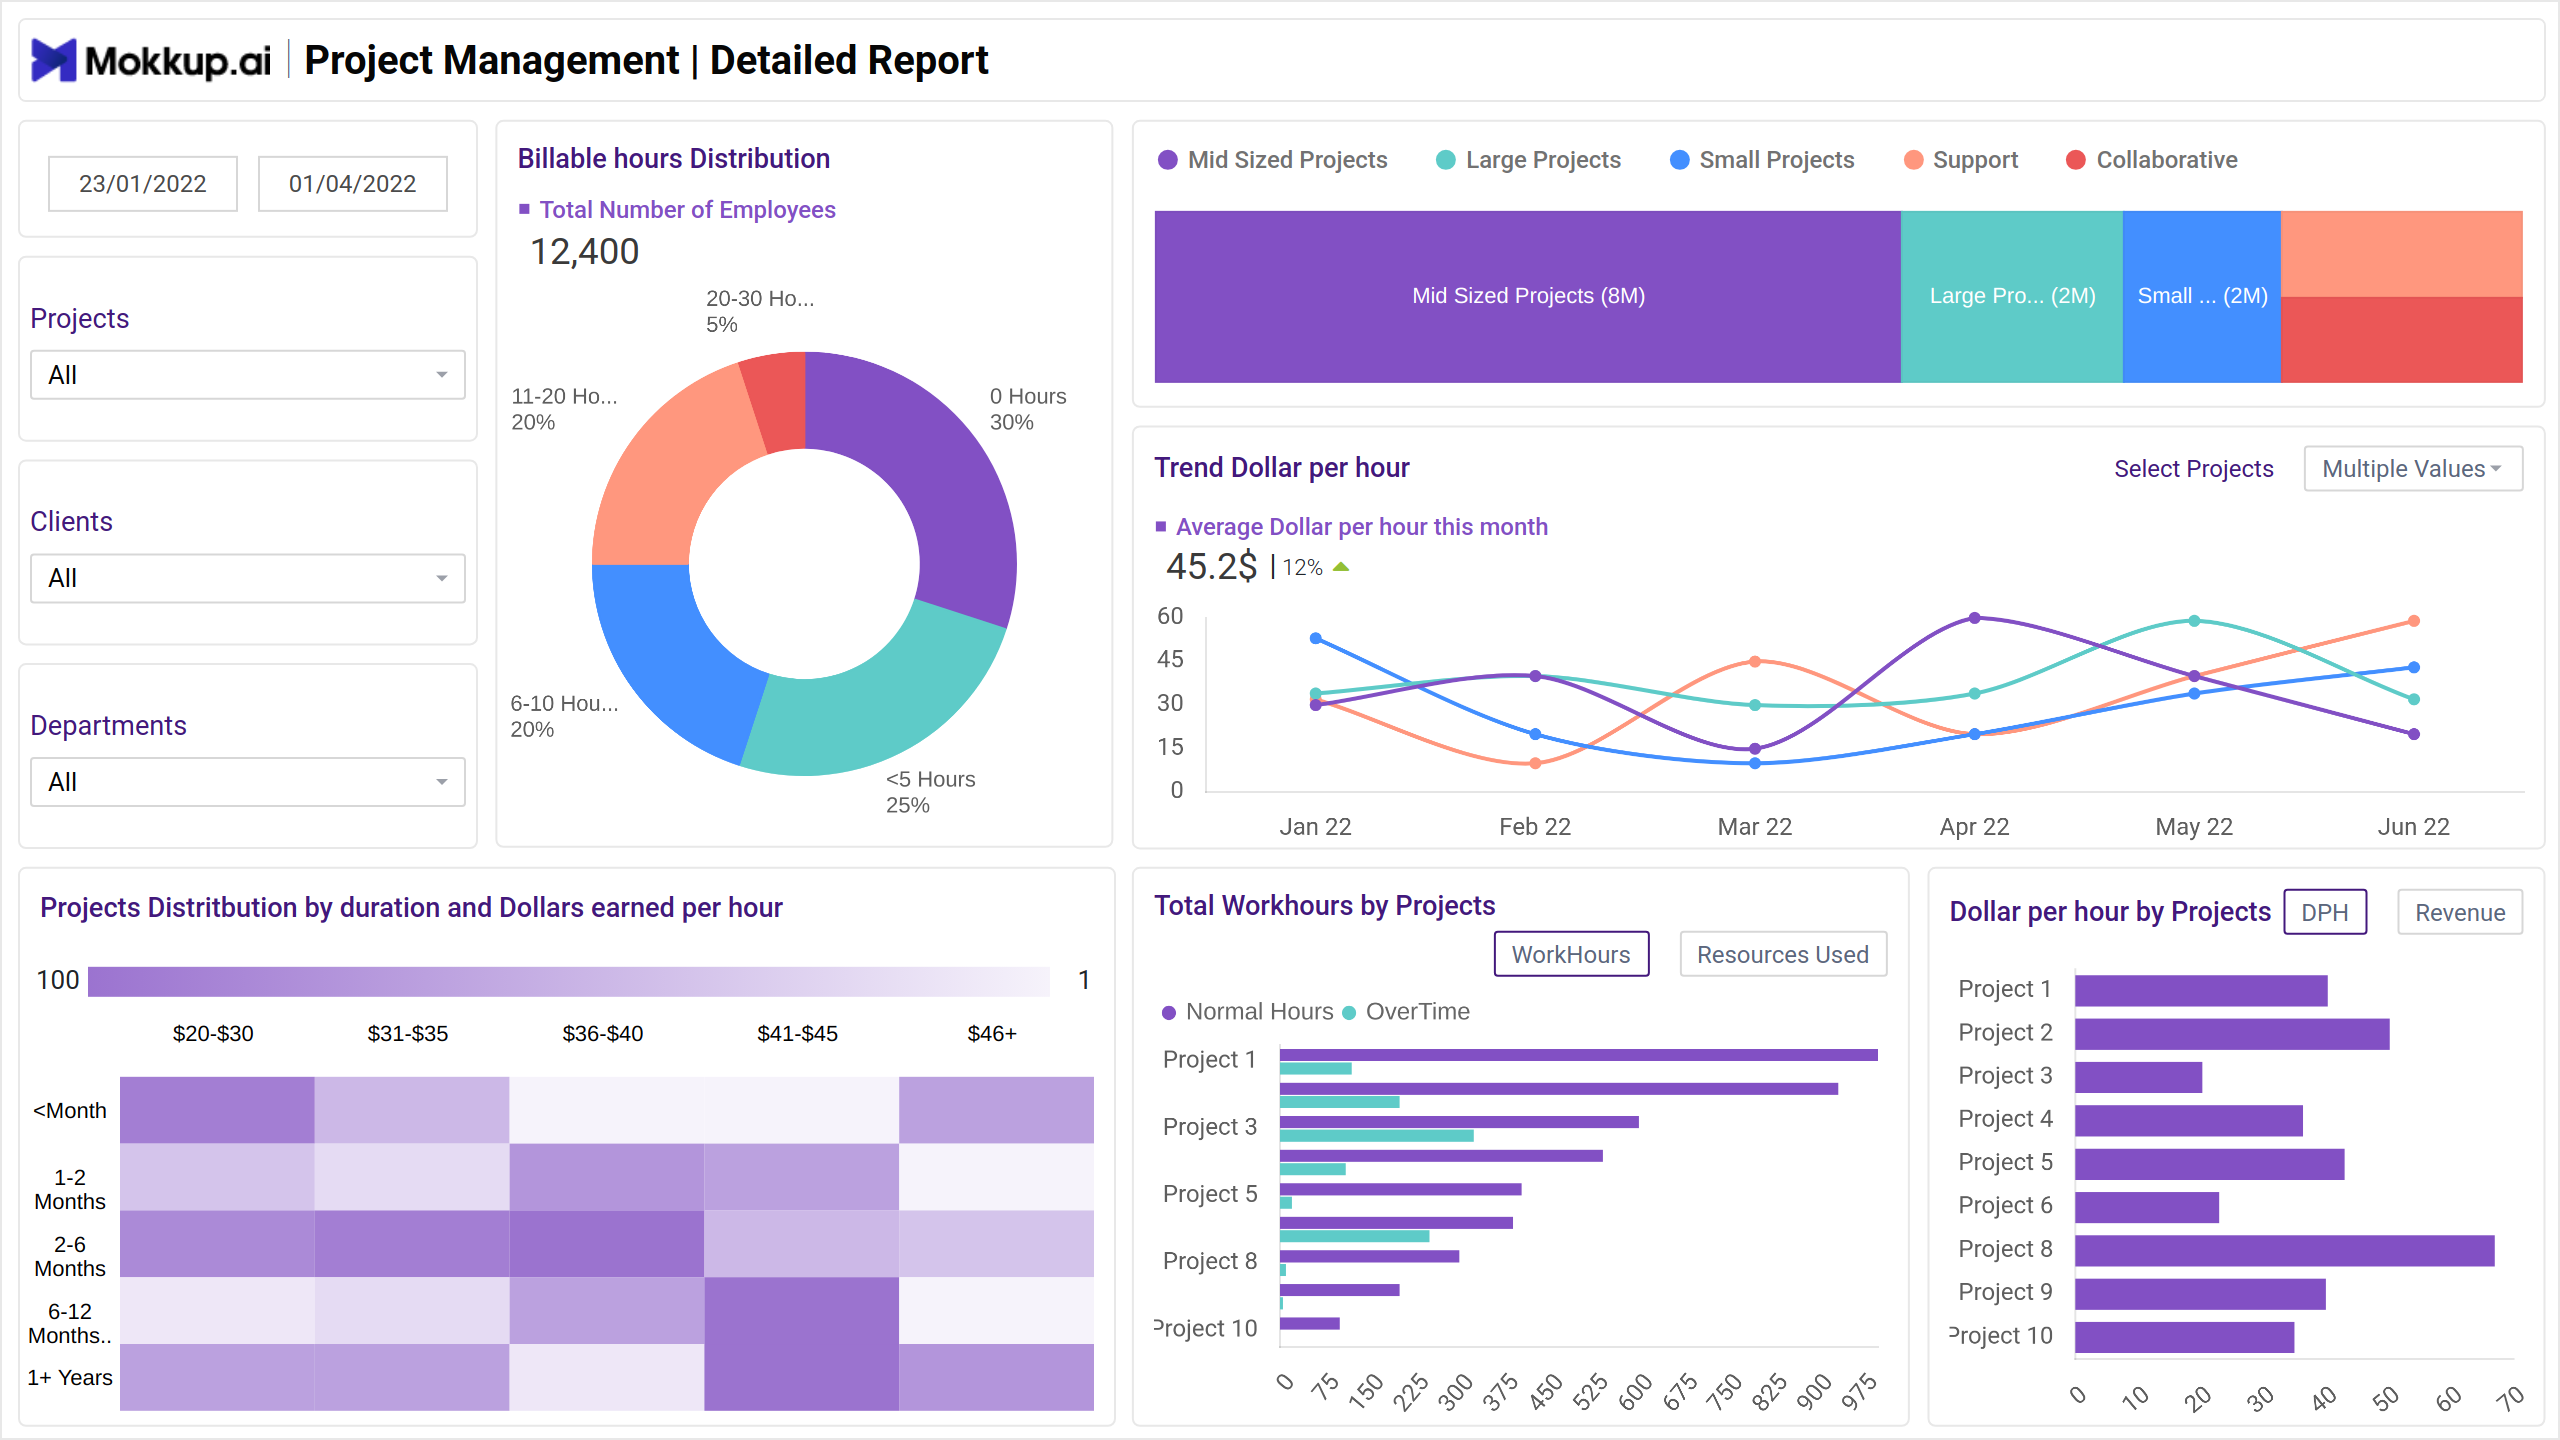
The Project Management Detailed Report dashboard wireframe provides project managers and stakeholders with comprehensive insights into the status and progress of various projects. This dashboard template offers a range of KPIs and visualizations that help track project performance, resource allocation, and overall project health. By consolidating critical data into an accessible format, this template enables effective decision-making and project oversight.
Key Terms to Know
- Billing Hours Distribution: Reflects the total number of employees and the percentage value of their working hours.
- Types of Projects: Represents the different types of projects in the organization, such as large, small, collaborative, etc.
- Trend Dollar Per Hour: Represents the average dollar per hour for the current month and the increment percentage value.
- Project Distribution by Duration and Dollars Earned Per Hour: Dollars earned per hour based on the project's duration.
- Total Work Hours by Project: Displays the number of regular and extra hours on a project.
- Dollars per Hour by Projects: Displays the dollars earned per hour based on the different projects.
Project Inflows
The Project Inflows Screen 2 of the Project Management Detailed Report dashboard focuses on tracking and analyzing the inflow of projects, providing insights into new project acquisitions, extensions, and completed projects. This screen helps project managers understand the pipeline's dynamics, assess performance through feedback, and evaluate financial outcomes. It includes various KPIs and visualizations that offer a comprehensive view of project inflows and their impact on profitability and revenue.
Key Terms to Know
- New Projects in the Pipeline: The number of new projects that are currently being considered or initiated.
- Project Extensions: The count of projects that have been extended beyond their original scope or timeline.
- Projects Concluded: The number of projects that have been completed within the reporting period.
- Concluded Projects Feedback: Provides insights into the quality and outcomes of completed projects, helping to identify areas of success and opportunities for improvement.
- Trend for Project Inflows: Helps in understanding the dynamics of project inflows, identifying peak periods, and planning resource allocation accordingly.
- Profits by Concluded Projects: Provides a clear view of the financial performance of completed projects, highlighting the most profitable projects.
- Trends in Profit and Revenue: Helps in assessing the financial health of the project portfolio, understanding revenue patterns, and making informed business decisions.
Dashboard Template Insights
- Detailed insights into resource allocation and utilization ensure optimal use of team members and other resources, preventing overallocation and underutilization.
- The dashboard helps in tracking financial performance, ensuring projects stay within budget and contribute to overall profitability.
- Risk assessment tools highlight high-risk projects, enabling proactive risk mitigation and better decision-making..
- Monitoring new projects, extensions, and concluded projects helps in understanding pipeline dynamics and planning for future project inflows.
Conclusion
The Project Management Detailed Report dashboard provides essential insights and metrics for effective project oversight, resource management, financial tracking, and risk assessment. By offering a comprehensive view of project performance and pipeline dynamics, this dashboard enables project managers to optimize efficiency, enhance outcomes, and drive organizational success.