The DevOps Summary Dashboard is a comprehensive control center, that orchestrates the intricacies of development and operations to streamline collaboration and maximize efficiency. Developers, operations teams, and stakeholders can leverage customizable widgets and visualizations to monitor the progress of continuous integration, deployment pipelines, and system reliability.
Screen 1:
This screen cultivates a culture of continuous improvement, aligning development and operations seamlessly to deliver high-quality software in a timely and efficient.
Key Terms to consider:
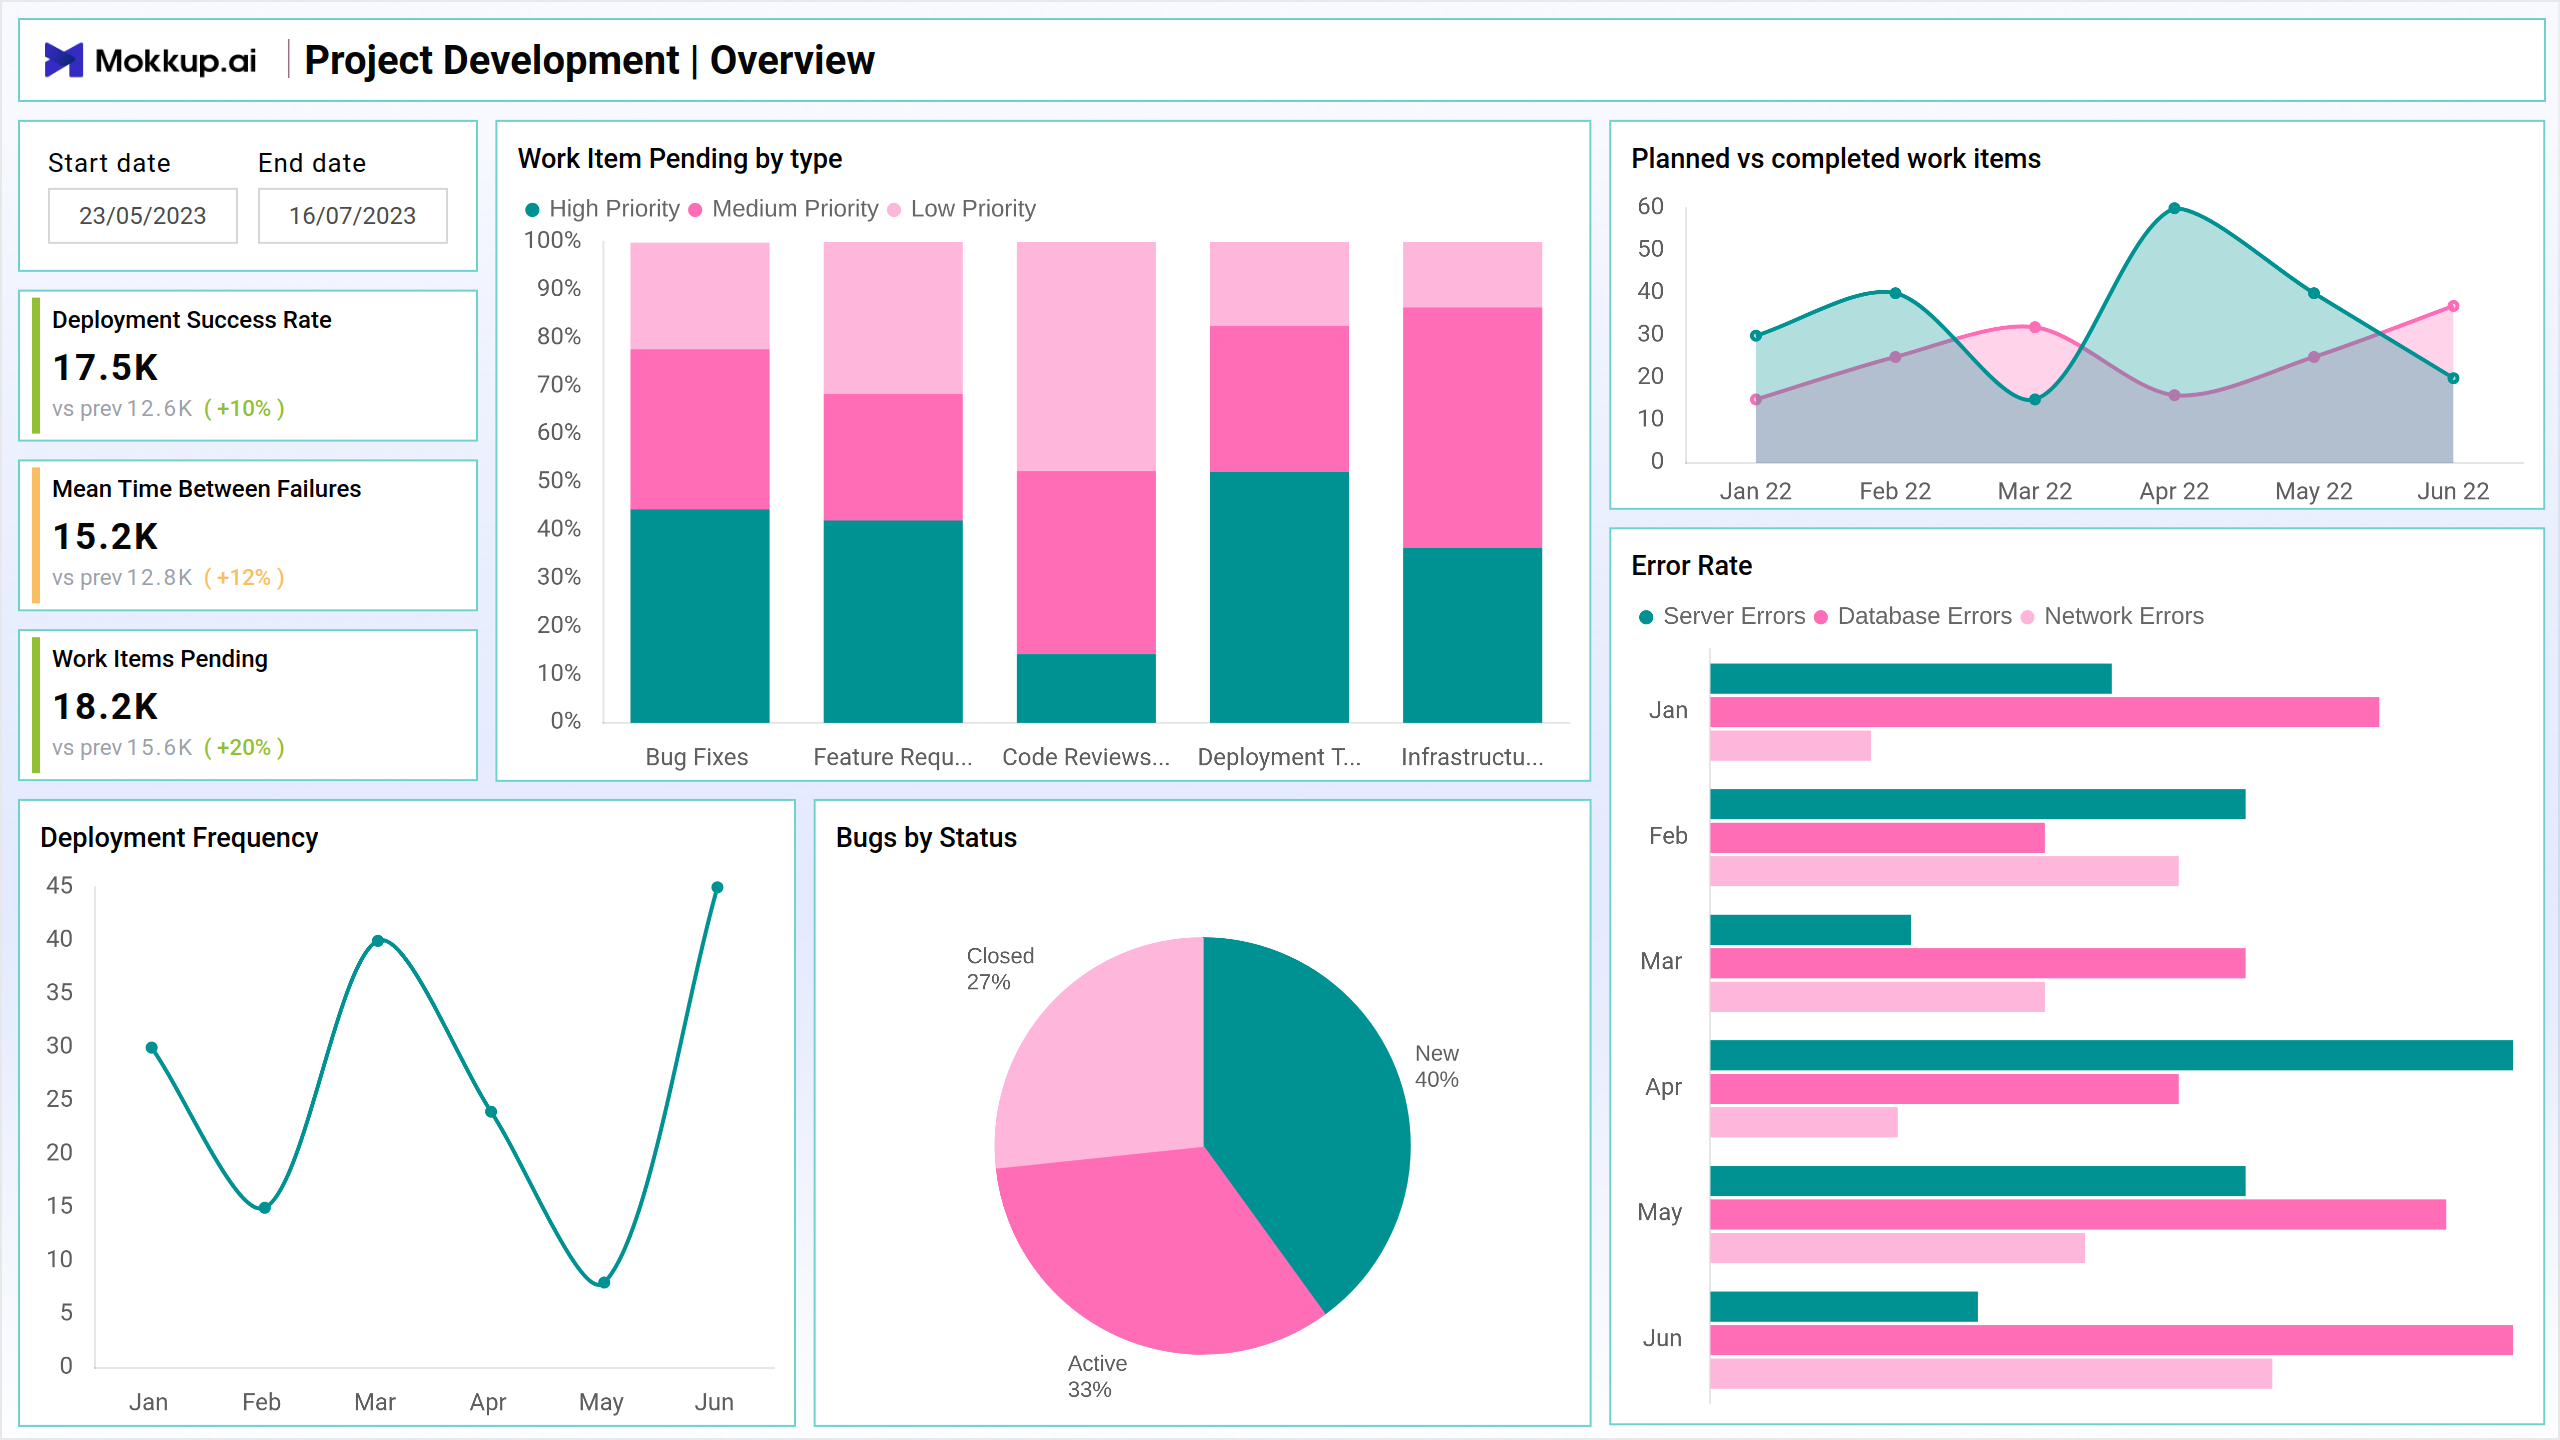
- Time Range: Select a specific time period to analyze DevOps metrics and identify areas for improvement over time.
- Deployment Success Rate: Track the percentage of deployments that succeed without any significant issues, indicating the reliability and stability of the deployment process.
- Mean Time Between Failures (MTBF): Measure the average time between deployments resulting in production failures, assessing software releases' overall stability and quality.
- Work Items Pending: Monitor the pipeline's pending work items, indicating potential bottlenecks and areas for process optimization.
- Deployment Frequency: Track the frequency of deployments to gauge the team's ability to deliver new features and updates quickly and efficiently.
- Planned vs Completed Work Items: Compare the number of planned work items against the number of completed work items to assess the team's ability to meet project goals and deliver on planned commitments.
- Error Rate: Track the percentage of errors or defects encountered during the development and deployment process, indicating software releases' overall quality and reliability.
- Bugs by Status: Analyze the distribution of bugs across different status categories (e.g., open, in progress, resolved, closed) to track bug resolution progress and identify potential areas for improvement in bug detection and remediation.
Dashboard Template Insights
The DevOps Summary Dashboard is a vital control center, fostering collaboration and efficiency by aligning development and operations seamlessly. By monitoring key metrics like Deployment Success Rate and Bugs by Status, the dashboard facilitates data-driven decision-making to streamline processes and achieve excellence in software delivery.
Conclusion
DevOps Summary Dashboard is an invaluable tool for users committed to achieving DevOps excellence. The dashboard provides a comprehensive overview of key metrics and enables data-driven decision-making. It helps organizations streamline their DevOps processes, deliver high-quality software, and achieve their business goals.