
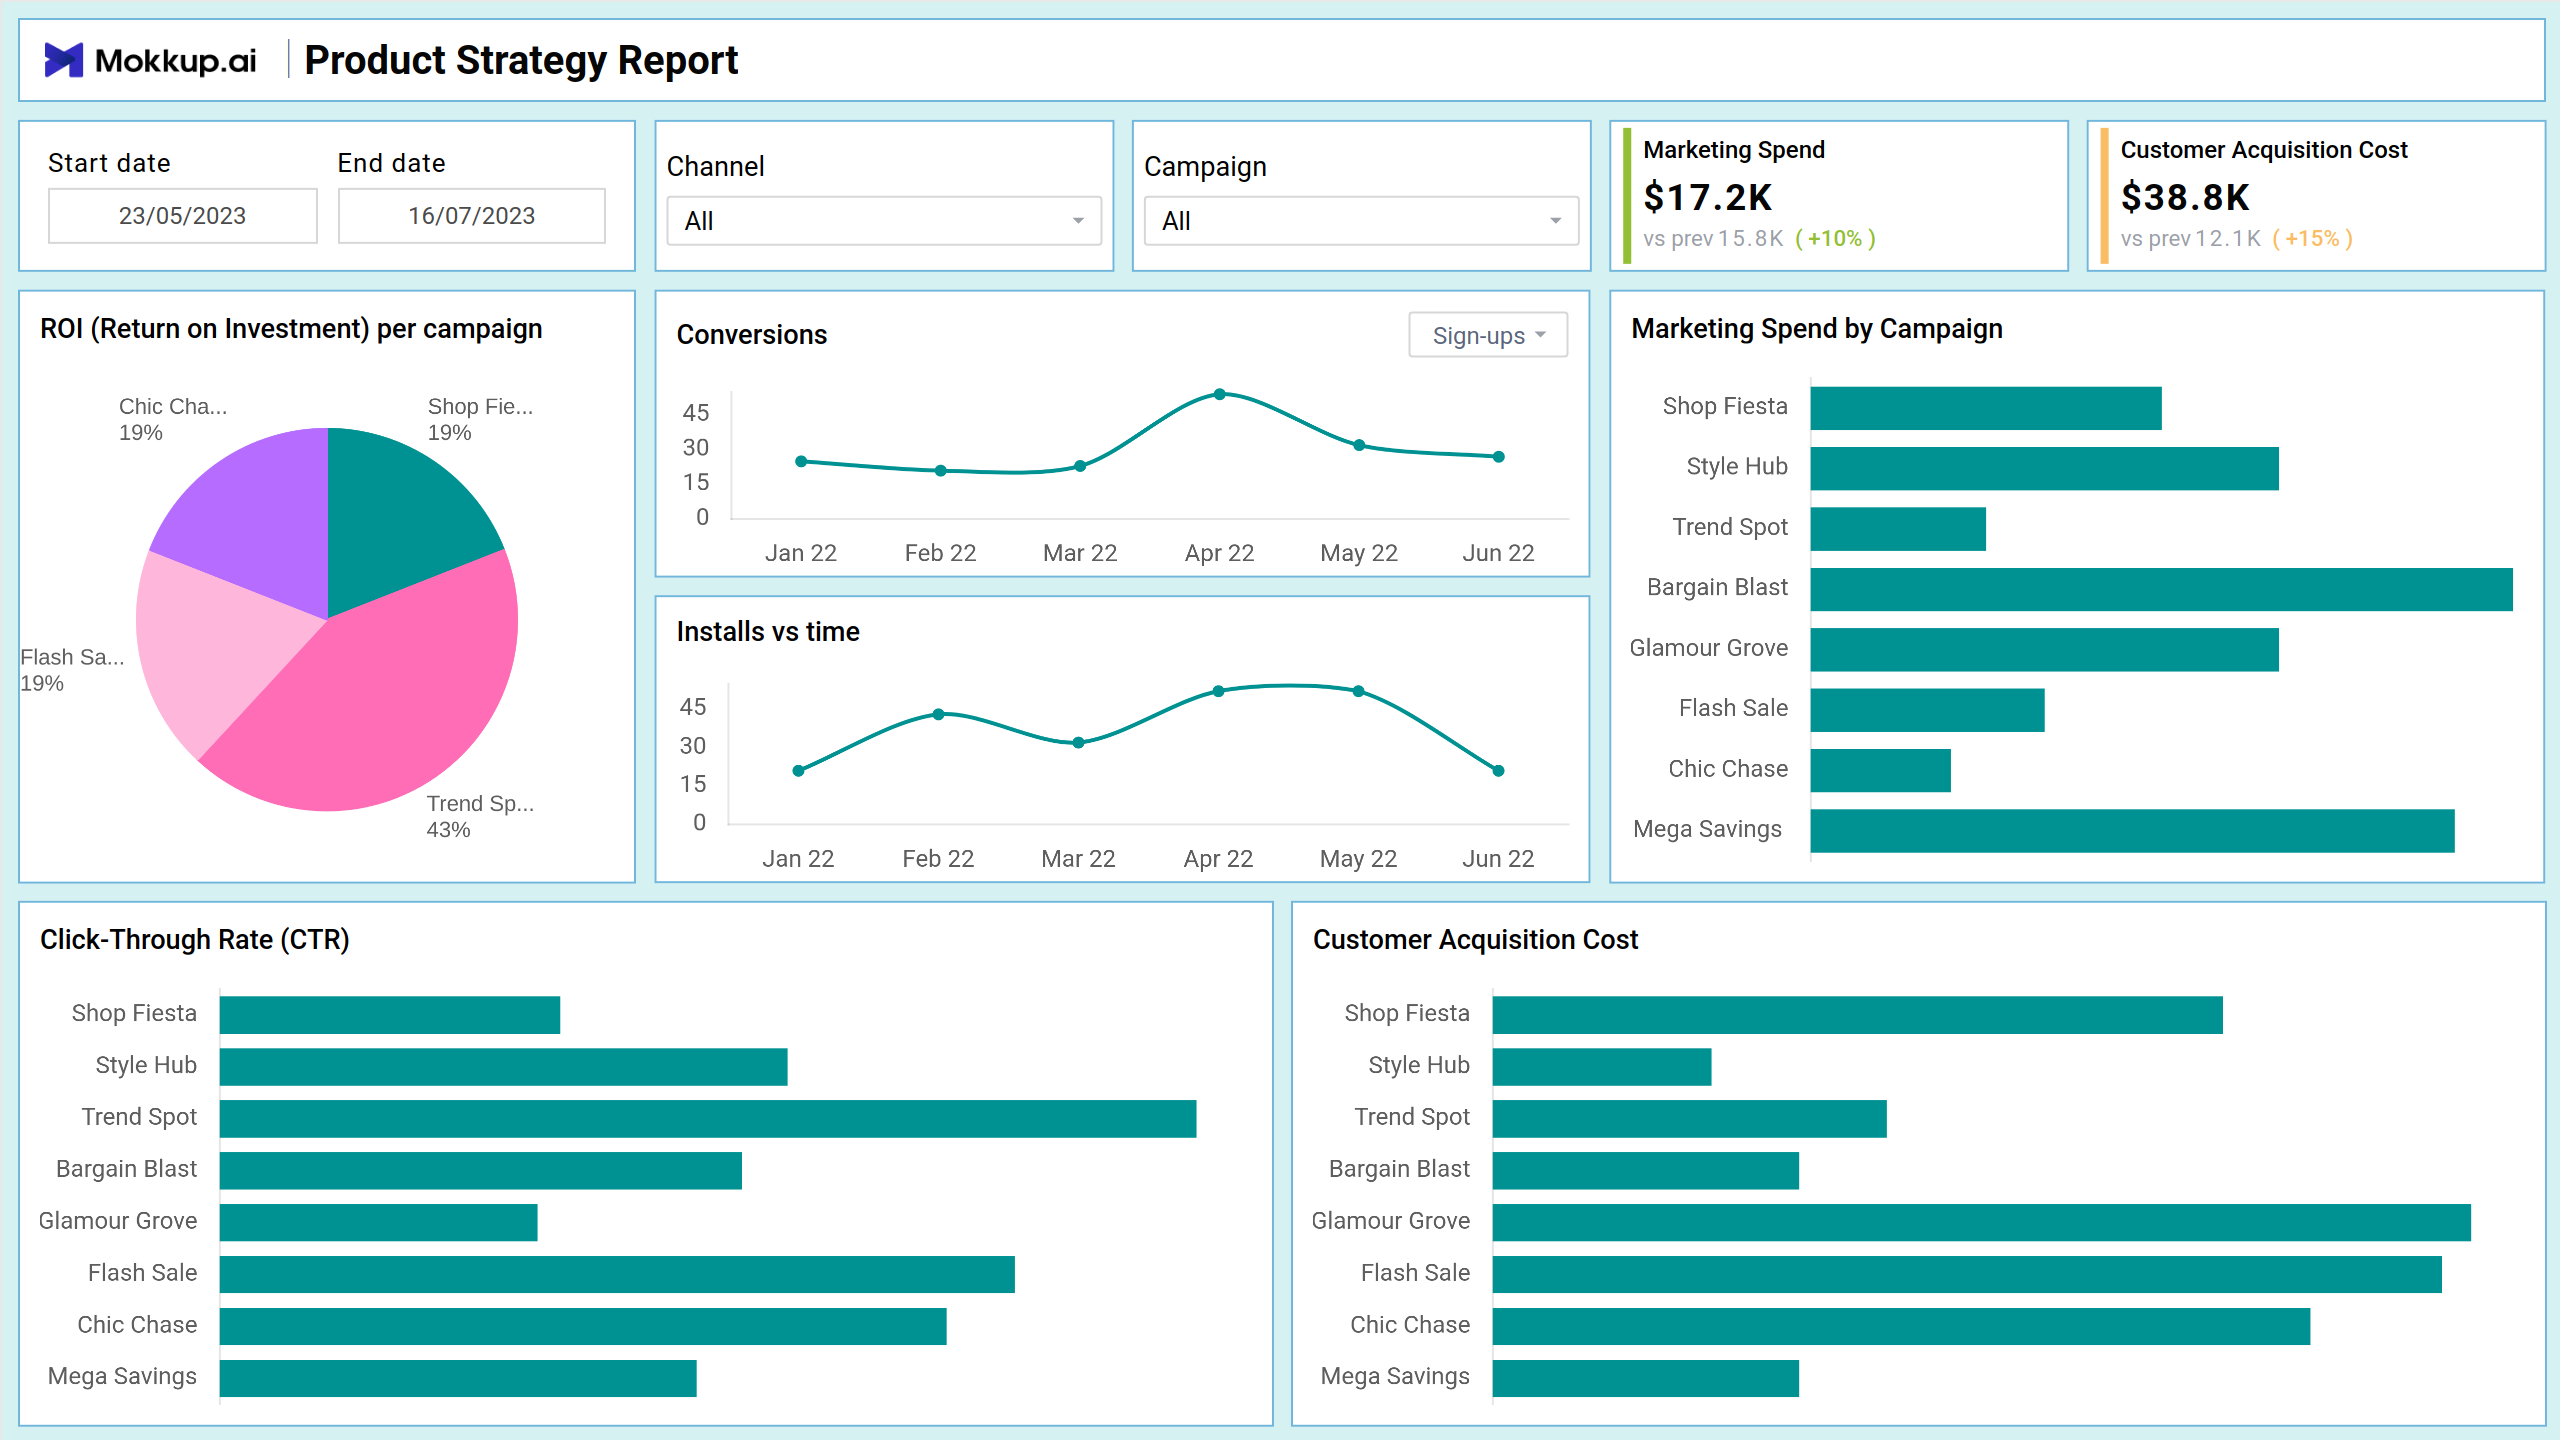
This dashboard is meticulously engineered for comprehensive strategy data visualization, offering in-depth insights into marketing campaigns, sales activities, and developmental initiatives. This sophisticated tool serves as a centralized repository, integrating key performance indicators to furnish strategic decision-makers with actionable intelligence.
Screen 1: Marketing
At the forefront of campaign analysis is the crucial metric of return on investment (ROI) per campaign, which provides a quantitative assessment of the effectiveness of marketing initiatives. The dashboard provides a more detailed view of campaign effectiveness by examining conversion statistics in greater detail to clarify how leads become actual customers. Simultaneously, it breaks down marketing spend by campaign, providing stakeholders with a comprehensive analysis of resource allocation.
Key Terms to consider:
- ROI (Return on investment) per campaign: Allows for measuring the effectiveness of marketing efforts and optimizing future campaigns accordingly.
- Conversions: Provides insights into the effectiveness of marketing strategies in driving desired actions from the audience.
- Marketing spend by campaign: Helps in allocating resources efficiently and identifying high-performing campaigns.
- Customer acquisition cost: Aids in evaluating the efficiency of marketing campaigns in acquiring new customers.
- Click-Through Rate (CTR): Helps gauge the effectiveness of ad campaigns in generating interest and engagement among the audience.
- Installs VS time: Provides insights into the effectiveness of marketing efforts over different periods, aiding in identifying trends and adjusting strategies accordingly.
Screen 2: Sales
This screen offers essential insights into various aspects of sales analysis and management. Sales versus time provides a comprehensive view of sales trends, aiding in strategic planning and forecasting. Identifying best-selling products enables targeted marketing and efficient inventory management. Understanding average transaction value illuminates customer behavior, while sales by region allow for tailored marketing strategies and resource allocation according to geographical demand.
Key Terms to consider:
- Sales Vs time: Provides insights into sales trends and seasonality, aiding in forecasting and strategic planning.
- Best selling products: Allows for targeted marketing efforts and inventory management optimization.
- Average transaction value: Helps in understanding customer purchasing behavior and maximizing revenue per transaction.
- Sales by region: Facilitates targeted marketing strategies and resource allocation based on geographical demand.
Screen 3: Development
This screen ensures the efficiency and effectiveness of product development and maintenance processes. Tracking bug fix rate versus time facilitates ongoing enhancement of product quality and user experience. Resolving customer-reported issues promptly nurtures satisfaction and loyalty. Comparing planned versus actual timelines offers insights into project management effectiveness, while monitoring feature adoption rates informs future development priorities. Strategic planning of product development ensures alignment with market demands and organizational objectives, optimizing resource allocation and time-to-market.
Key Terms to consider:
- Bug fix rate vs time: Enables continuous improvement in product quality and user experience.
- Customer reported issues resolved: Promptly fosters customer satisfaction and loyalty.
- Planned vs actual timeline: Provides insights into project management effectiveness and helps in adjusting future timelines.
- Feature Adoption rate: Helps gauge user engagement and informs future product development priorities.
- Planned product development: Strategically ensures alignment with market demands and organizational goals, optimizing resource utilization and time-to-market.
Dashboard Template Insights
This meticulously crafted dashboard serves as a robust tool for comprehensive strategy data visualization, offering profound insights into marketing, sales, and development initiatives. By integrating key performance indicators, it empowers decision-makers with actionable intelligence. Each screen is tailored to specific needs: Marketing analytics focus on ROI per campaign, conversions, and marketing spend; sales analysis highlights trends, product performance, and regional insights; while development metrics emphasize continuous improvement, customer satisfaction, and strategic alignment with market demands.
Conclusion
Designed to facilitate seamless collaboration among marketing, sales, and development teams, this centralized hub serves as an instrumental resource for data-driven decision-making.