
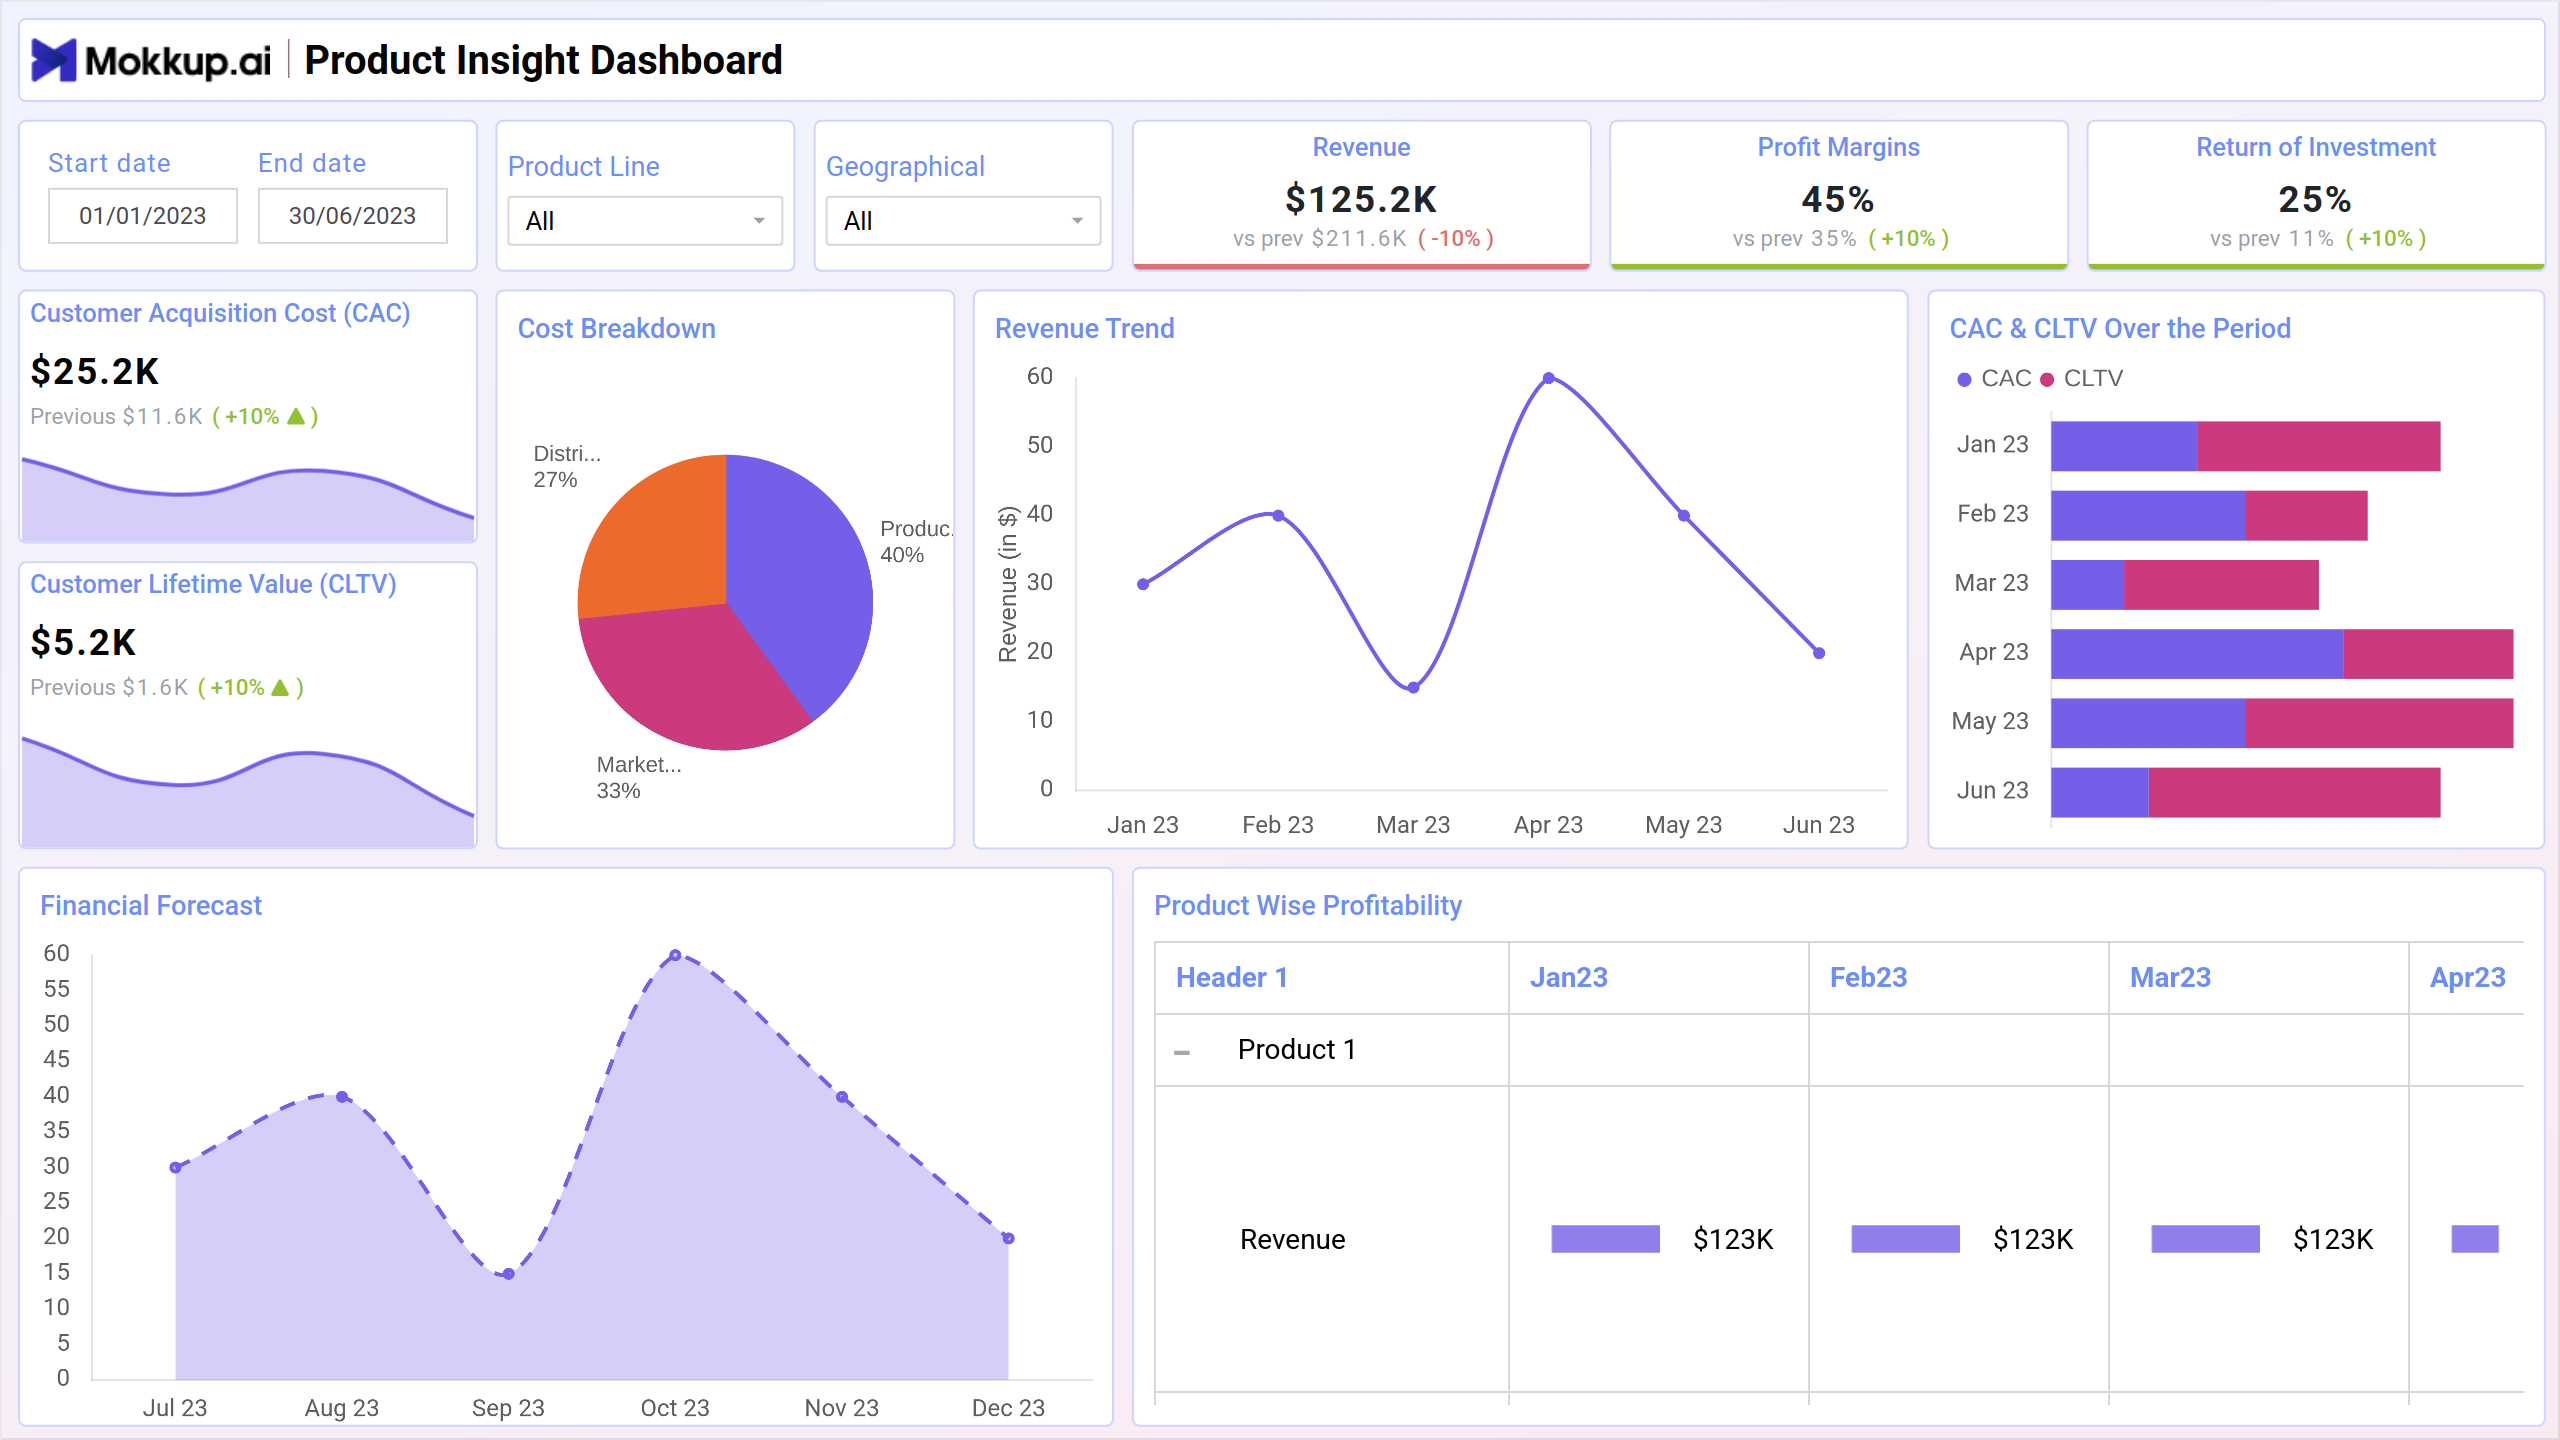
The product insight dashboard template, is designed to provide a comprehensive snapshot of product performance and insights. This template offers key metrics and analytics to empower CEOs with actionable insights into product strategy and performance. With a user-friendly interface and concise data presentation, it enables informed decision-making and strategic planning for product development and growth.
The dashboard wireframe comprises three screens: Financial Performace, Product Usage & Configuration & Product Development; each is explained briefly below.
Financial Performace
This screen tracks financial metrics across various categories and timeframes. It allows users to analyze revenue, profit margins, return on investment (ROI), customer acquisition costs (CAC), and customer lifetime value (CLTV). The template also provides a financial forecast and breakdowns by product line and geographical location. Overall, this template is designed to give users a comprehensive view of a company’s financial health and performance.
Key Terms to Know
- Revenue: Displays the total income generated from sales.
- Profit Margins: Shows the percentage of revenue that exceeds the costs of production.
- Return on Investment: Measures the profitability of investments relative to their costs.
- Customer Acquisition Cost: Indicates the average expense of gaining a new customer.
- Customer Lifetime Value: Estimates the total revenue expected from a customer over their relationship with the company.
- Cost Breakdown: Provides a detailed analysis of various expenses incurred by the company.
- Revenue Trend: Visualizes the changes in revenue over a specified period.
- Financial Forecast: Predicts future financial performance based on current data and trends.
Product Usage
This view tracks how users interact with a product, allowing product managers and business stakeholders to understand user behavior and identify areas for improvement. The screen includes metrics on active users, new users, retention rate, session duration, customer satisfaction score, and product feature usage. It also allows users to filter data by factors such as date range, product tier, and product features.
Key Terms to Know
- Product Features Usage: Analyzes how frequently different features of the product are utilized by users.
- Product Usage by State: Breaks down product usage statistics geographically by state.
- Retention Rate: Measures the percentage of users who continue to use the product over a given period.
- Session Duration: Indicates the average length of time users spend on the product per session.
- Customer Satisfaction Score (CSAT): Evaluates user satisfaction based on their feedback and ratings.
- Returning vs New Users: Compares the proportion of repeat users to new users within a specified timeframe.
Product Development
This screen tracks the progress of a product development project across various stages. It includes sections for financial performance, product usage, and development progress. Financial performance metrics include budget allocation and remaining funds. Product usage tracks metrics such as active users and feature completion. Development progress includes information on testing progress, bug tracking, and resources allocated.
Key Terms to Know
- Testing Progress: Monitors the advancement of testing activities and completion status.
- Bug Tracking Module: Tracks reported bugs, their resolution status, and any associated actions.
- Budget Allocated vs Remaining: Compares the allocated budget with the remaining funds to ensure financial accountability and planning.
- Feature Completion: Indicates the progress of feature development and implementation against set milestones.
- Approved Ideas by Budget Split: Displays ideas approved for implementation categorized by budget allocation.
- Planned vs Utilized Hours (by Resource): Compares planned work hours with actual hours utilized by each resource.
- Task Status: Provides an overview of the current status of tasks, including completed, in progress, and pending.
- Summary: Summarizes key metrics and insights to provide a snapshot of project progress and performance.
Dashboard Template Insights
This dashboard wireframe delivers comprehensive insights into product performance and strategy:
- It provides a complete overview of revenue, profit margins, ROI, and other key financial metrics, facilitating informed decision-making at the executive level.
- With metrics like customer acquisition cost, lifetime value, and satisfaction scores, it offers detailed insights into customer behavior and preferences.
- By presenting product usage data by state, the dashboard enables analysis of regional trends and market penetration strategies.
- Metrics such as feature completion and planned vs utilized hours empower CEOs to optimize resource allocation and project planning for enhanced efficiency and productivity.
Conclusion
In conclusion, this template furnishes invaluable insights into product performance and strategy. With comprehensive financial analysis, detailed customer insights, regional performance assessment, and strategic resource management tools, it equips CEOs with the necessary information to make informed decisions and drive business growth.