
The quality of the products a business is going to sell is its biggest USP. A lot of compromises can be made when it comes to the price of a product. Discounts and sales would help increase the number of sales. However, if the quality of the product is compromised, then the company would face a loss that may cost them their reputation as well.
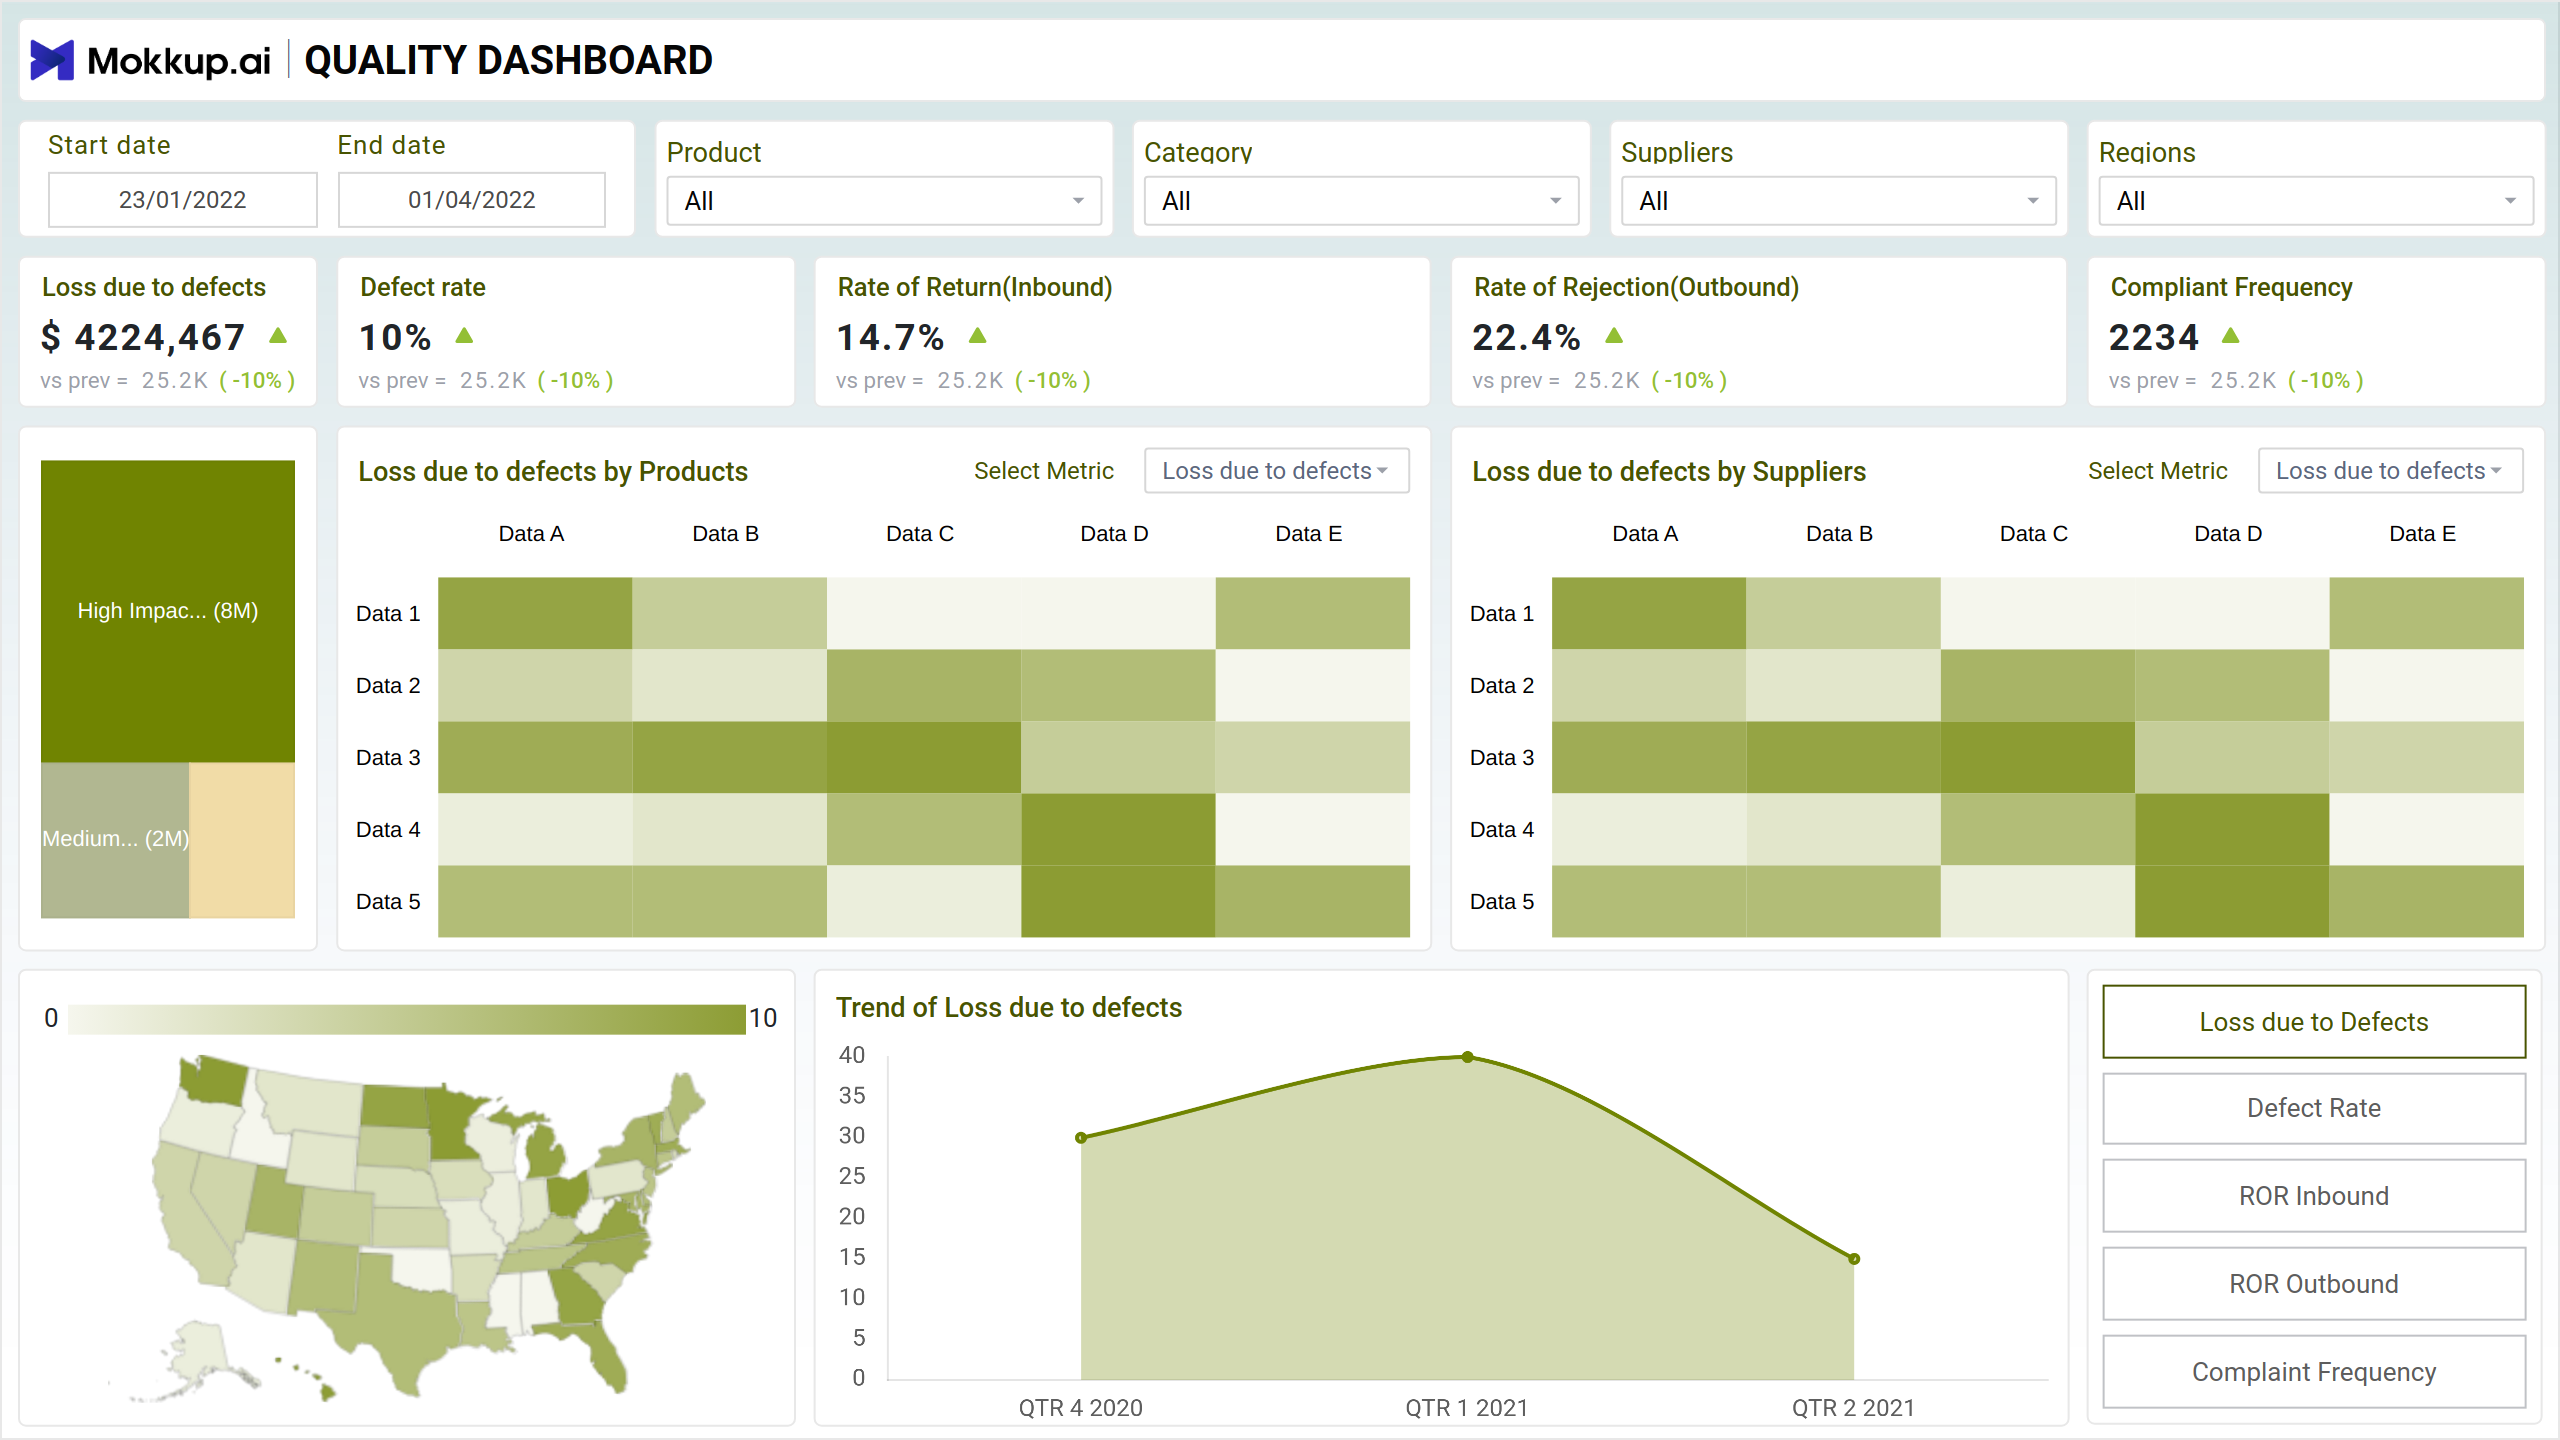
Hence, the Procurement Product Quality dashboard template will help keep track of the quality of goods received by different suppliers. The dashboard wireframe focuses on analyzing quality control and supplier performance metrics.
Key Terms to Know:
- Loss Due to Defects:This is the amount that the company has lost due to defects in the products
- Defect Rate: This is the percentage of products that turned out to be defective out of the entire inventory
- Rate of Return: This refers to the percentage of goods returned to the company from the customers
- Rate of Rejection: This refers to the percentage of goods rejected by the company when delivered from the supplier
- Compliant Frequency: This is the number of suppliers that have adhered to the procurement guidelines and policies of the company
- Loss Due to Defects by Products: This is a chart that would give an idea of the losses incurred by the company due to defects.
- Loss of Defects by Suppliers: This would give an idea of the losses incurred by the company due to defects. This chart would give this data based on suppliers
Quality Dashboard - Screen 2
Screen 2 of the dashboard wireframe delves deeper into supplier-related metrics and defect analysis.
Key Terms to Know:
- Loss Incurred by Supplier: Provides an overview of the financial losses incurred by the company attributed to different suppliers, allowing for evaluation of supplier performance and potential mitigation strategies.
- Defect Type Distribution: Visualizes the distribution of defect types across products or suppliers, facilitating identification of common defect categories and areas requiring quality improvement efforts.
- Distribution of Issues and Remarks: Illustrates the distribution of issues and remarks associated with products or suppliers, enabling a visual understanding of recurring problems and areas for corrective action.
- Supplier Summary of Products Table: Presents a summary of products supplied by each supplier, including relevant metrics such as defect rates, return rates, and rejection rates, aiding in supplier evaluation and decision-making processes.
Quality Dashboard - Screen 3
Screen 3 of the dashboard wireframe focuses on analyzing quality performance and supplier rankings based on defect metrics.
Key Terms to Know:
- High Impact Defects Loss: This is the amount lost by the company due to high-impact defects in the products
- Quality Score: The quality score is generated based on key metrics such as defect rate, rate of return, etc.
- Bottom Suppliers by Defect Rate: This will give a list of the bottom N suppliers that have delivered the most number of defective products in the inventory.
Dashboard Template Insights
The wireframe provides key insights to enhance supplier evaluation and ensure product quality:
- It tracks supplier performance through metrics such as defect rates, return rates, and compliance frequency, supporting supplier evaluation and selection.
- Detailed defect analysis across products and suppliers helps identify common defect types, areas for improvement, and strategies to mitigate defects, improving overall product quality.
- The dashboard wireframe generates quality scores based on key metrics, ranking suppliers to highlight top performers and identify underperforming suppliers with high defect rates, enabling targeted improvement efforts.
Conclusion
The Procurement Product Quality Dashboard template plays a crucial role in maintaining the reputation and competitiveness of the business by ensuring the quality of products received from suppliers. Through analysis of defect rates, return rates, and compliance frequency, businesses can identify areas for improvement, mitigate financial losses due to defects, and prioritize suppliers based on performance. By continually monitoring and optimizing quality metrics, businesses can uphold their reputation for delivering high-quality products and ensure customer satisfaction.