
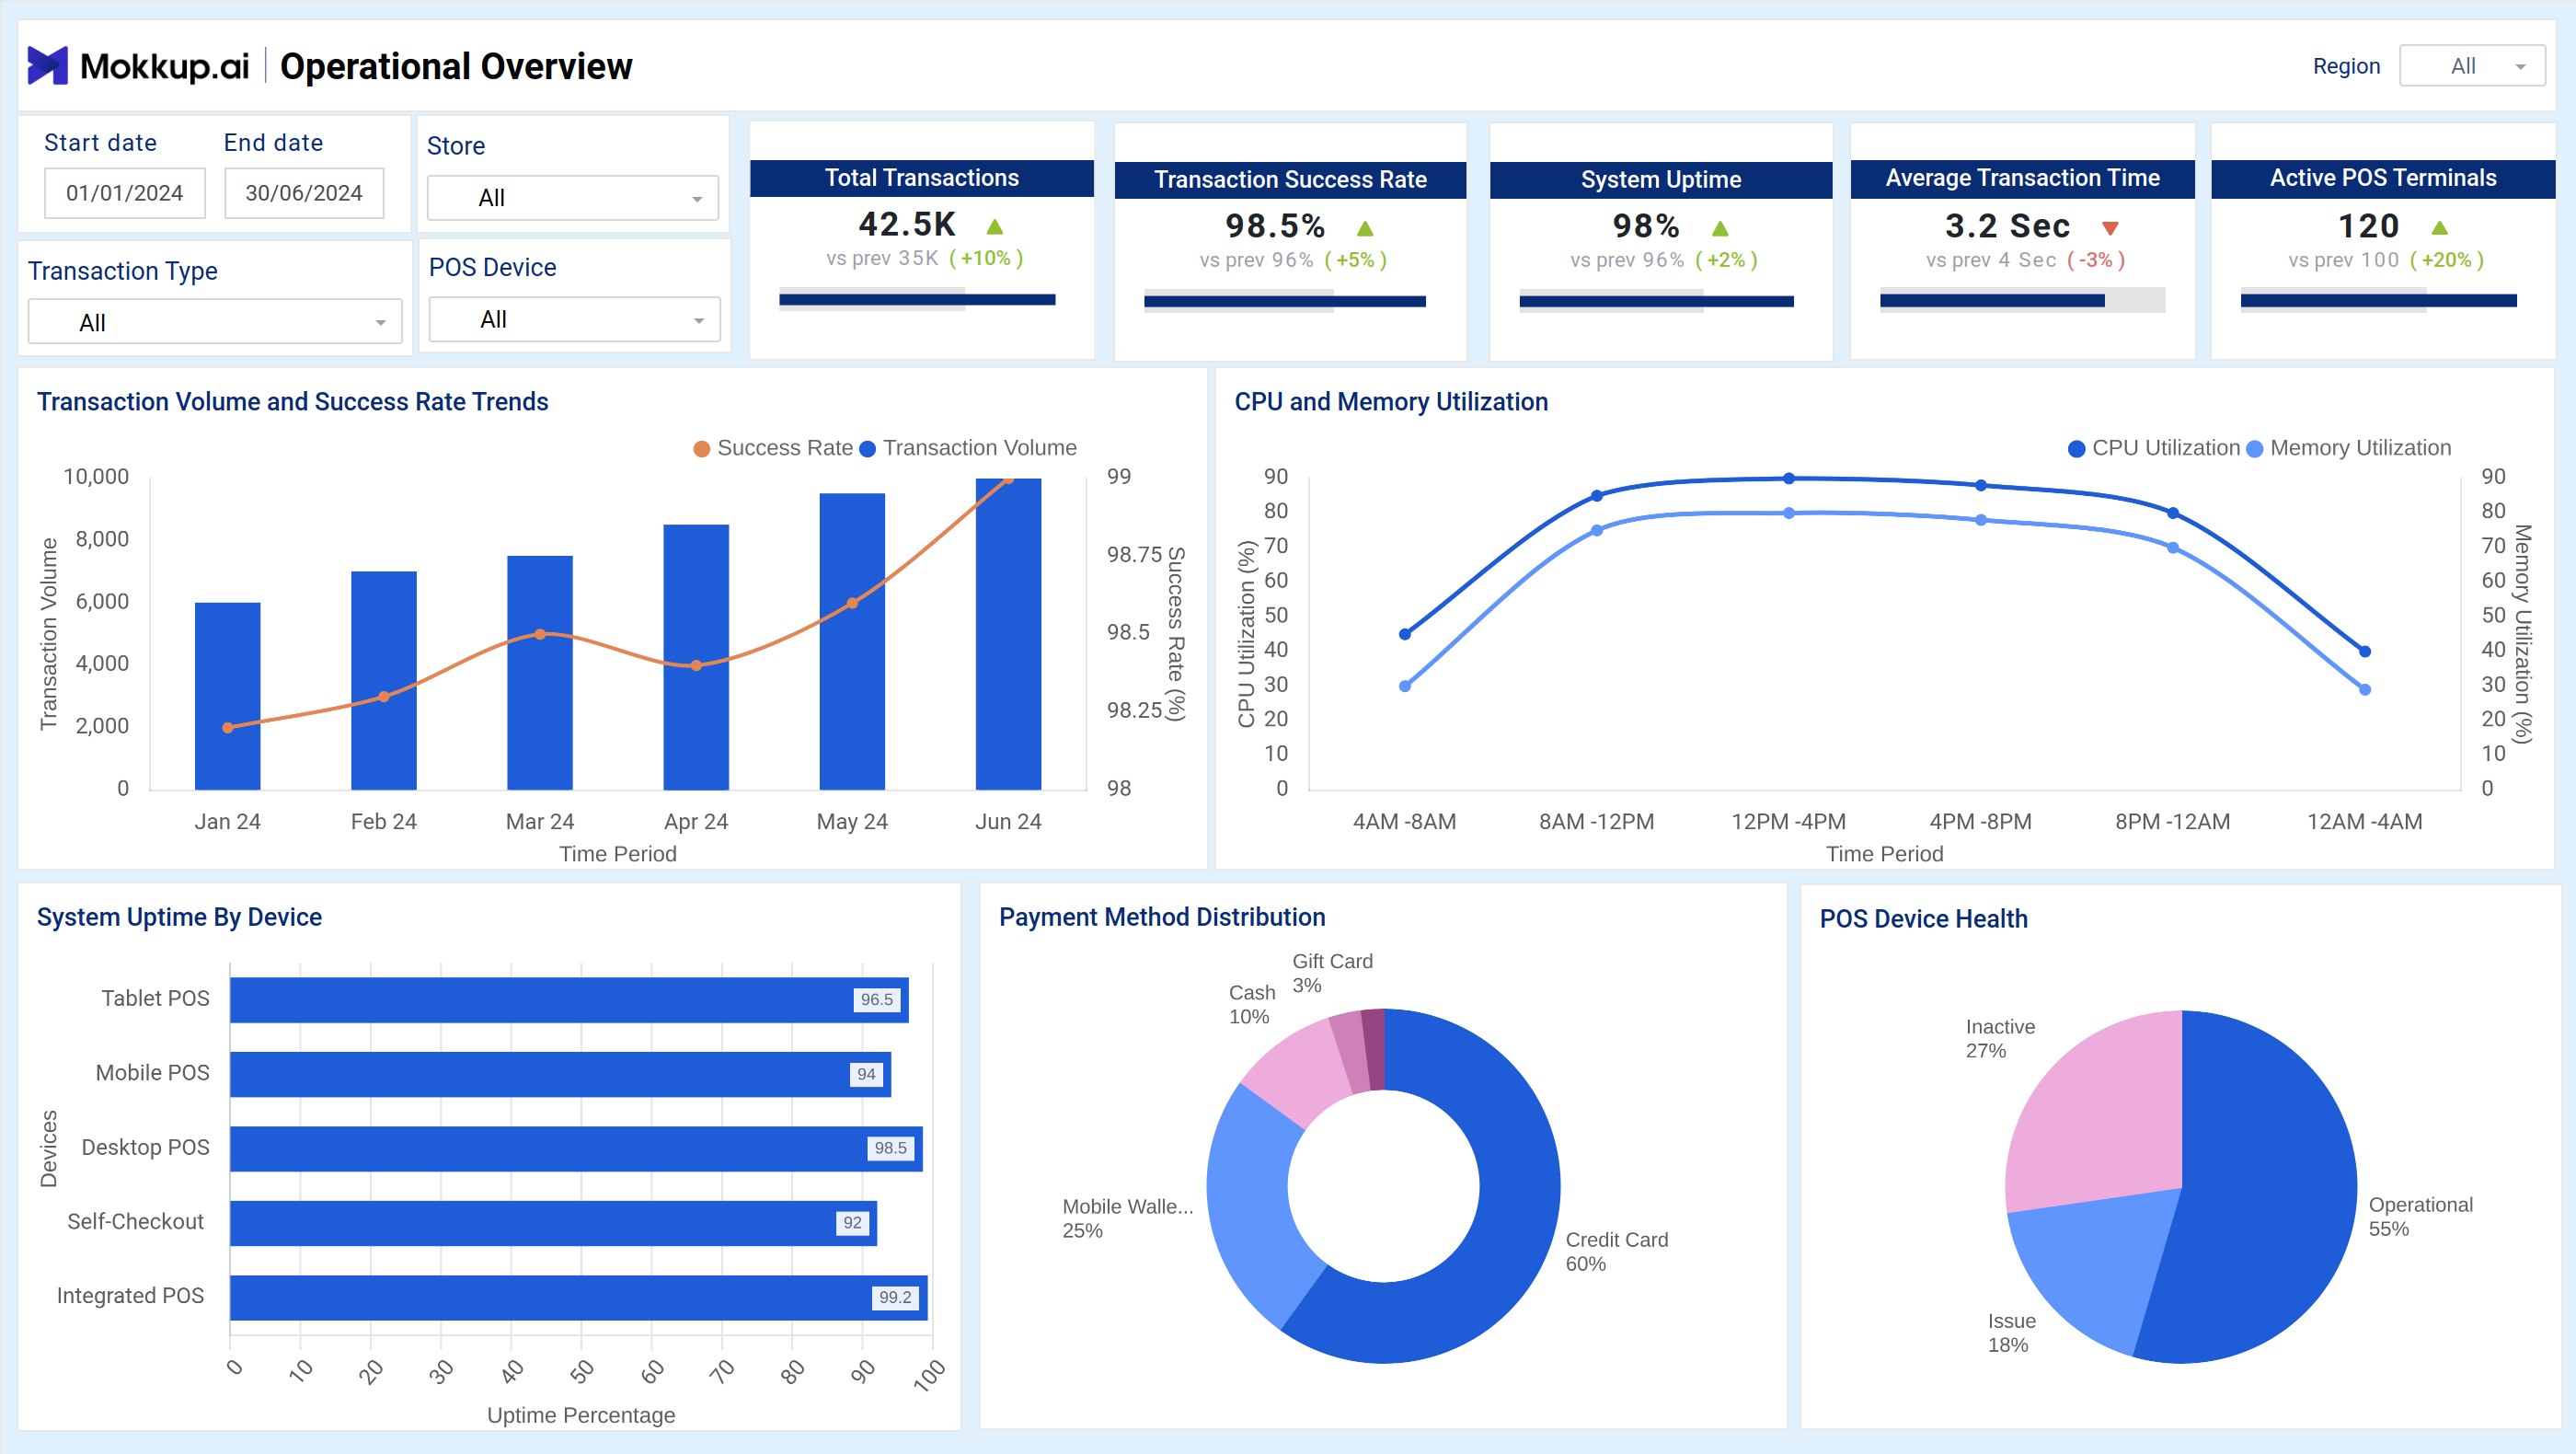
The POS Efficiency Tracker dashboard template provides a thorough analysis of transaction performance, system health, and device efficiency. It helps organizations streamline point-of-sale operations and improve the quality of service.
Operational Overview
The Operational Overview monitors key metrics and trends to assess the overall performance and efficiency of POS systems. It delivers useful insights on transaction success, system health, and resource utilization.
Key Terms to Know
- Total Transactions: Tracks the total number of transactions processed
- Transaction Success Rate: Measures the percentage of successful transactions to evaluate system reliability.
- System Uptime: Indicates the percentage of time POS systems are operational and available for use.
- Average Transaction Time: Reflects the average duration required to process a transaction.
- Active POS Terminals: Displays the number of devices currently in operation to monitor resource availability.
- Transaction Volume and Success Rate Trends: Shows transaction patterns and success rates over time to identify trends and anomalies.
- CPU and Memory Utilization: Tracks resource usage to optimize system performance.
- System Uptime by Device: Provides uptime metrics for individual POS devices.
- Payment Method Distribution: Visualizes the proportion of transactions by payment method to track customer preferences.
- POS Device Health: Displays the health status of POS devices to enable proactive maintenance.
Error Monitoring & Resolution
The Error Monitoring and Resolution Screen provides an in-depth overview of system errors, their impacts, and the effectiveness of resolution. This screen identifies and resolves issues quickly by analyzing error patterns, locations, and fundamental causes, reducing disruptions and ensuring system reliability.
Key Terms to Know
- Total Error Count: Tracks the total number of errors logged to measure the system's error volume.
- Error Rate: Calculates the frequency of errors relative to transactions or operations.
- Resolved Error Rate: Measures the percentage of errors successfully resolved.
- Average Resolution Time: Monitors the average time taken to resolve errors.
- Error Recurrence Rate: Tracks the rate at which previously resolved errors reoccur.
- Error Breakdown by Type: Visualizes the distribution of errors across different categories for targeted analysis.
- Error Location Analysis: Maps errors to specific locations, providing geographical insights into error patterns.
- Average Resolution Time Trend: Displays changes in resolution time over a period.
- Root Cause Analysis of Errors: Highlights the underlying causes of errors to guide preventive measures.
- Troubleshooting Effectiveness: Evaluates the success of troubleshooting efforts to improve resolution strategies.
Dashboard Template Insights
The POS Efficiency Tracker dashboard wireframe offers actionable insights for improving transaction performance and system accuracy:
- It analyzes transaction trends and resource utilization.
- Monitors system uptime by device and device health.
- Visualizes payment method distribution to understand customer preferences.
- Identifies and resolves errors with root cause analysis, error location mapping, and resolution trends.
Conclusion
The POS Efficiency Tracker dashboard template provides actionable insights into key operational and error metrics, helping businesses ensure seamless transactions, optimize resource utilization, and enhance system reliability. By using these insights, organizations can proactively address issues, improve uptime, and deliver a better customer experience.