What is a Patient Nutrition Overview Dashboard?
A Patient Nutrition Overview Dashboard is a healthcare analytics tool that provides real-time insights into patient dietary compliance, calorie intake, macronutrient balance, and nutrient variations. It helps dietitians, clinicians, and healthcare providers track adherence to prescribed diet plans and identify nutritional gaps.
The patient nutrition overview dashboard template integrates clinical and dietary data into one platform, ensuring that nutrition goals are aligned with patient health outcomes. As a real-time nutrition monitoring dashboard, it enables proactive interventions, improved compliance, and better long-term management of chronic conditions.
How To Create a Patient Nutrition Overview Dashboard
You don’t need to build your report from scratch—just start with a ready-to-use Sample Patient Nutrition Overview Dashboard Template from Mokkup. Add in your data and export it however you like. Here’s how to do it:
1. Create or Log in to Your Mokkup Account
Start by signing up on Mokkup.ai using your email. If you already have an account, just log in, and you’ll be good to go.
2. Choose and Customize Your Dashboard Template
Find the Patient Nutrition Overview Dashboard template in the Templates section. Use the drag-and-drop editor to adjust KPIs, edit filters, or add elements based on your data.
3. Export to Your BI Tool
Once your dashboard wireframe is ready, use the BI Tool Export feature to send it directly to Power BI or Tableau for further analysis and enhancements. You can also download the dashboard as a PDF, PNG, or JPEG, embed it on a platform, or invite your team to collaborate.
Note: This is a Pro template. You’ll need a Pro subscription on Mokkup to use and customize this dashboard wireframe. Upgrade anytime to unlock full access.
Patient Nutrition Overview Dashboard Example
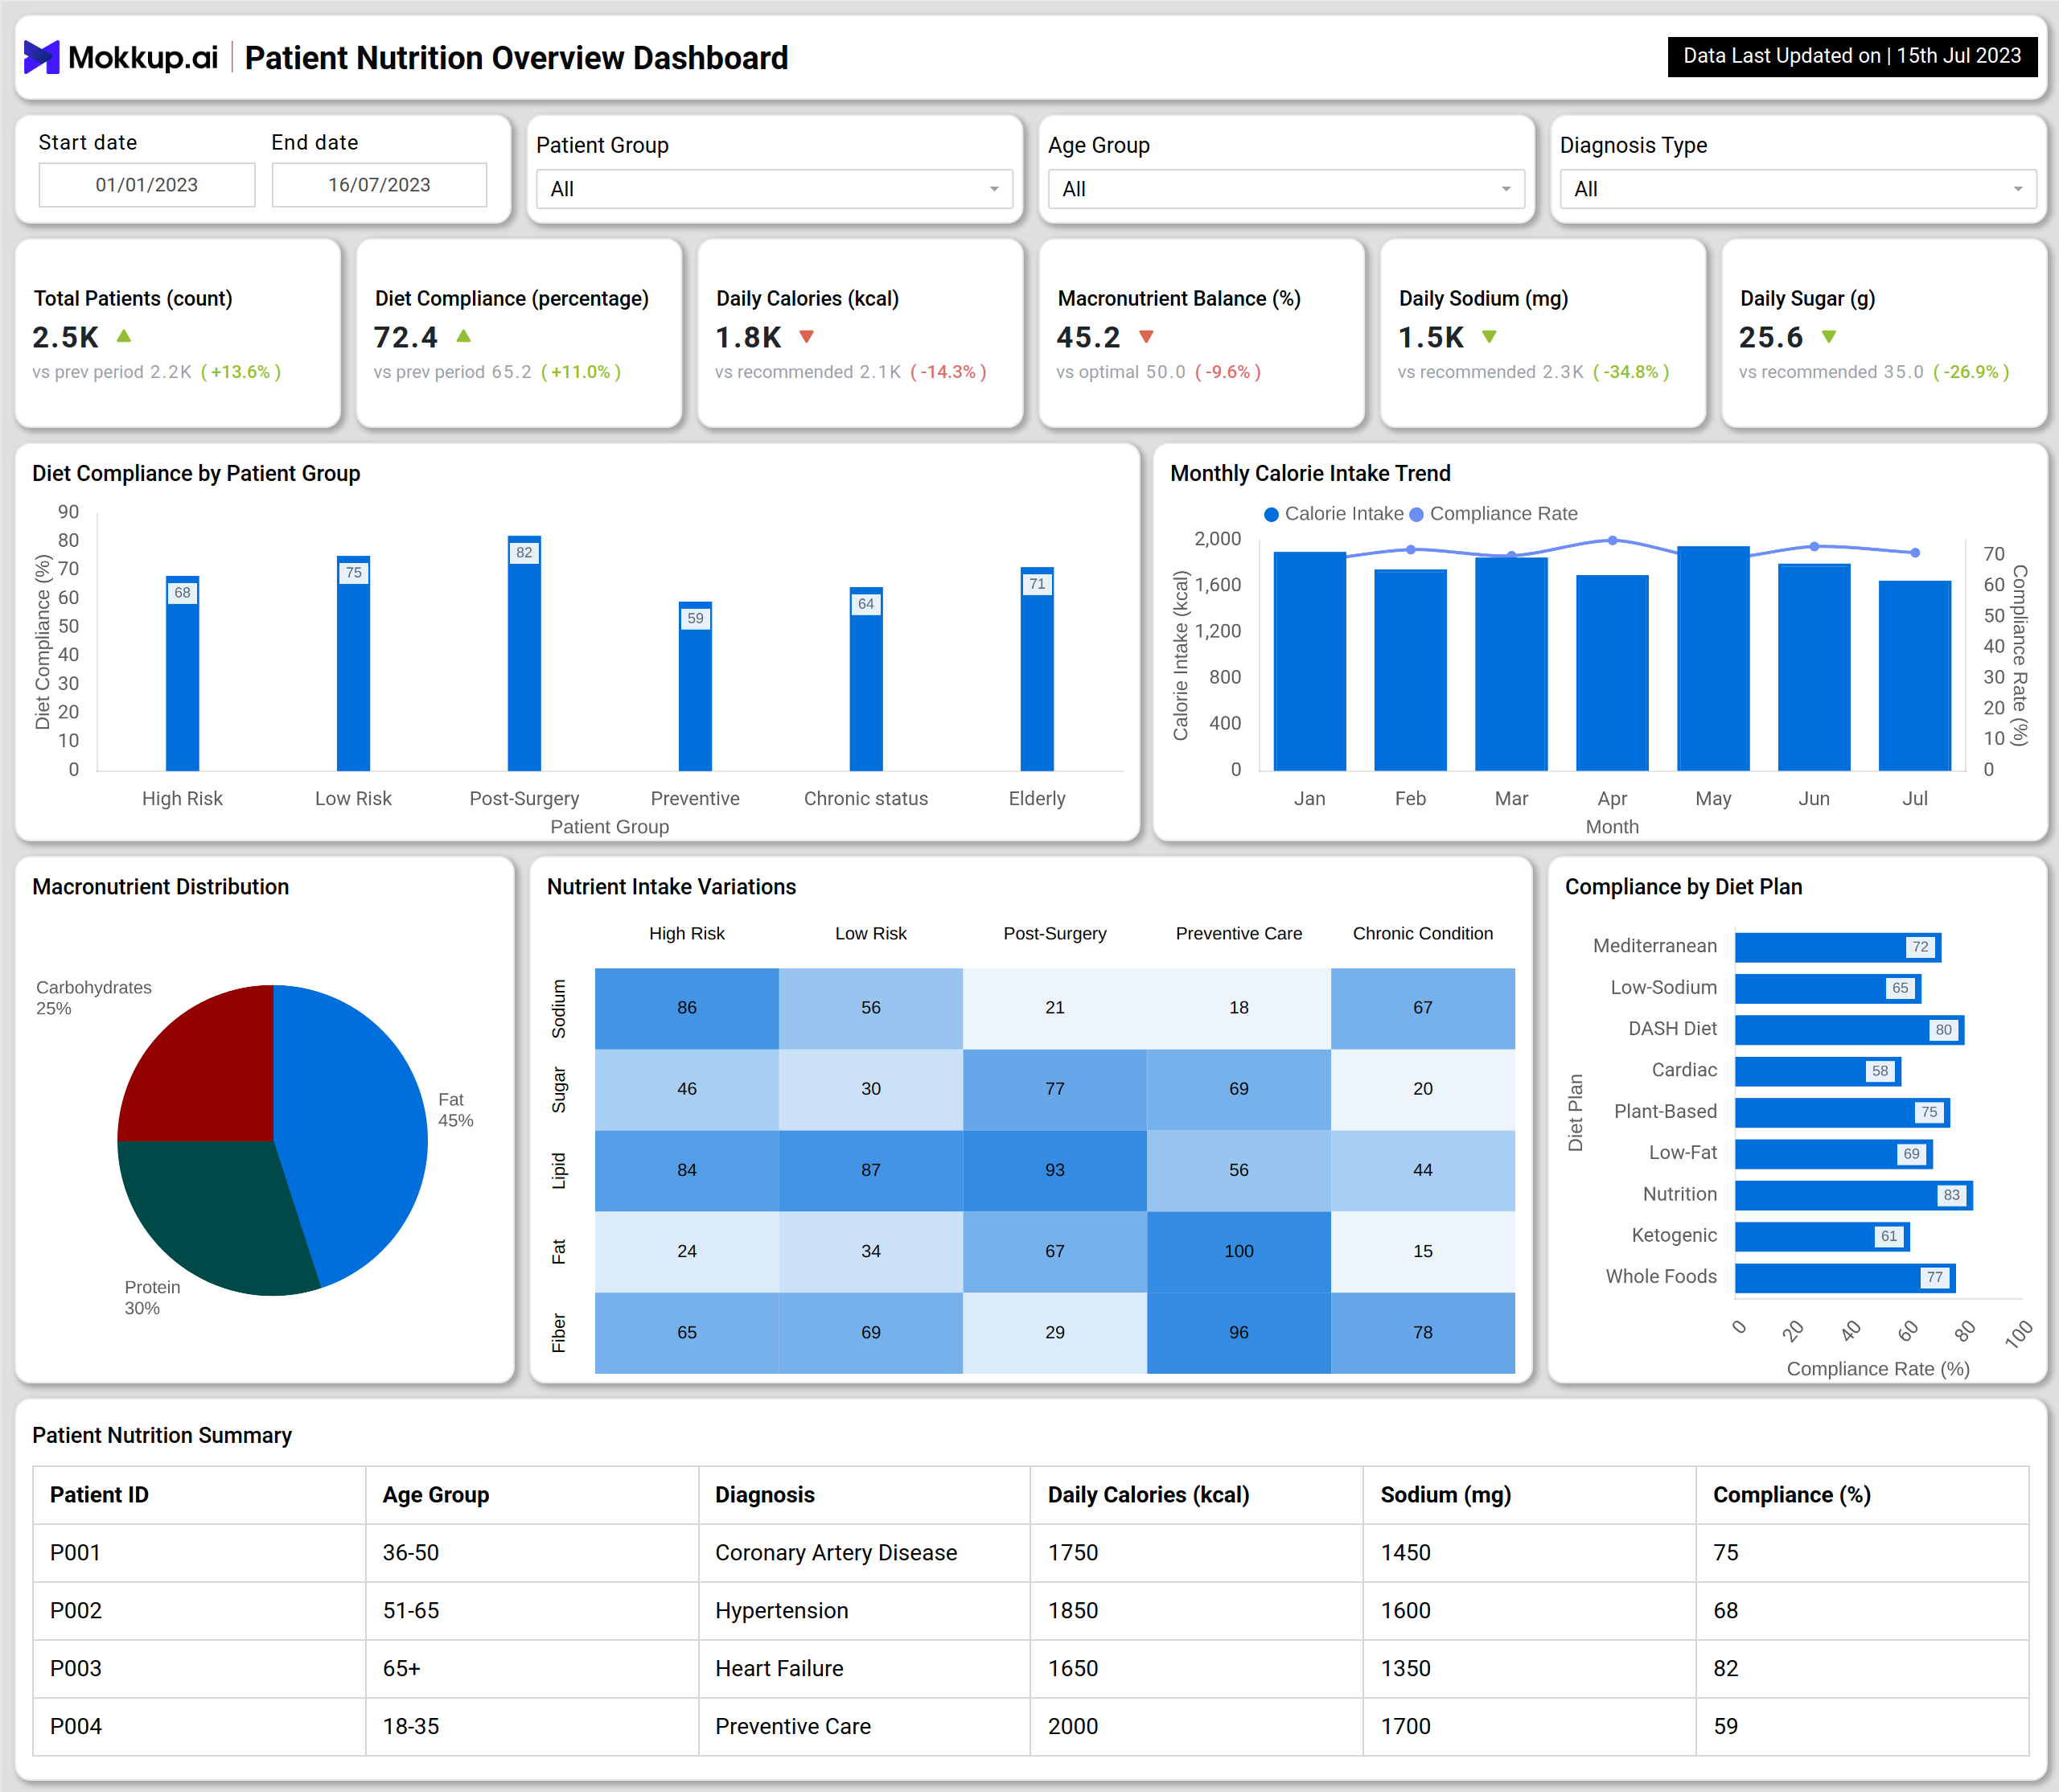
The example dashboard highlights essential nutrition and compliance metrics for different patient groups. At the top, KPIs track total patients, diet compliance percentage, daily calories, macronutrient balance, sodium intake, and sugar levels. These metrics provide quick insights into whether patients are meeting dietary recommendations.
The Diet Compliance by Patient Group bar chart breaks down adherence across high-risk, low-risk, post-surgery, preventive, chronic, and elderly groups. A Daily Calorie Intake Trend chart shows calorie levels alongside compliance rates over time, helping identify variations in dietary consistency.
Other visuals include a Macronutrient Distribution pie chart highlighting the balance of carbohydrates, proteins, and fats in patients’ diets and a Nutrient Intake Variations heatmap, which compares sodium, sugar, fat, and fiber intake across different patient categories. The Compliance by Diet Plan bar chart evaluates adherence to dietary frameworks such as Mediterranean, low-sodium, DASH, plant-based, and ketogenic diets.
Finally, the Patient Nutrition Summary table offers individual-level insights, including age, diagnosis, calorie intake, sodium intake, and compliance rates. Together, these views make the nutrition compliance and performance dashboard a powerful tool for healthcare professionals.
How to Analyze Data in Patient Nutrition Overview Dashboards
Healthcare providers can leverage the patient nutrition overview dashboard template by:
- Tracking Compliance Trends – Use the real-time nutrition monitoring dashboard to identify whether patients are following prescribed diets.
- Reviewing Nutrient Balance – Analyze macronutrient ratios and daily calorie intake to ensure alignment with medical recommendations.
- Comparing Diet Plans – Treat the dashboard as an incident tracking and nutrition dashboard to evaluate which dietary plans yield higher compliance rates.
- Identifying At-Risk Patients – Use patient-level summaries to intervene early for those with low compliance or poor nutrient balance.
- Analyzing Patient Groups – Segment compliance by risk levels, age groups, or conditions to personalize nutritional strategies.
Benefits of Patient Nutrition Overview Dashboards
Implementing a Patient Nutrition Overview Dashboard provides significant benefits, including patient engagement:
- Improved Dietary Compliance: The patient nutrition overview dashboard template helps track adherence to prescribed nutrition plans.
- Personalized Nutrition Care: The real-time nutrition monitoring dashboard tailors dietary interventions for patients with high-risk and chronic conditions.
- Better Health Outcomes: Monitoring nutrient balance reduces risks of cardiovascular diseases, diabetes, and obesity.
- Data-Driven Interventions: The nutrition compliance and performance dashboard supports evidence-based clinical decisions.
- Early Risk Detection: It acts as an incident tracking and nutrition dashboard, identifying deviations early and preventing complications.
KPIs to Track in Patient Nutrition Overview Dashboards
The KPIs to track:
- Diet Compliance (%) – Measures patient adherence to prescribed nutrition plans across groups.
- Daily Calories (kcal) – Tracks average calorie intake versus recommended values for health management.
- Macronutrient Balance (%) – Evaluates the distribution of proteins, carbohydrates, and fats in patient diets.
- Daily Sodium (mg) – Monitors sodium intake, critical for managing hypertension and heart disease.
- Compliance by Diet Plan (%) – Assesses adherence to specific dietary programs such as DASH or Mediterranean.
Frequently Asked Questions
1. Why is a Patient Nutrition Overview Dashboard important?
It provides visibility into dietary compliance, calorie intake, and nutrient balance, ensuring better patient health management.
2. Which healthcare providers benefit most from this dashboard?
Hospitals, dietitians, wellness clinics, and chronic care facilities benefit from a nutrition compliance and performance dashboard.
3. Who can use a Patient Nutrition Overview Dashboard?
These dashboards are typically used by dietitians, nutritionists, hospital staff, and healthcare providers who need to monitor patient nutrition efficiently.