
What is a Patient Feedback & Satisfaction Dashboard?
A Patient Feedback & Satisfaction Dashboard is a digital reporting system that helps General Medicine and Multi-Specialty Hospitals measure how patients feel about their care experience. It collects survey responses, complaints, reviews, NPS scores, and operational data to present a view of patient sentiment. Hospitals use this dashboard to track satisfaction levels, service quality, and staff responsiveness. It acts as a hospital patient experience measurement dashboard, allowing leadership teams to identify service gaps, improve communication, and reduce unresolved complaints. By using structured scoring and trend analysis, hospitals can measure performance across departments, clinical services, and patient touchpoints. The dashboard supports quality improvement programs, strengthens patient relationships, and helps hospitals build a positive reputation in a competitive healthcare environment.
How to Create a Patient Feedback & Satisfaction Dashboard
You don’t need to build your report from scratch—just start with a ready-to-use dashboard template from Mokkup. Add in your data and export it however you like. Here’s how to do it:
1. Create or Log in to Your Mokkup Account
Start by signing up on Mokkup.ai using your email. If you already have an account, just log in, and you’ll be good to go.
2. Choose and Customize Your Dashboard Template
Find the Patient Feedback & Satisfaction Dashboard template in the Templates section. Use the drag-and-drop editor to adjust KPIs, edit filters, or add elements based on your data.
3. Export to Your BI Tool
Once your dashboard wireframe is ready, use the BI Tool Export feature to send it directly to Power BI or Tableau for further analysis and enhancements. You can also download the dashboard as a PDF, PNG, or JPEG, embed it on a platform, or invite your team to collaborate.
Note: This is a Pro template. You’ll need a Pro subscription on Mokkup to use and customize this dashboard wireframe. Upgrade anytime to unlock full access.
Patient Feedback & Satisfaction Dashboard Example
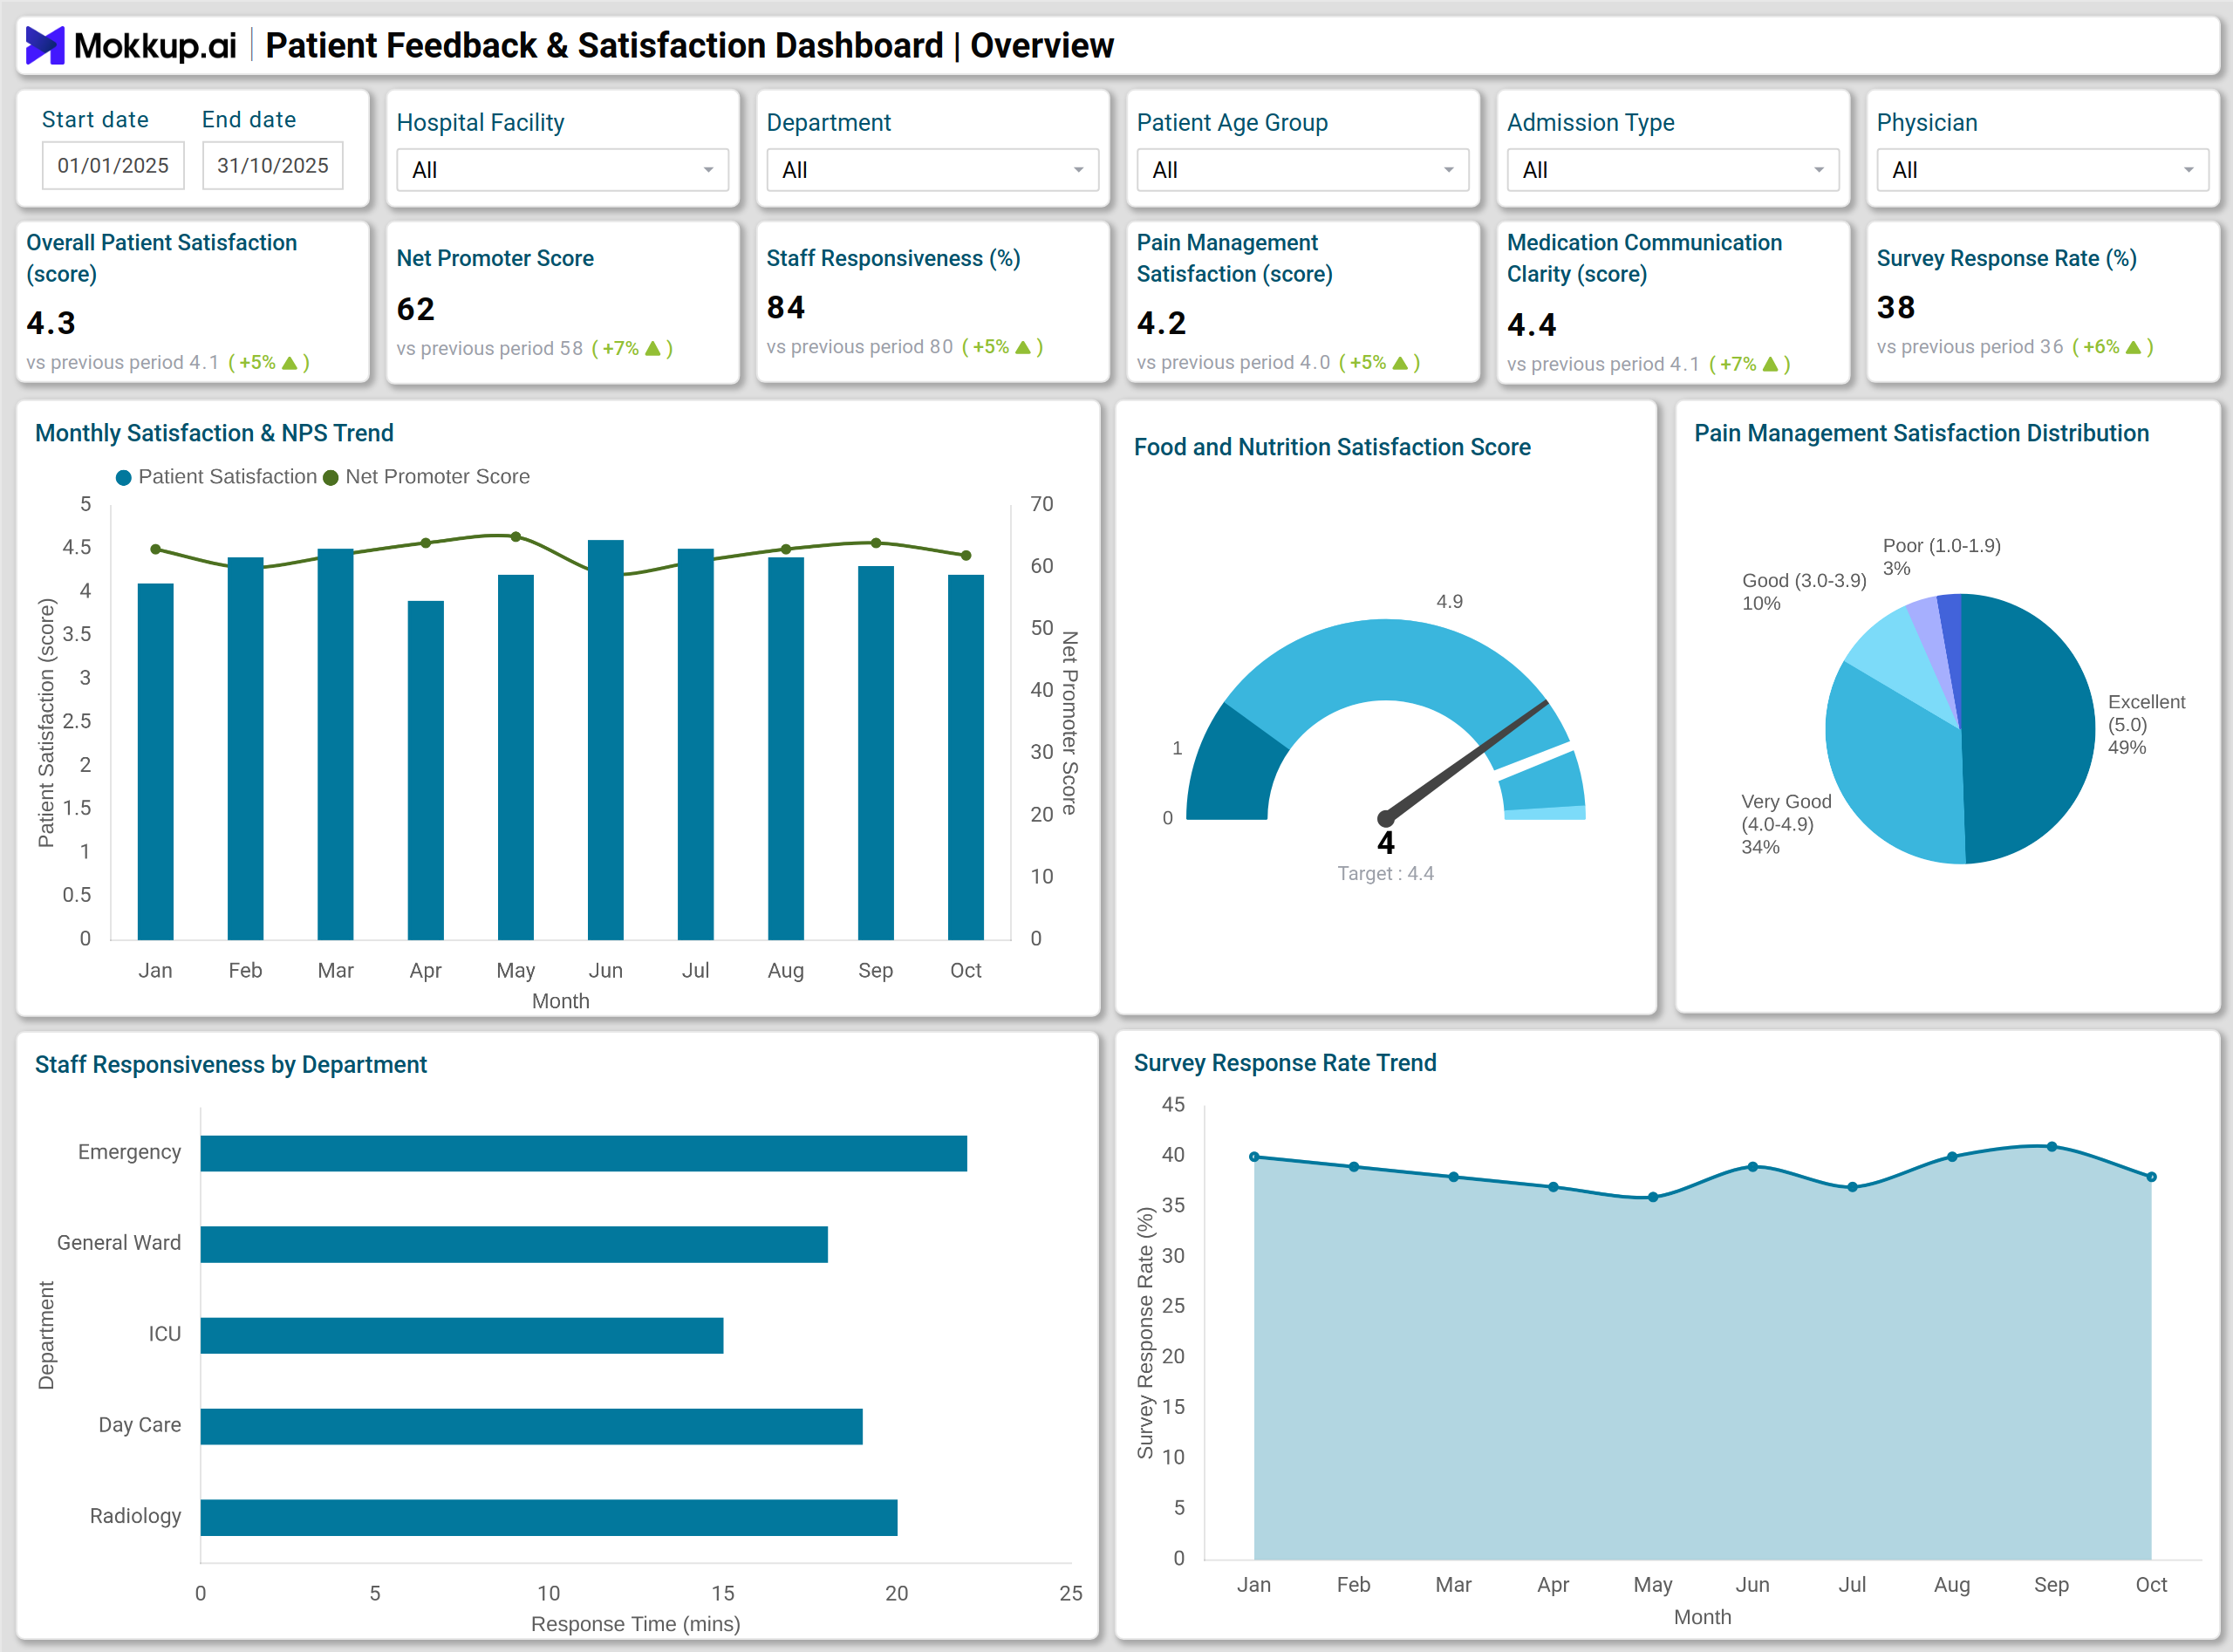
In a multi-specialty hospital, patient feedback is collected through discharge surveys, digital forms, QR-based feedback stations, and in-app reviews. Responses flow into a patient feedback monitoring system in healthcare, where the dashboard aggregates results and shows performance metrics.
The dashboard displays the Overall Patient Satisfaction Score, Net Promoter Score (NPS), Overall Rating of Hospital, and Communication About Medications. A Stacked Column Chart compares Satisfaction and NPS trends over weeks or months. The Bar Chart highlights Staff Responsiveness by department, showing which units respond quickly to patient needs. A Pie Chart tracks Pain Management Satisfaction distribution, while a Gauge Chart visualizes Food and Nutrition Satisfaction Score.
To support operational improvement, the dashboard shows complaint trends and investigation performance. A Heatmap visualizes Time to Resolution based on complaint type and severity. A Waterfall Chart shows complaint stages from registration to closure. A Treemap displays Root Causes such as delays, communication gaps, medication confusion, billing issues, and waiting times. With these visualizations, hospitals use patient satisfaction analytics to find reasons behind low scores and take corrective action.
How to Analyze Data in Patient Feedback & Satisfaction Dashboards
Here’s how hospital teams can make the most of insights within Patient Feedback & Satisfaction Dashboards:
- Spot Satisfaction Trends: Track Overall Satisfaction and NPS movements across time and service areas.
- Identify Slow Service Areas: Compare departments with delayed responses or frequent complaints.
- Understand Experience Differences: Review scores across OPD, IPD, Emergency, Surgery, and ICU to uncover variation in patient experience.
- Monitor Complaint Handling: Track complaint escalations, reopen rates, and closure quality to spot friction points.
- Check Resolution Efficiency: Analyze average time to resolution by issue type and severity.
- Evaluate Clinical Communication: Look at pain control satisfaction and clarity around medications and treatment plans.
- Track Improvement Impact: Review whether service improvement initiatives result in better scores over time.
- Benchmark Against Targets: Use long-term data trends to compare against internal standards and quality goals.
Benefits of Patient Feedback & Satisfaction Dashboards
Patient feedback dashboards empower hospitals with below benefits:
- Early Issue Detection: Catch declines in patient satisfaction before they escalate
- Targeted Staff Coaching: Improve teams with consistent low feedback
- Faster Complaint Closure: Reduce patient frustration and negative escalation
- Better Service Recovery: Handle unhappy patients before reviews turn public
- Stronger Patient Communication: Improve clarity and empathy across care teams
- Smoother Patient Journey: Spot friction points like discharge or billing
- Evidence for Quality Programs: Meet accreditation and audit expectations
- Smart Resource Allocation: Focus attention where patient experience needs it most
This type of dashboard enables a patient complaints and resolution tracking dashboard approach, ensuring that no feedback is missed and every issue moves through the resolution pipeline.
KPIs to Track in Patient Feedback & Satisfaction Dashboards
Key KPIs help hospitals measure patient experience objectively and pinpoint areas for improvement:
- Overall Patient Satisfaction (Average Score): Mean score from patient surveys and review forms
- Net Promoter Score (NPS): Measures likelihood of patients recommending the hospital
- Staff Responsiveness: Average response time or top-box percentage rating
- Pain Management Satisfaction: Rating of pain control and comfort levels
- Communication About Medications: Clarity of instructions, dosage, and side effects
- Overall Rating of Hospital (0–10): Direct score shared by discharged patients
- Survey Response Rate (%): Percentage of patients completing feedback surveys
These KPIs represent industry standards for a healthcare patient experience KPIs and metrics dashboard, helping hospitals measure service performance with objective data.
Frequently Asked Questions
1. Who uses a Patient Feedback & Satisfaction Dashboard?
Hospital leadership teams, medical directors, nursing heads, quality teams, and patient experience managers use it for operational and service monitoring.
2. Can it track department-level performance?
Yes. It shows ratings and responsiveness for departments such as OPD, IPD, Nursing, Emergency, Surgery, and ICU.
3. Why is Time to Resolution an important KPI?
It measures how quickly the hospital solves issues, reduces dissatisfaction, and prevents escalation.
4. Can this dashboard improve online reviews and reputation?
Yes. Faster complaint handling and service recovery improve satisfaction and reduce negative feedback.