
What is a Neurology Outcomes Dashboard?
A Neurology Outcomes Dashboard is a centralized platform for healthcare neurology analytics and clinical outcomes tracking for neurology clinics. It monitors patient diagnosis accuracy, treatment completion, symptom improvement, readmission rates, and adverse events. The dashboard supports patient progress monitoring and operational oversight, allowing clinics to identify gaps in care. By combining clinical and operational data, the Neurology Outcomes Dashboard enables proactive interventions, optimized treatment pathways, and real-time insights to improve patient outcomes and clinic performance.
How to Create a Neurology Outcomes Dashboard
You don’t need to build your report from scratch-just start with a ready-to-use dashboard template from Mokkup. Add your data and export it as needed. Here’s how to do it:
1. Create or Log in to Your Mokkup Account
Start by signing up on Mokkup.ai using your email. If you already have an account, simply log in, and you’ll be all set.
2. Choose and Customize Your Dashboard Template
Find the Neurology Outcomes Dashboard template in the Templates section. Use the drag-and-drop editor to adjust KPIs, edit filters, or add elements based on your data.
3. Export to Your BI Tool
Once your dashboard wireframe is ready, use the BI Tool Export feature to send it directly to Power BI or Tableau for further analysis and enhancements. You can also download the dashboard as a PDF, PNG, or JPEG, embed it on a platform, or invite your team to collaborate.
Note: This is a Pro template. You’ll need a Pro subscription on Mokkup to use and customize this dashboard wireframe. Upgrade anytime to unlock full access.
Neurology Outcomes Dashboard Example
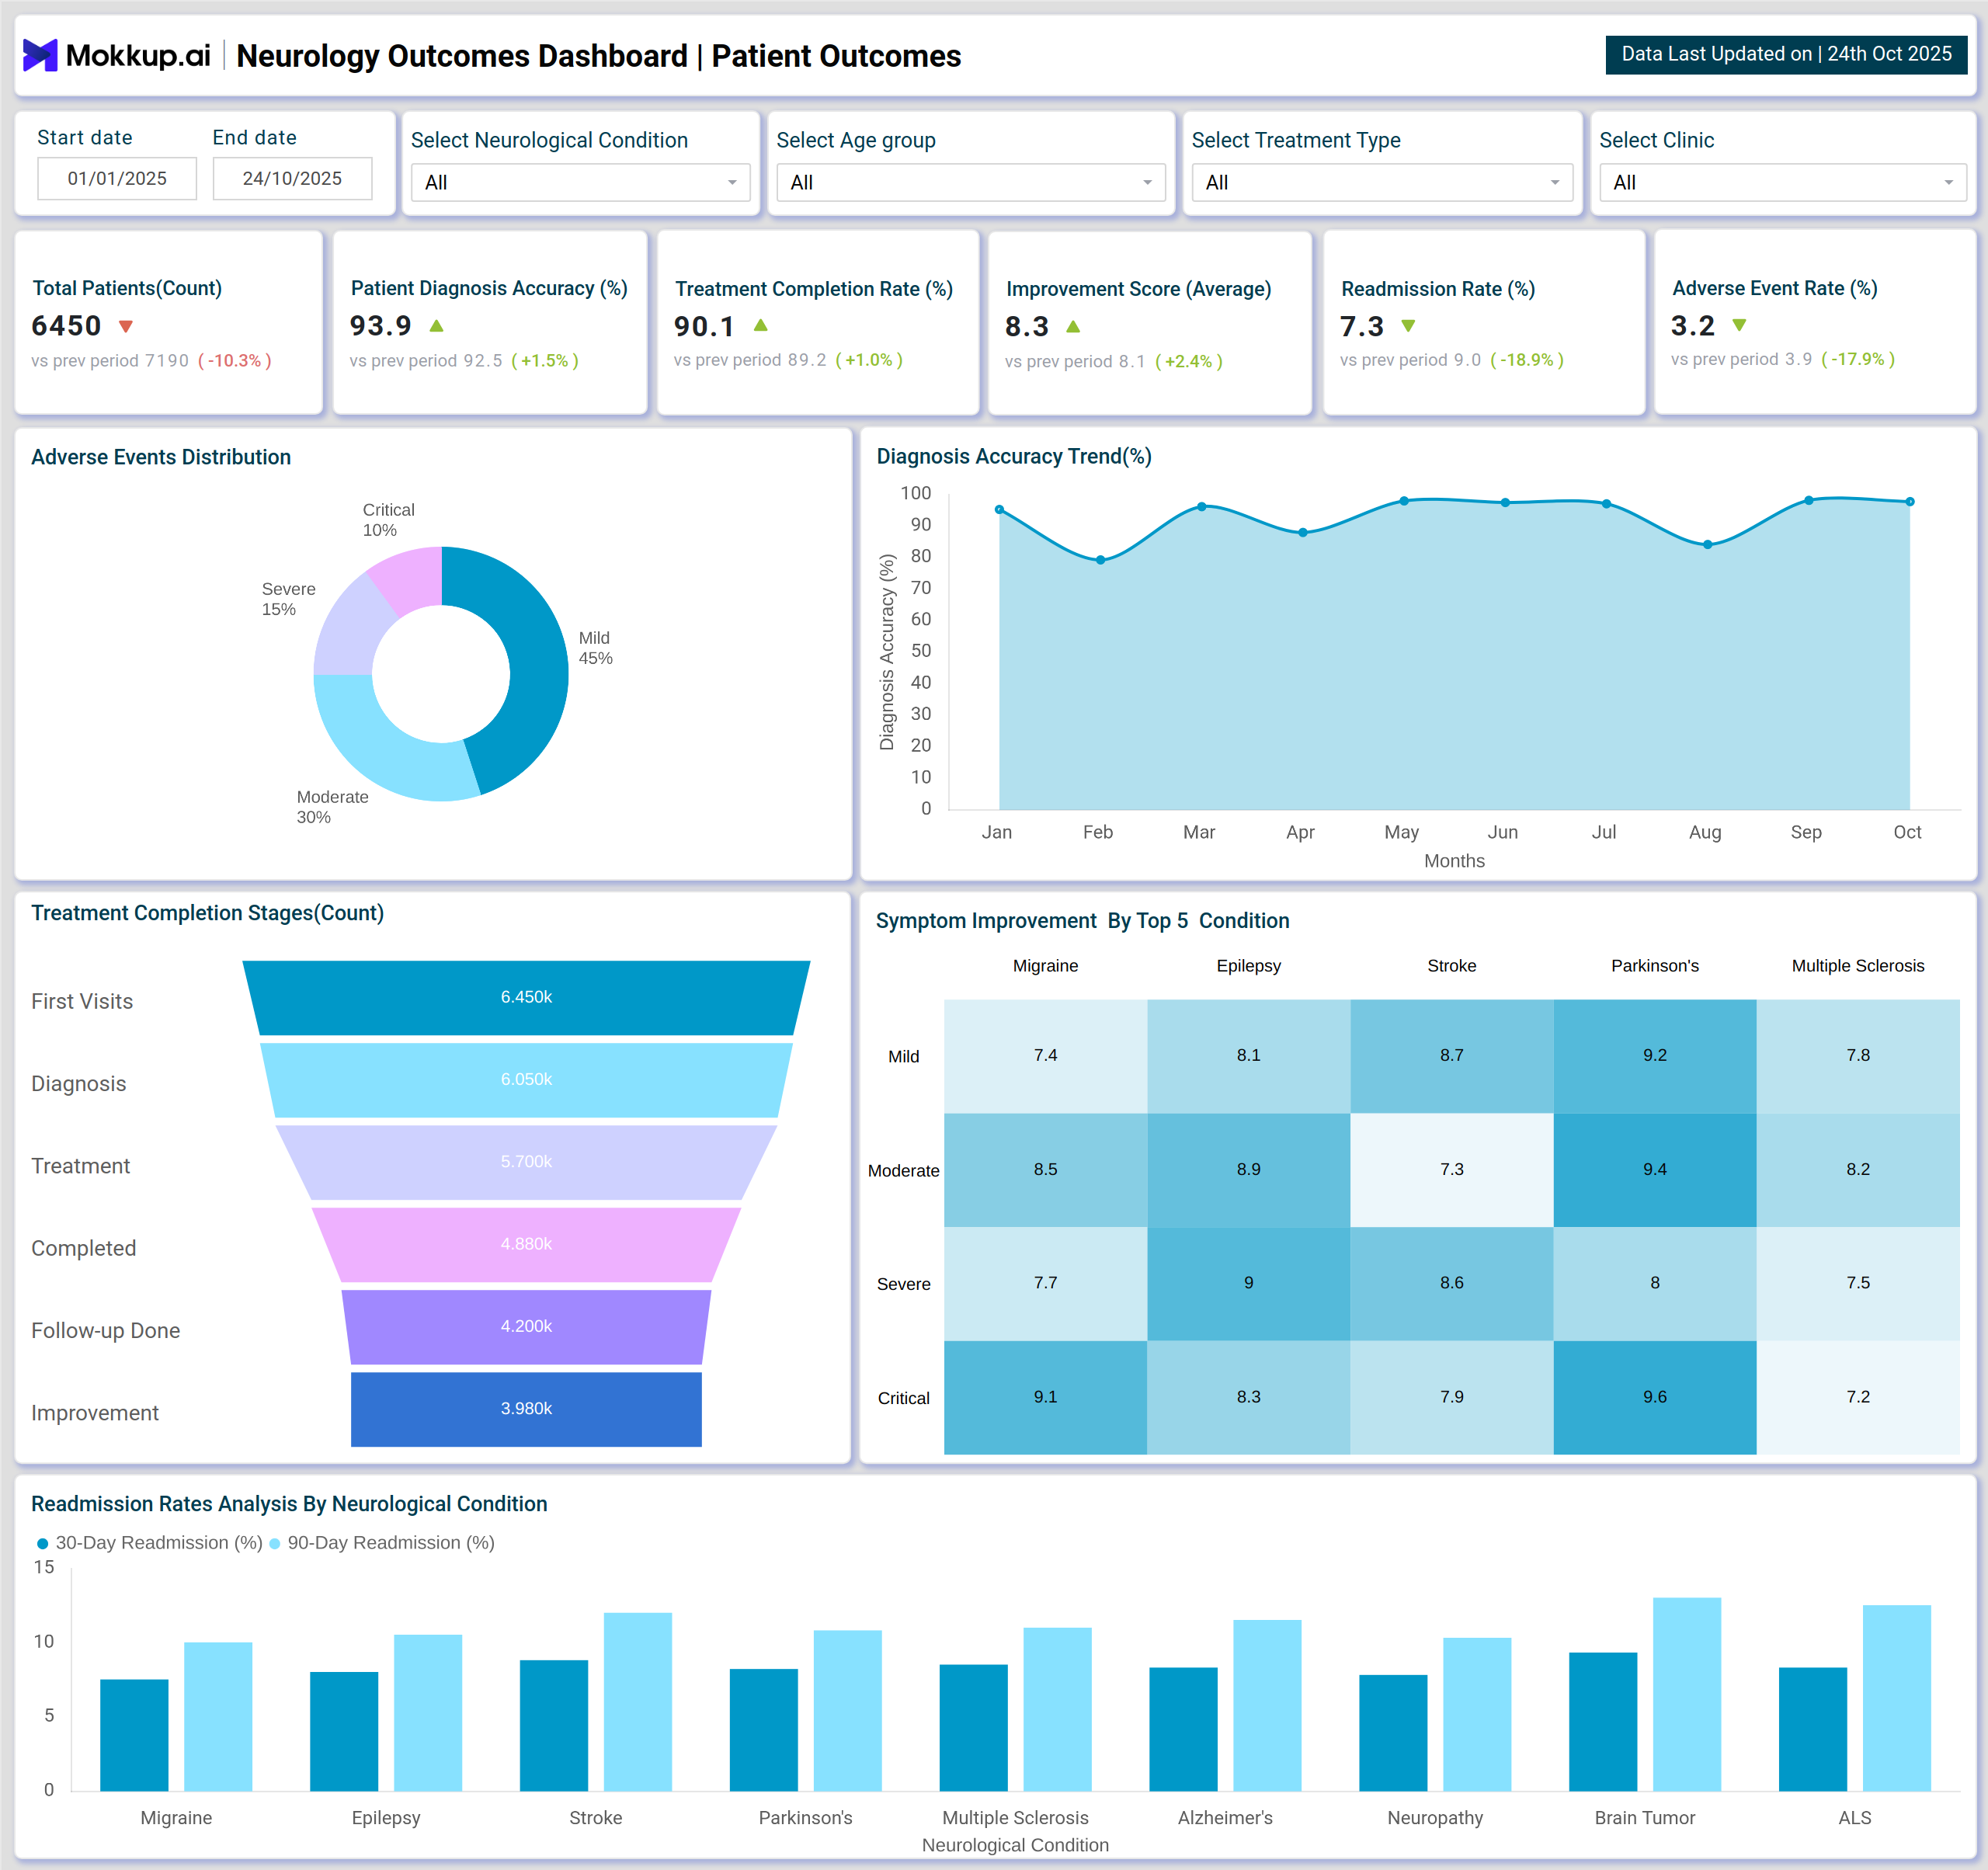
The Neurology Outcomes Dashboard features two key views designed to enhance clinical and operational decision-making. The Patient Outcomes Screen tracks metrics such as diagnosis accuracy, treatment completion, symptom improvement, readmission trends, adverse event rates, and follow-up compliance. It helps identify patients or clinics with care gaps, enabling timely clinical decisions through healthcare neurology analytics. The Treatment Efficiency Screen focuses on time to diagnosis, treatment drop-outs, symptom recovery, readmission costs, adverse event severity, and patient satisfaction. Insights from this view drive operational improvements, optimize treatment pathways, and support resource allocation for better clinical outcomes across neurology clinics.
How to Analyse Data in a Neurology Outcomes Dashboard
To extract meaningful insights and improve decision-making, follow these key steps while analyzing your Neurology Outcomes Dashboard:
- Start with KPIs: Monitor critical metrics like diagnosis accuracy, treatment completion, and follow-up compliance.
- Assess Clinical Efficiency: Compare patient outcomes across conditions, clinics, and cohorts to identify gaps.
- Track Cost & Resource Trends: Detect high-cost treatments or underperforming clinics to optimize spending.
- Analyze Patient & Clinic Insights: Use charts, maps, and heatmaps to visualize progress and identify areas for intervention.
- Detect Patterns & Anomalies: Apply filters by time period, condition, age group, or treatment type to find recurring issues.
Benefits of a Neurology Outcomes Dashboard
A Neurology Outcomes Dashboard offers measurable advantages for both clinical and operational teams, helping improve patient outcomes and streamline processes:
- Gain Updated Insights: Access up-to-date data on patient outcomes and clinic performance to make timely, informed decisions.
- Improve Treatment Adherence: Track follow-up compliance and early interventions to enhance patient care and recovery rates.
- Identify High-Risk Patients: Detect patterns in readmissions and adverse outcomes to reduce risk and improve long-term results.
- Enhance Operational Efficiency: Monitor workflow and resource utilization to streamline processes and eliminate bottlenecks.
- Strengthen Outcomes Tracking: Consolidate metrics across departments for consistent and accurate clinical monitoring.
- Enable Data-Driven Decisions: Use centralized insights to promote transparency and collaboration across neurology clinics.
KPIs to Track in a Neurology Outcome Dashboard
Track these KPIs to understand treatment effectiveness, operational efficiency, and overall patient progress:
- Patient Diagnosis Accuracy (%) - Percentage of patients whose initial diagnosis is confirmed correct after follow-ups, supporting patient progress monitoring.
- Treatment Completion Rate (%) - Proportion of patients who complete the full prescribed treatment plan, reflecting treatment efficiency insights.
- Symptom Improvement Score (Avg) - Average improvement in patient-reported symptoms over the treatment period, aiding patient progress monitoring.
- Follow-up Compliance (%) - Percentage of patients who attend all their scheduled follow-up visits, key for patient progress monitoring.
- Average Time to Diagnosis (Days) - Average number of days taken from first consultation to confirmed diagnosis, providing treatment efficiency insights.
- Treatment Drop-Out Rate (%) - Percentage of patients who discontinue treatment before completion, highlighting areas for treatment efficiency insights.
- Average Symptom Recovery Time (Days) - Average time patients take to reach their target symptom improvement, supporting patient progress monitoring.
Frequently Asked Questions
Q1: How does a Neurology Outcomes Dashboard improve patient care?
It helps clinics track diagnosis accuracy, treatment progress, and follow-up compliance, enabling early interventions and better patient outcomes.
Q2: What kind of insights can healthcare teams gain from this dashboard?
Teams can identify care gaps, monitor resource utilization, evaluate treatment efficiency, and enhance overall neurology clinic performance through data-driven insights.
Q3: Who can benefit the most from using a Neurology Outcomes Dashboard?
Pharmacists, neurologists, clinic administrators, and quality teams can all use the dashboard to monitor performance, identify care gaps, and enhance decision-making.