
What is a Natural Gas Distribution Enterprise Performance Dashboard?
A natural gas enterprise performance dashboard is a centralized analytics solution that provides a comprehensive view of financial, operational, and compliance performance across gas distribution utilities. It consolidates key enterprise-level metrics such as revenue, EBITDA margin, network availability, safety performance, and regulatory compliance into a single interface. This gas distribution enterprise analytics dashboard enables executives to monitor overall business health, track performance against targets, and identify trends across multiple operational areas. By integrating data from finance, operations, safety, and customer systems, the dashboard supports real-time decision-making. A gas utility enterprise performance dashboard is essential for aligning operational efficiency with financial outcomes while ensuring compliance with regulatory standards.
How to Create a Natural Gas Distribution Enterprise Performance Dashboard
You don't need to build your report from scratch; just start with a ready-to-use dashboard template from Mokkup. Add in your data and export it however you like. Here's how to do it:
1. Create or Log in to Your Mokkup Account
Start by signing up on Mokkup.ai using your email. If you already have an account, just log in, and you'll be good to go.
2. Choose and Customize Your Dashboard Template
Find the Natural Gas Distribution Enterprise Performance Dashboard template in the Templates section. Use the drag-and-drop editor to adjust KPIs, edit filters, or add elements based on your data.
3. Export to Your BI Tool
Once your dashboard wireframe is ready, use the BI Tool Export feature to send it directly to Power BI or Tableau for further analysis and enhancements. You can also download the dashboard as a PDF, PNG, or JPEG, embed it on a platform, or invite your team to collaborate.
Note: This is a Pro template. You'll need a Pro subscription on Mokkup to use and customize this dashboard wireframe. Upgrade anytime to unlock full access.
Natural Gas Distribution Enterprise Performance Dashboard Example
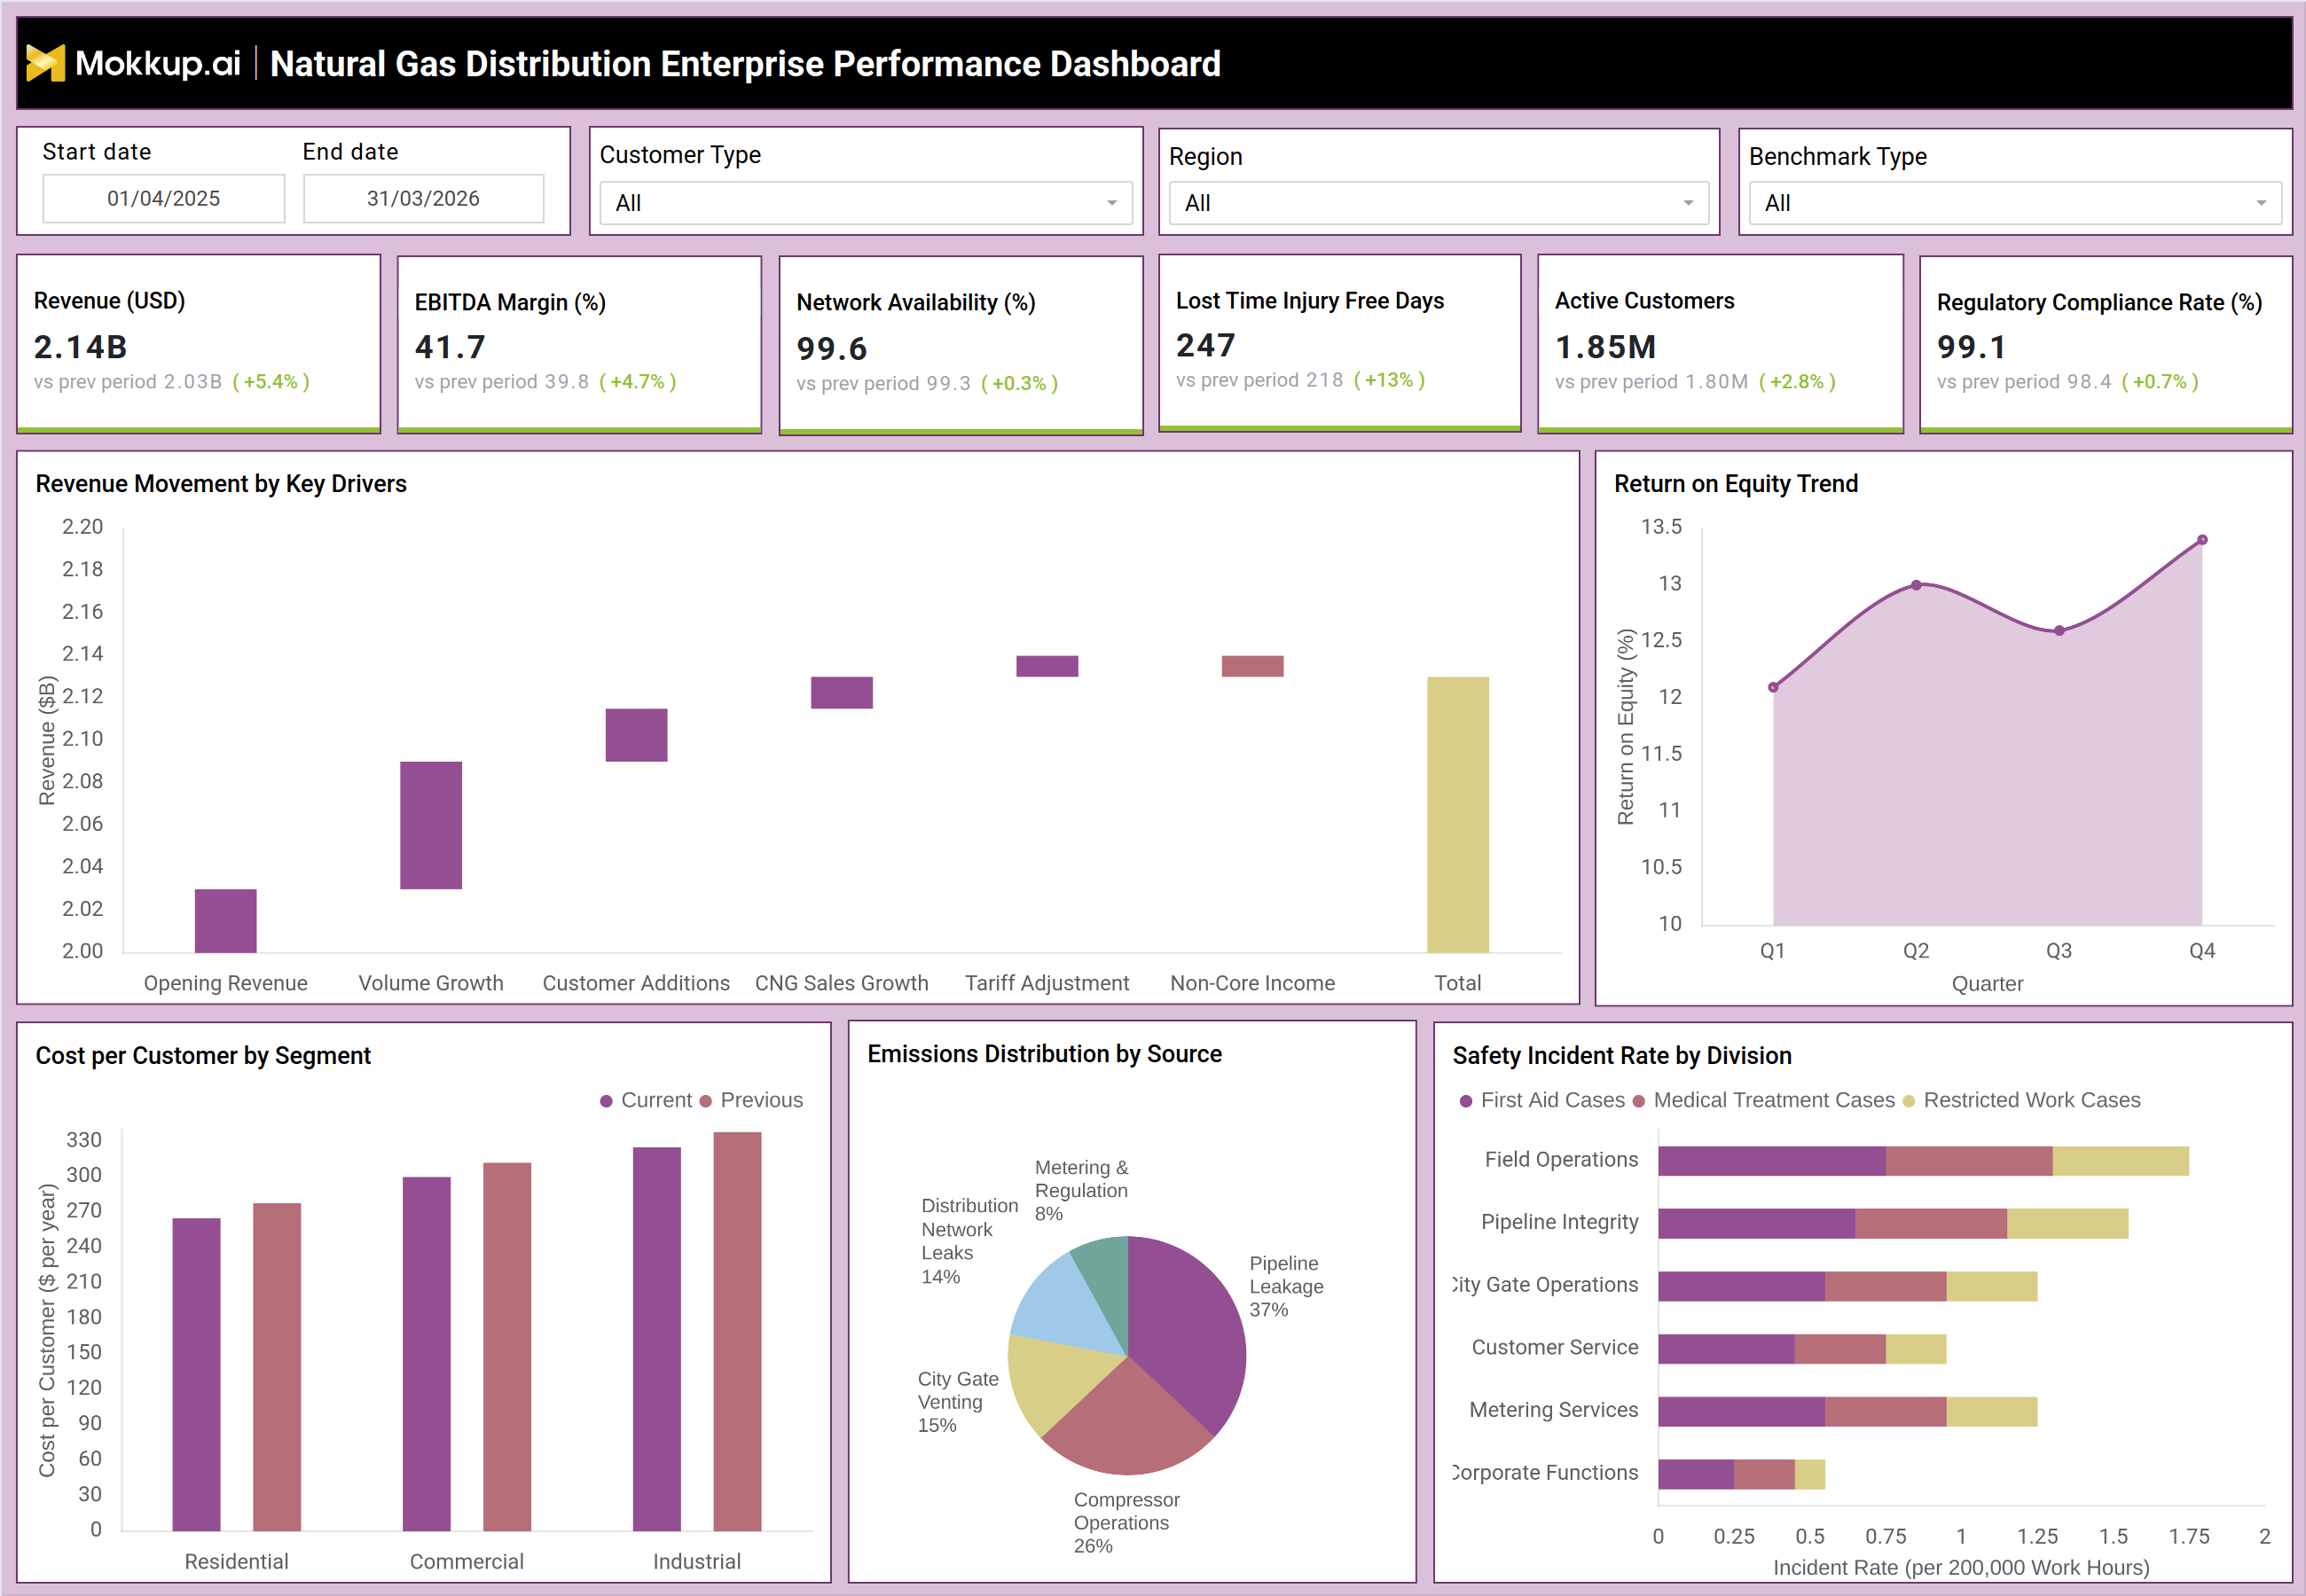
A typical natural gas distribution KPI dashboard presents high-level metrics that define enterprise performance. For example, revenue is tracked at $2.14B with a 5.4% increase, while EBITDA margin stands at 41.7%, reflecting strong profitability. Network availability at 99.6% indicates high operational reliability, and regulatory compliance at 99.1% ensures adherence to industry standards. The dashboard also includes a revenue movement analysis, breaking down key drivers such as volume growth, customer additions, tariff adjustments, and non-core income.
This helps leadership understand how different factors contribute to overall revenue performance. Return on equity (ROE) trends provide insight into financial efficiency over time, while cost per customer by segment highlights cost distribution across residential, commercial, and industrial customers. Emissions distribution analysis identifies environmental impact sources such as pipeline leakage and compressor operations. Additionally, safety incident rates across divisions help monitor workplace safety and operational risks. This gas utility performance monitoring dashboard ensures a balanced view of financial, operational, and safety performance.
How to Analyze Data in Natural Gas Distribution Enterprise Performance Dashboard
Here is how you can analyze data from this dashboard:
- Track revenue trends and growth drivers to understand financial performance
- Analyze EBITDA margin to evaluate profitability efficiency
- Monitor network availability to ensure operational reliability
- Evaluate customer growth metrics to assess business expansion
- Review regulatory compliance rates to ensure adherence to standards
- Analyze return on equity trends for financial efficiency insights
- Compare the cost per customer by segment to identify cost optimization opportunities
- Evaluate emissions distribution to monitor environmental impact
- Track safety incident rates by division to identify risk-prone areas
- Correlate operational metrics with financial outcomes for strategic insights
Benefits of Natural Gas Distribution Enterprise Performance Dashboard
The following are the benefits of using this dashboard:
- Provides end-to-end visibility into enterprise performance
- Aligns financial and operational metrics in a single view
- Improves decision-making using real-time insights
- Enhances profitability tracking and cost optimization
- Strengthens regulatory compliance monitoring
- Supports risk management through safety and emissions tracking
- Enables performance benchmarking across business units
- Improves resource allocation and operational efficiency
- Facilitates strategic planning with data-driven insights
- Enhances monitoring using natural gas operations performance dashboard capabilities
KPIs to Track in Natural Gas Distribution Enterprise Performance Dashboard
The following key KPIs can be tracked by using this dashboard:
- Revenue (USD) – Measures total revenue generated, indicating overall business performance and growth
- EBITDA Margin (%) – Tracks profitability by measuring earnings before interest, taxes, depreciation, and amortization
- Network Availability (%) – Indicates reliability of the gas distribution network and operational uptime
- Lost Time Injury Free Days – Measures workplace safety by tracking the number of days without injury incidents
- Active Customers – Tracks total number of customers served, reflecting business scale and growth
- Regulatory Compliance Rate (%) – Measures adherence to regulatory and operational standards
- Revenue Movement by Key Drivers – Breaks down revenue changes by contributing factors such as volume growth and pricing
- Return on Equity (ROE) (%) – Indicates financial efficiency and returns generated on shareholder equity
- Cost per Customer by Segment – Tracks cost distribution across residential, commercial, and industrial segments
- Emissions Distribution by Source – Identifies environmental impact sources such as leaks and operational processes
- Safety Incident Rate by Division – Measures safety performance across different operational units
Frequently Asked Questions
1. Why is a natural gas enterprise performance dashboard important?
It provides a unified view of financial, operational, and compliance metrics, enabling better strategic decision-making.
2. How does a gas distribution enterprise analytics dashboard improve performance?
It identifies inefficiencies, tracks KPIs, and aligns business operations with financial goals.
3. What data sources are used in this dashboard?
Financial systems, operational databases, safety logs, and regulatory reporting systems are integrated.
4. What KPIs can be tracked in a natural gas distribution enterprise performance dashboard?
Key KPIs include revenue, EBITDA margin, network availability, lost time injury free days, active customers, regulatory compliance rate, return on equity, cost per customer by segment, emissions distribution by source, and safety incident rate by division.
5. Can this dashboard be exported to BI tools like Power BI or Tableau?
Yes, once your dashboard wireframe is ready, you can use the BI Tool Export feature to send it directly to Power BI or Tableau for further analysis and enhancements.