
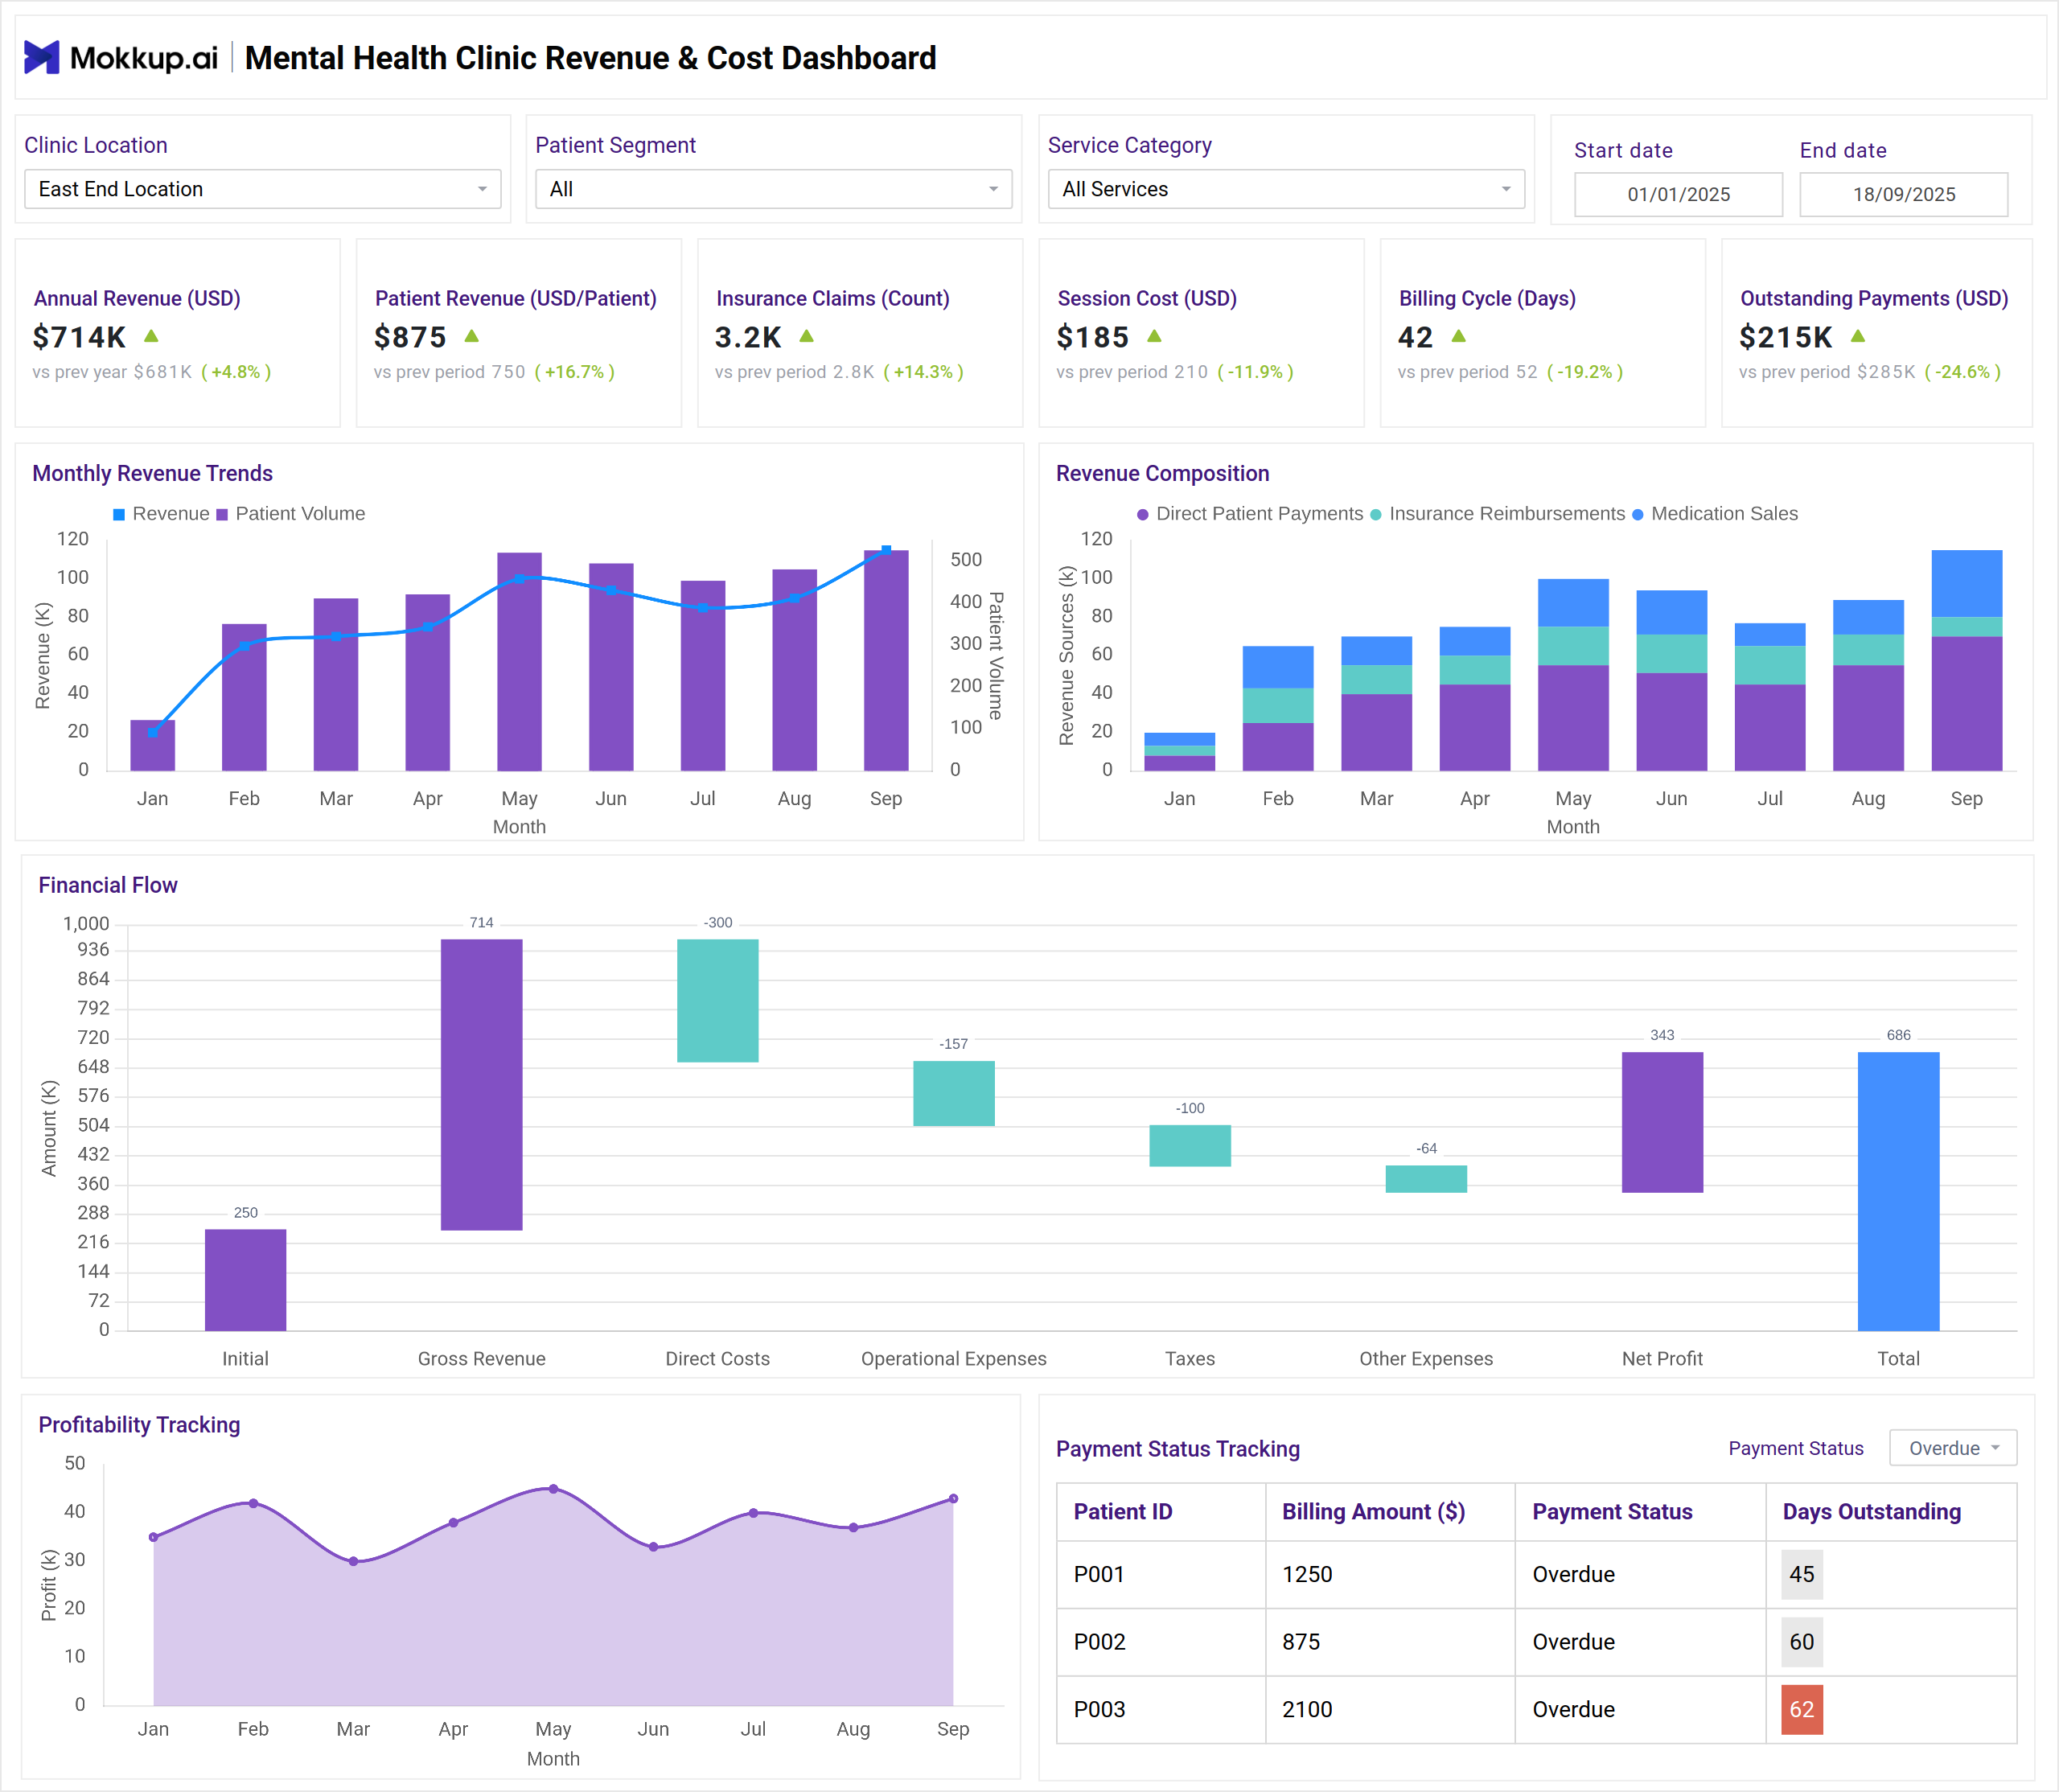
What is a Mental Health Clinic Revenue & Cost Dashboard?
A Mental Health Clinic Revenue & Cost Dashboard template is a healthcare finance analytics tool that provides real-time visibility into revenue streams, patient payments, insurance reimbursements, and operational costs. It consolidates key KPIs such as annual revenue, patient revenue per visit, insurance claims, session costs, billing cycle length, outstanding payments, and net profit. By centralizing data, this dashboard wireframe helps mental health clinics evaluate financial health, optimize billing efficiency, and improve cash flow. As a real-time clinic finance monitoring dashboard, it empowers administrators, CFOs, and investors to make data-driven decisions for sustainable growth.
How to Create a Mental Health Clinic Revenue & Cost Dashboard
You don’t need to build your report from scratch—just start with a ready-to-use Mental Health Clinic Revenue & Cost dashboard template from Mokkup. Add in your data and export it however you like. Here’s how to do it:
1. Create or Log in to Your Mokkup Account
Start by signing up on Mokkup.ai using your email. If you already have an account, just log in, and you’ll be good to go.
2. Choose and Customize Your Dashboard Template
Find the Mental Health Clinic Revenue & Cost Dashboard template in the Templates section. Use the drag-and-drop editor to adjust KPIs, edit filters, or add elements based on your data.
3. Export to Your BI Tool
Once your dashboard wireframe is ready, use the BI Tool Export feature to send it directly to Power BI or Tableau for further analysis and enhancements. You can also download the dashboard as a PDF, PNG, or JPEG, embed it on a platform, or invite your team to collaborate.
Note: This is a Pro template. You’ll need a Pro subscription on Mokkup to use and customize this dashboard wireframe. Upgrade anytime to unlock full access.
Mental Health Clinic Revenue & Cost Dashboard Example
The Mental Health Clinic Revenue & Cost Dashboard provides a complete picture of a clinic’s financial health by combining revenue streams, costs, and payment status into one view. It begins with Monthly Revenue Trends, showing how revenue grows alongside patient volume and helping leaders recognize seasonal patterns. This is followed by Revenue Composition, which breaks down income sources such as patient payments, insurance reimbursements, and medication sales. To dive deeper into profitability, the Financial Flow Waterfall maps the journey from gross revenue through direct costs, operational expenses, and taxes to net profit, making it easy to see where money is earned and spent.
Alongside this, a Profitability Tracking Line Chart highlights fluctuations in margins over time, while the Payment Status Table provides visibility into overdue payments, billing amounts, and days outstanding. Together, these elements create a financial dashboard wireframe that not only tracks revenue and costs but also helps clinics strengthen receivables management and long-term profitability.
How to Analyze Data in Revenue & Cost Dashboards
Organizations can use the Mental Health Clinic Revenue & Cost Dashboard template by:
- Tracking Revenue Growth: Compare monthly revenue with patient volumes.
- Monitoring Insurance Claims: Identify approval/rejection patterns and claim delays.
- Evaluating Profitability: Use waterfall analysis to compare costs vs. revenue.
- Reducing Outstanding Payments: Monitor overdue bills by patient or service type.
- Optimizing Session Costs: Assess cost per session to balance affordability with margins.
- Shortening Billing Cycles: Measure average collection times for faster cash flow.
Benefits of Revenue & Cost Dashboards
Adopting a Revenue & Cost Dashboard provides healthcare organizations with multiple advantages:
- Improved Financial Visibility: Consolidates key revenue and expense KPIs.
- Optimized Cash Flow: Tracks overdue payments and reduces billing delays.
- Profitability Insights: Waterfall and trend charts reveal hidden cost drivers.
- Operational Efficiency: Identifies inefficiencies in insurance and patient billing.
- Investor Confidence: Provides transparent financial reporting for stakeholders.
KPIs to Track in Revenue & Cost Dashboards
These key performance indicators give mental health clinics a clear picture of financial performance:
- Annual Revenue (USD): Measures overall clinic income.
- Patient Revenue (USD/Patient): Tracks average revenue per patient visit.
- Insurance Claims (Count): Monitors submitted and reimbursed claims.
- Session Cost (USD): Tracks cost per patient session.
- Billing Cycle (Days): Measures average payment collection time.
- Outstanding Payments (USD): Identifies overdue amounts pending collection.
- Net Profit (%): Shows profitability after all costs and taxes.
Frequently Asked Questions
Q1. Why is a Revenue & Cost Dashboard important for mental health clinics?
It gives real-time visibility into financial performance, enabling better cost control and revenue optimization.
Q2. Which types of clinics benefit most from this dashboard?
Psychiatric hospitals, behavioral health centers, outpatient clinics, and counseling practices.
Q3. Do I need a finance background to use this dashboard?
No. The Mental Health Clinic Revenue & Cost Dashboard is designed with easy-to-read charts, KPIs, and visualizations, so clinic managers, administrators, and non-financial staff can understand financial performance without deep accounting expertise.