
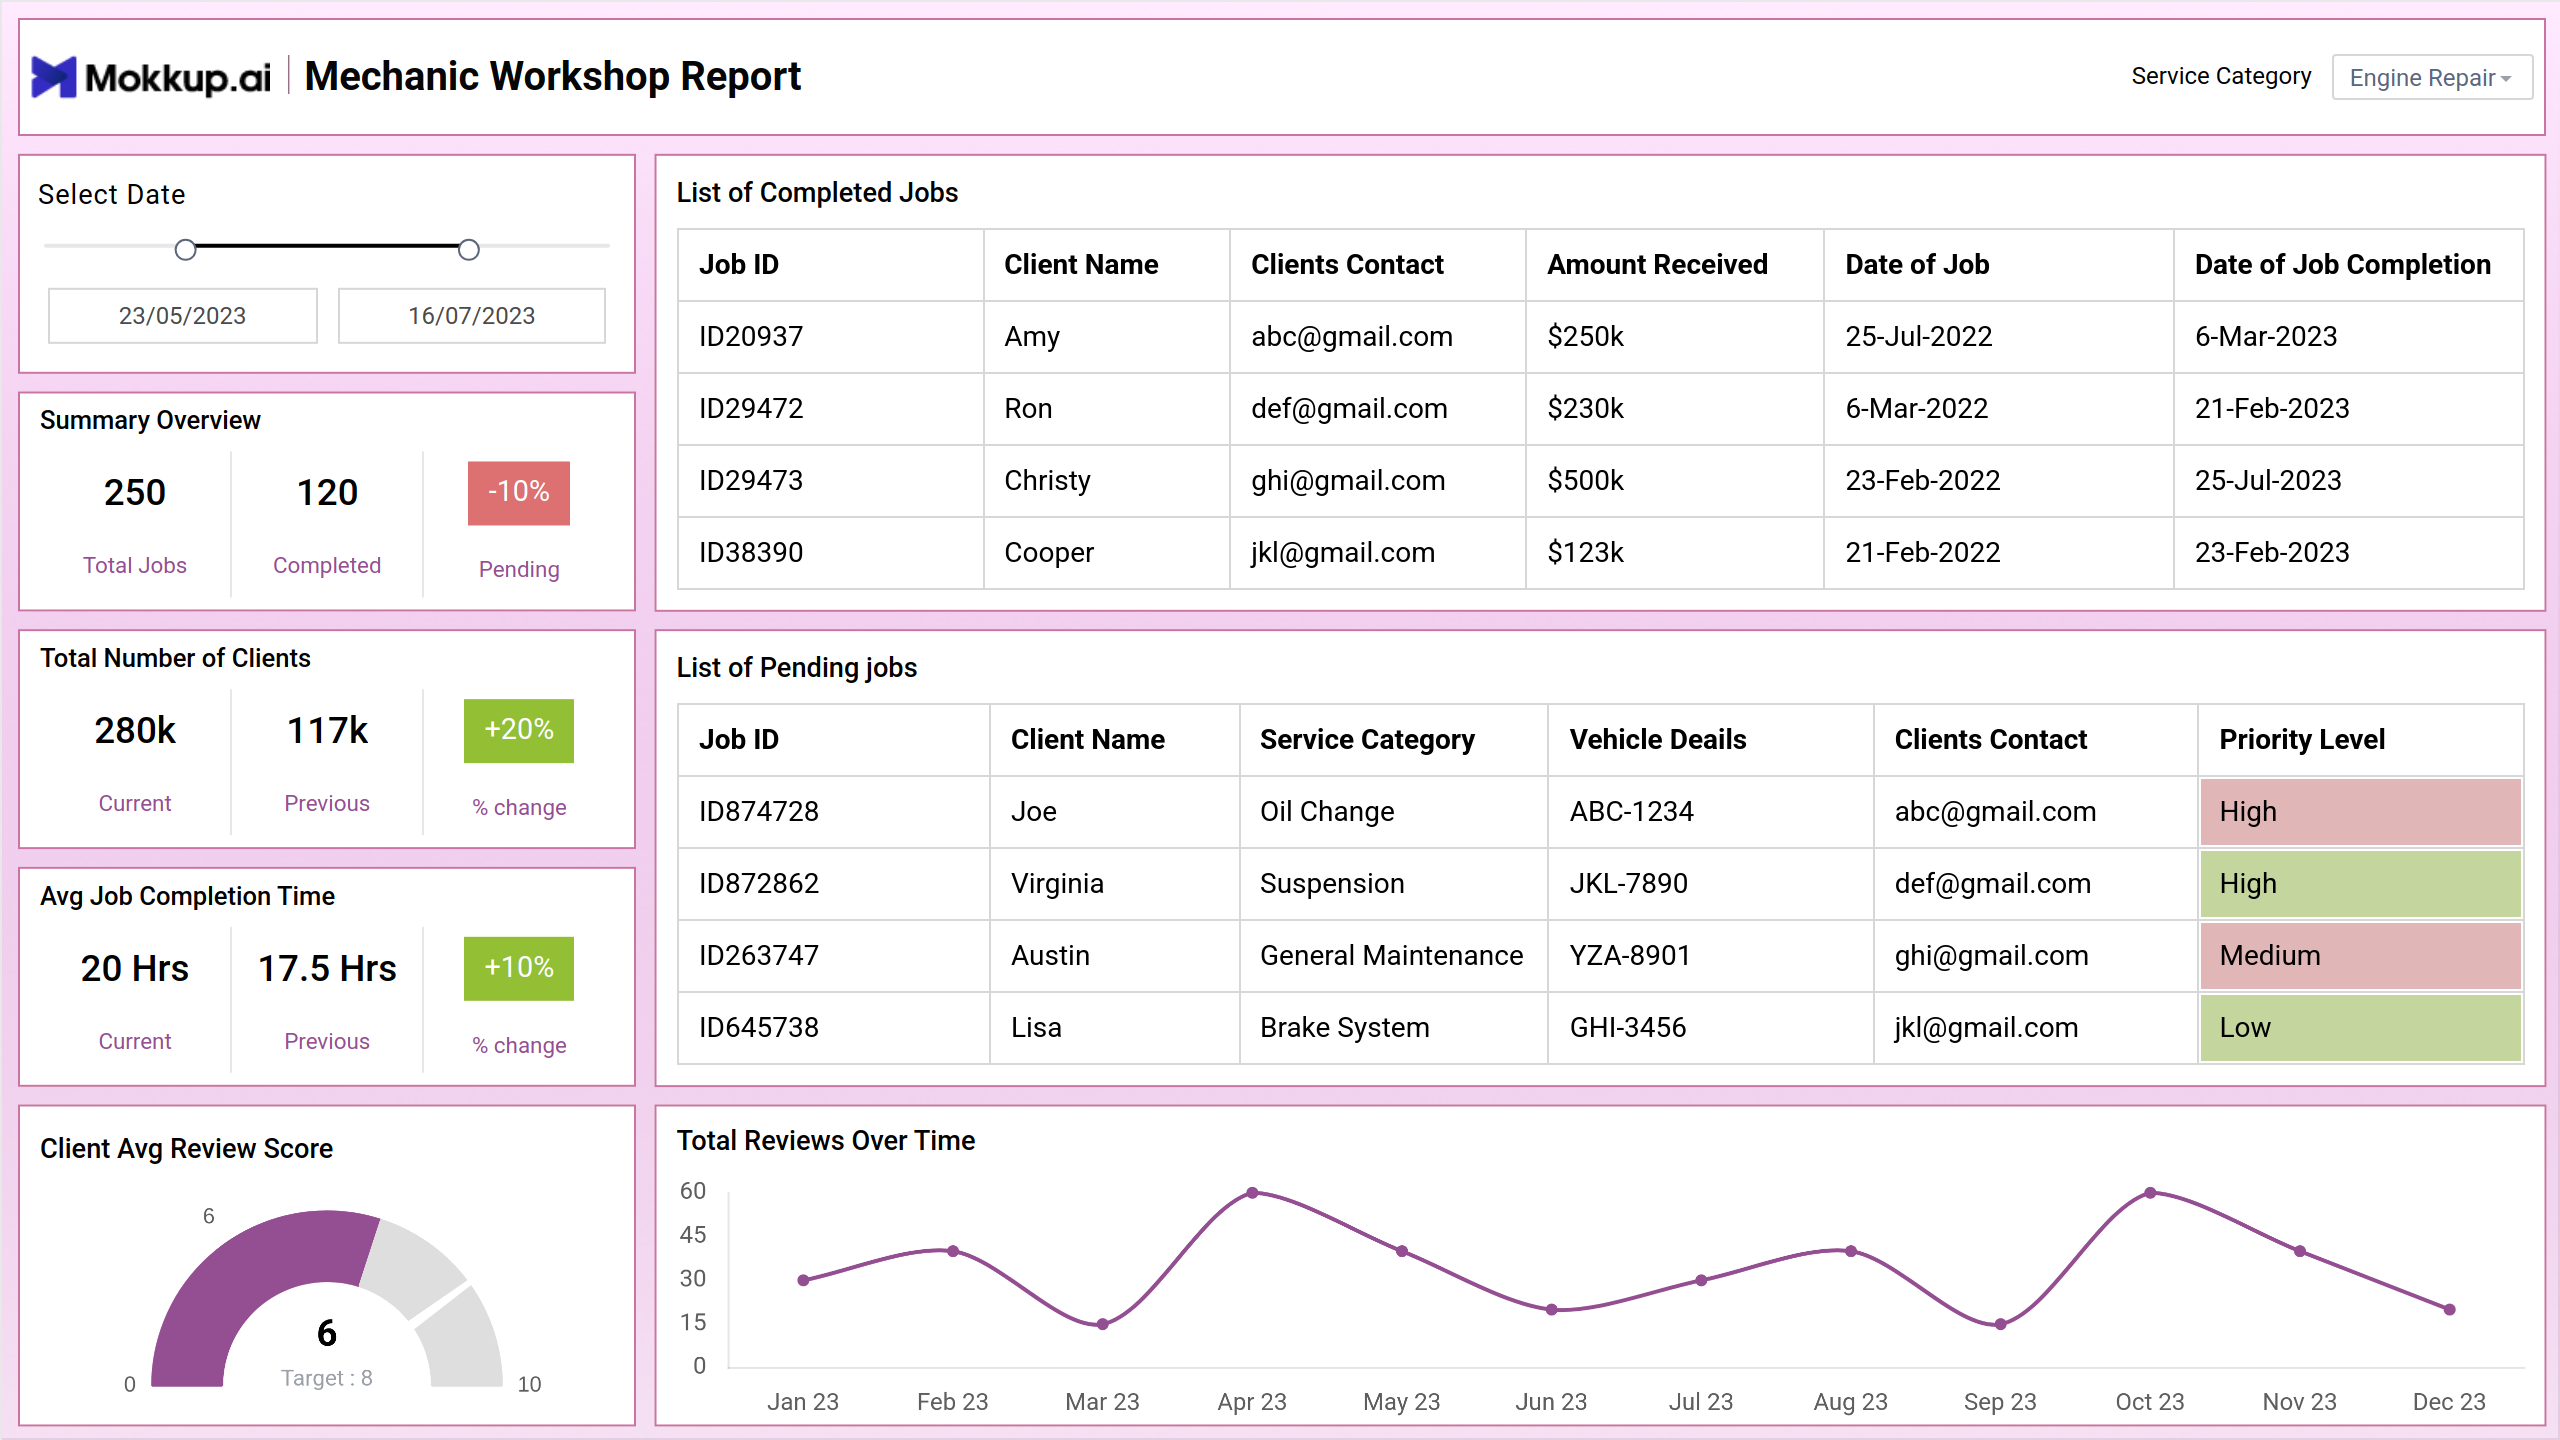
With this mechanics dashboard, gain a comprehensive overview of operations with customizable date selection and insights into total jobs, completed tasks, and pending tasks. Explore client statistics and service categories and review trends for continuous improvement. Additionally, delve into financial analysis, comparing earnings, top-earning jobs, monthly trends, and expenses for informed decision-making and sustainable growth.
Screen 1: Overview
This overview screen of the mechanics dashboard will provide a comprehensive snapshot of operations. At the top, there's the option to select dates for analysis, followed by a summary overview detailing total jobs, completed tasks, and pending tasks. On the top right-hand side, see statistics on the total number of clients, including comparisons between current and previous periods with percentage changes, average job completion time, and client review scores.
Additionally, the dashboard provides insights into service categories. The main section presents lists of completed and pending jobs, showcasing essential details such as job ID, client name, service category, and contact information. Lastly, a review trend over time offers valuable feedback dynamics.
Key Terms to consider:
- Select Date: Allows users to specify a date range for analysis.
- Summary Overview: A snapshot of total jobs and completed and pending tasks.
- Total No. of Clients: Displays the total number of clients, comparing current and previous periods with a percentage change.
- Avg. Job Completion Time: Calculates the average job completion time.
- Client Average Review Score: This shows the average review score given by clients.
- Service Category: Categorizes jobs based on the type of service provided.
- Completed Jobs List: This list displays completed job details, including job ID, client name, amount received, and date.
- Pending Jobs List: Shows details of pending jobs, such as job ID, client name, service category, vehicle details, and priority level.
- Review Trend Over Time: Tracks changes in review scores over a period.
Screen 2: Financial
In the financial section of the mechanics dashboard, the interface begins with a 'Select Date' option positioned at the top-left corner for date customization. Next, it showcases total earnings over the selected timeframe, comparing current figures with previous ones and indicating the percentage change. On the top right-hand side, service categories are highlighted for easy reference. Delve into the top-earning jobs of the month, displaying essential details such as job ID, client name, received amount, and service category. Explore monthly earning trends and a breakdown of earnings by category, covering services like engine repair, brake system, transmission, electrical system, suspension, oil change, and general maintenance. Additionally, gain insights into the balance between earnings and expenses for a comprehensive financial overview.
Key Terms to consider:
- Total Earnings Over Selected Time: This display shows the total earnings for the chosen period, comparing current and previous earnings with a percentage change indicator.
- Service Category: Highlights different categories of services offered.
- Top Earning Jobs of the Month: This list includes the highest-earning jobs, job ID, client name, received amount, and service category.
- Monthly Trends of Earnings: This shows the trends in earnings over the course of each month.
- Earning by Category: This breaks down earnings into service categories such as engine repair, brake system, transmission, electrical system, suspension, oil change, and general maintenance.
- Earning vs Expenses: Compares earnings to expenses, providing insight into financial performance.
Dashboard Template Insights
The mechanics dashboard offers a comprehensive snapshot of operations, allowing users to analyze total jobs, completed and pending tasks, and client statistics. It provides insights into service categories and tracks review trends for continuous improvement. In the financial section, users can analyze earnings, top-earning jobs, monthly trends, and expenses for optimized financial management and business growth.
Conclusion
The mechanics dashboard is a powerful tool for enhancing operational and financial management in automotive businesses. By offering customizable analysis options and detailed insights into various aspects such as job statistics, client engagement, and financial performance, the dashboard empowers users to make informed decisions. The ability to track and review trends over time and analyze earnings and expenses facilitates continuous improvement and optimized financial strategies. Ultimately, leveraging the features of the mechanics dashboard enables businesses to achieve sustainable growth and success in the automotive industry.