
What is a Maternal and Neonatal Health Dashboard?
A Maternal and Neonatal Health Dashboard is a digital analytics tool designed for hospitals and clinics to visualize, monitor, and manage health indicators for mothers and newborns. It centralizes real-time data, making it easy for healthcare teams to review performance, pinpoint trends, and act on critical issues, helping enhance clinical outcomes and patient satisfaction.
How to Create a Neonatal Care Dashboard
You don’t need to build your report from scratch—just start with a ready-to-use dashboard template from Mokkup. Add in your data and export it however you like. Here’s how to do it:
1. Create or Log in to Your Mokkup Account
Start by signing up on Mokkup.ai using your email. If you already have an account, just log in, and you’ll be good to go.
2. Choose and Customize Your Dashboard Template
Find the Maternal & Neonatal Health Dashboard template in the Templates section. Use the drag-and-drop editor to adjust KPIs, edit filters, or add elements based on your data.
3. Export to Your BI Tool
Once your dashboard wireframe is ready, use the BI Tool Export feature to send it directly to Power BI or Tableau for further analysis and enhancements. You can also download the dashboard as a PDF, PNG, or JPEG, embed it on a platform, or invite your team to collaborate.
Note: This is a Pro template. You’ll need a Pro subscription on Mokkup to use and customize this dashboard wireframe. Upgrade anytime to unlock full access.
Maternal and Neonatal Health Dashboard Example
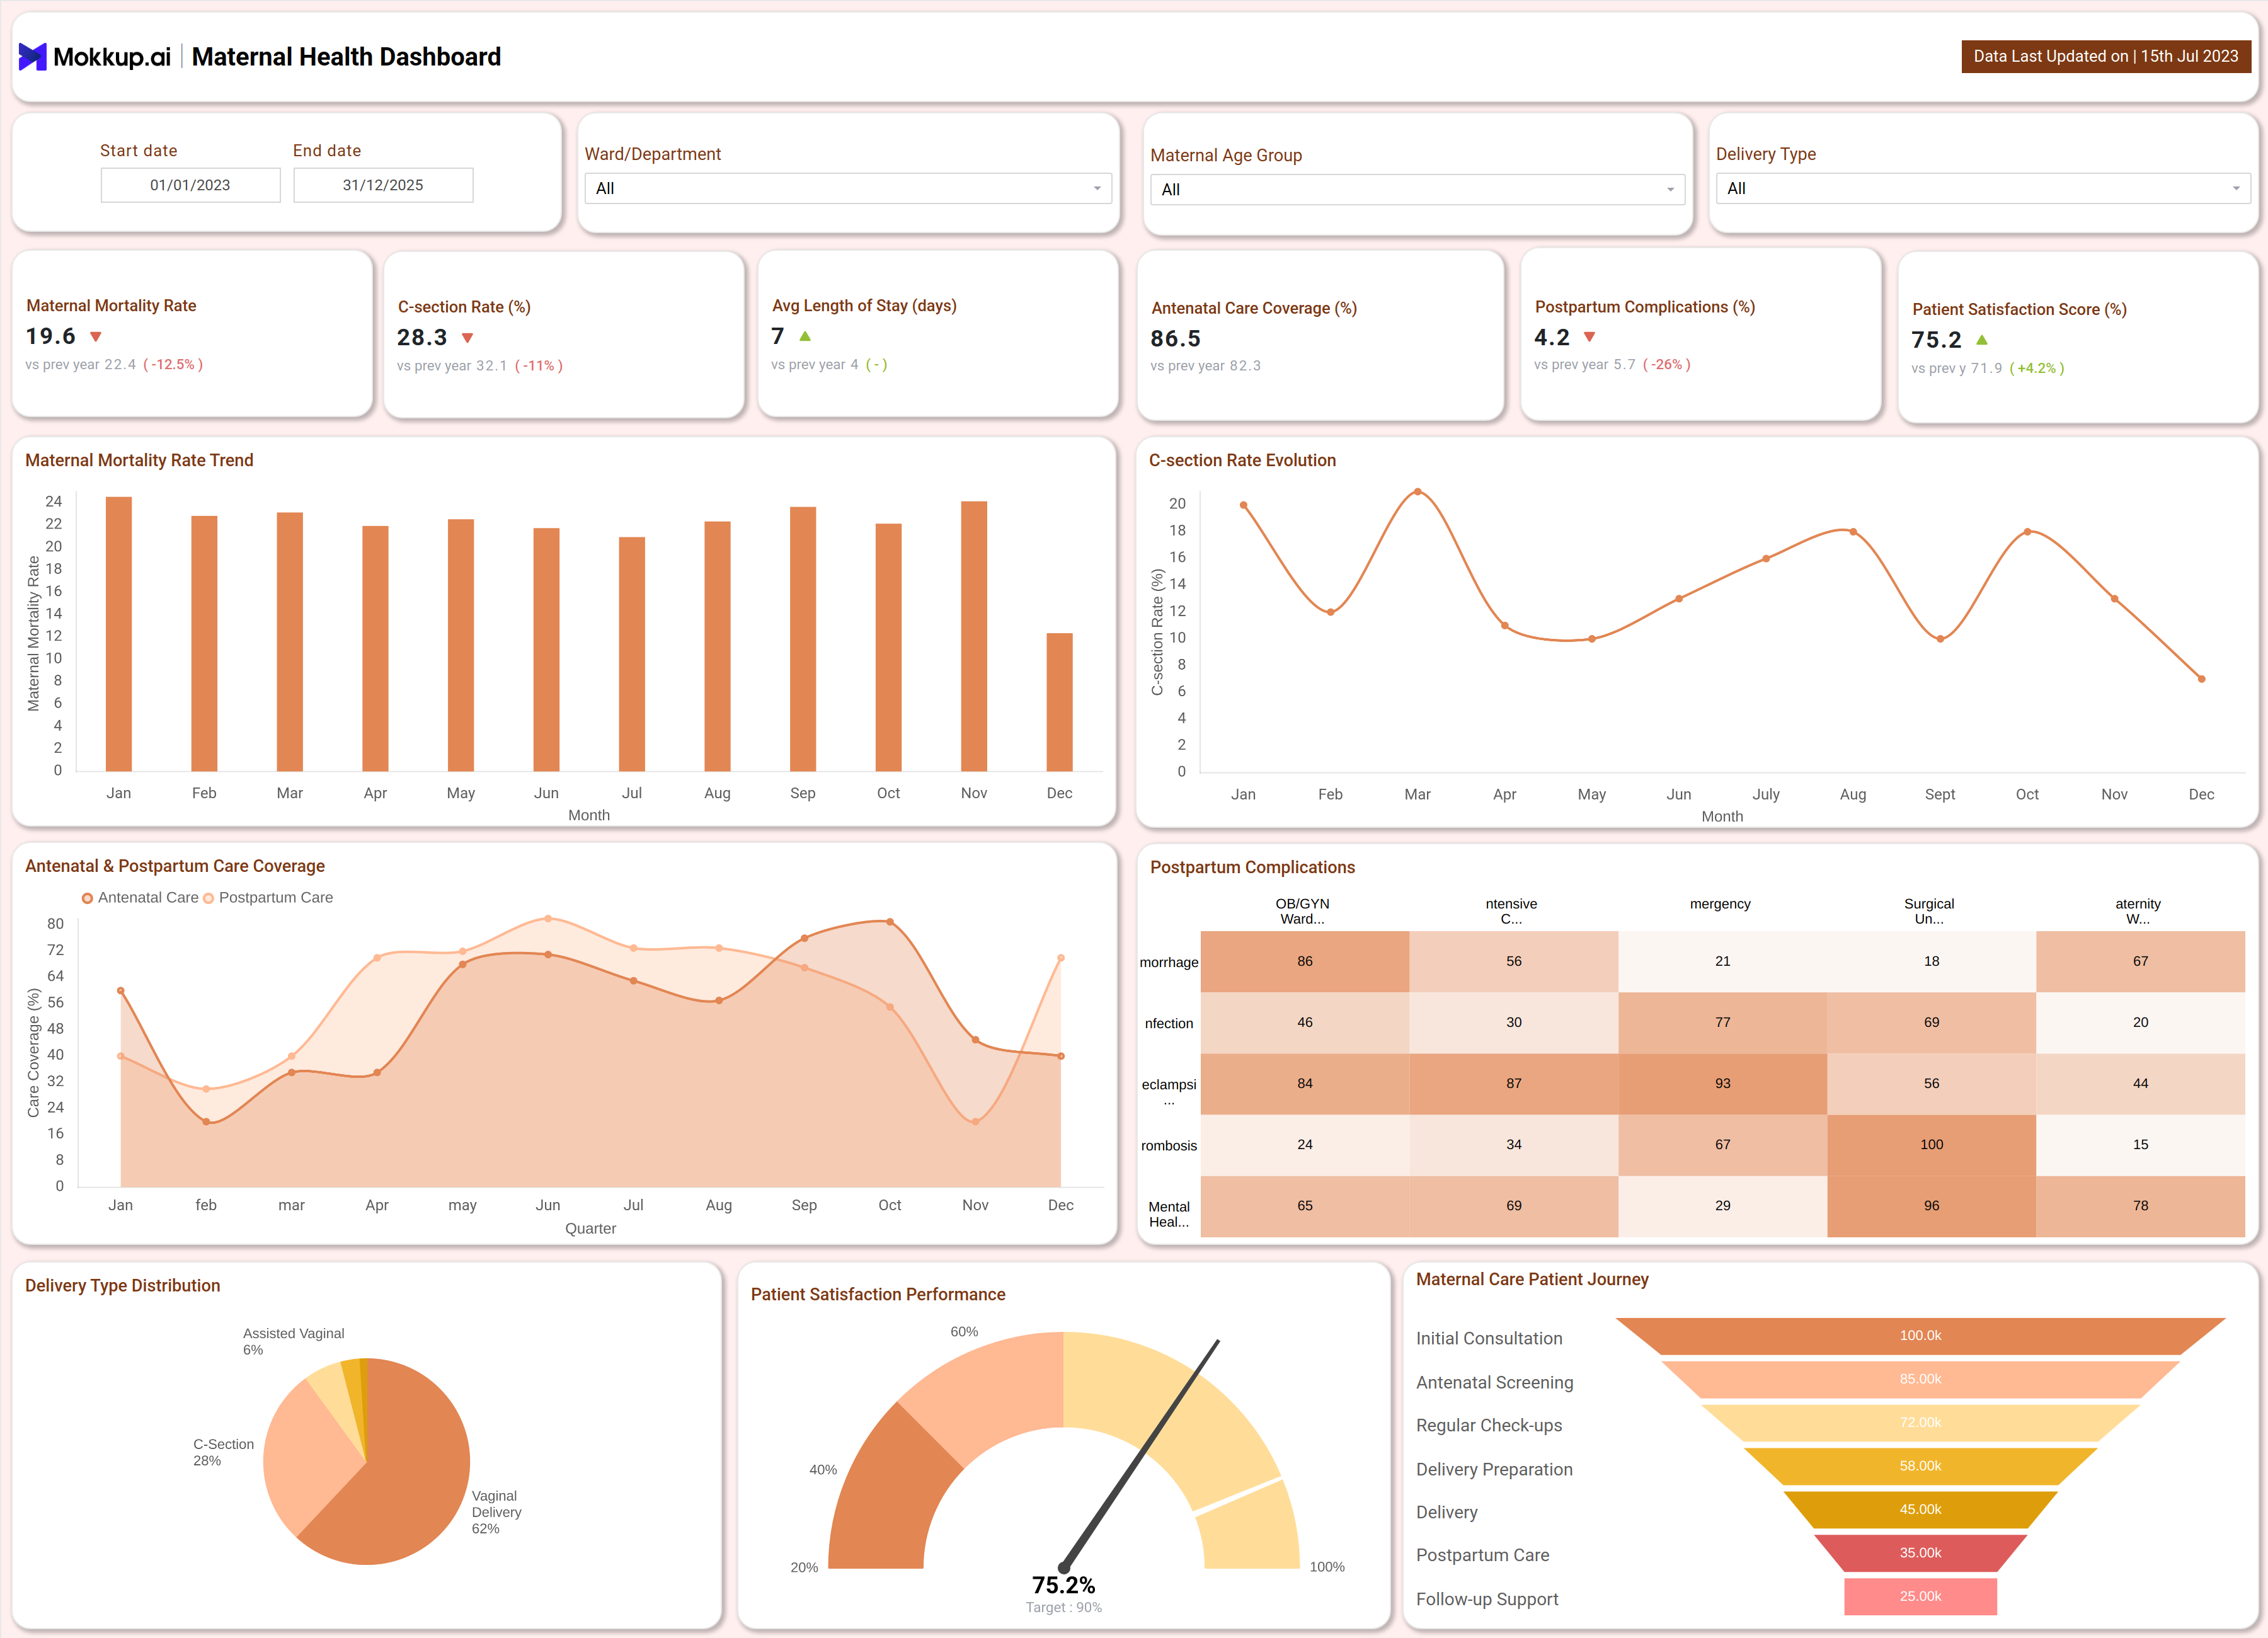
The Neonatal Outcomes Dashboard template integrates two screens: maternal health and neonatal care. Users can filter data by date, department, age group, delivery type, birth weight, and gestational age. Key metrics like maternal mortality rate, infant mortality rate, complications, NICU admissions, care coverage, and patient satisfaction are displayed at the top for quick reference.
Visualizations include:
- Monthly trends for mortality and C-section rates
- Antenatal and postpartum care coverage graphs
- Heatmaps of postpartum complications across hospital departments
- Delivery type and birth weight distribution charts
- Immunization coverage intensity matrix
- Detailed tables for neonatal performance by department
How to Analyze Data in Maternal and Neonatal Health Dashboards
Analyzing data in maternal and neonatal health dashboards can be done effectively by following these key steps:
- Start with monitoring high-level metrics such as maternal and neonatal mortality rates, complication rates, and care coverage.
- Use trending graphs to track changes over time and identify peaks (e.g., higher complications or admissions in certain months).
- Leverage heatmaps and tables to drill down into department-level risks, performance, and outcomes.
- Apply pie charts and funnel diagrams to break down delivery types, birth weight categories, and patient care pathways for more detailed insights.
- Utilize filters and segmentation tools to compare results against national averages and to identify areas needing continuous improvement.
Benefits of Maternal and Neonatal Health Dashboards
Here are some benefits of Newborn health analytics dashboard:
- Centralizes all critical maternal and neonatal KPIs on one platform
- Enables quick identification of risks, trends, and outlier events
- Improves coordination across departments and supports evidence-based interventions
- Enhances compliance reporting and benchmarking for quality accreditation
- Enables real-time monitoring and rapid response to emerging issues
- Increases transparency for stakeholders and improves communication
Even a fertility tracker can help you get the insights on tracking the menstruation cycle and planning pregnancy with the accurate forecasting of ovulation time.
KPIs to Track in Maternal and Neonatal Health Dashboards
Tracking the right KPIs is essential for effective maternal and neonatal care management. The following indicators are most impactful:
- Maternal Mortality Rate – Deaths per 100,000 live births, a key measure of maternal health quality
- C-section Rate (%) – Percentage of deliveries via C-section, helpful for monitoring surgical interventions
- Average Length of Stay – Average inpatient days per delivery, reflecting efficiency
- Antenatal Care Coverage (%) – Proportion of mothers receiving recommended prenatal services
- Postpartum Complications (%) – Percentage of mothers with post-delivery complications
- Patient Satisfaction Score – Measures care quality and patient experience
FAQs
1. Who should use a Maternal and Neonatal Health Dashboard?
Hospital administrators, department heads, clinicians, and public health officials benefit from these dashboards to streamline reporting, monitor trends, and improve patient care.
2. How often is the data updated?
Dashboards usually update daily or weekly, enabling near real-time monitoring and intervention.
3. Can the dashboard track both hospital-wide and department-specific KPIs?
Yes, filters allow users to view overall metrics or drill down into specific wards, departments, age groups, and birth weight categories.