
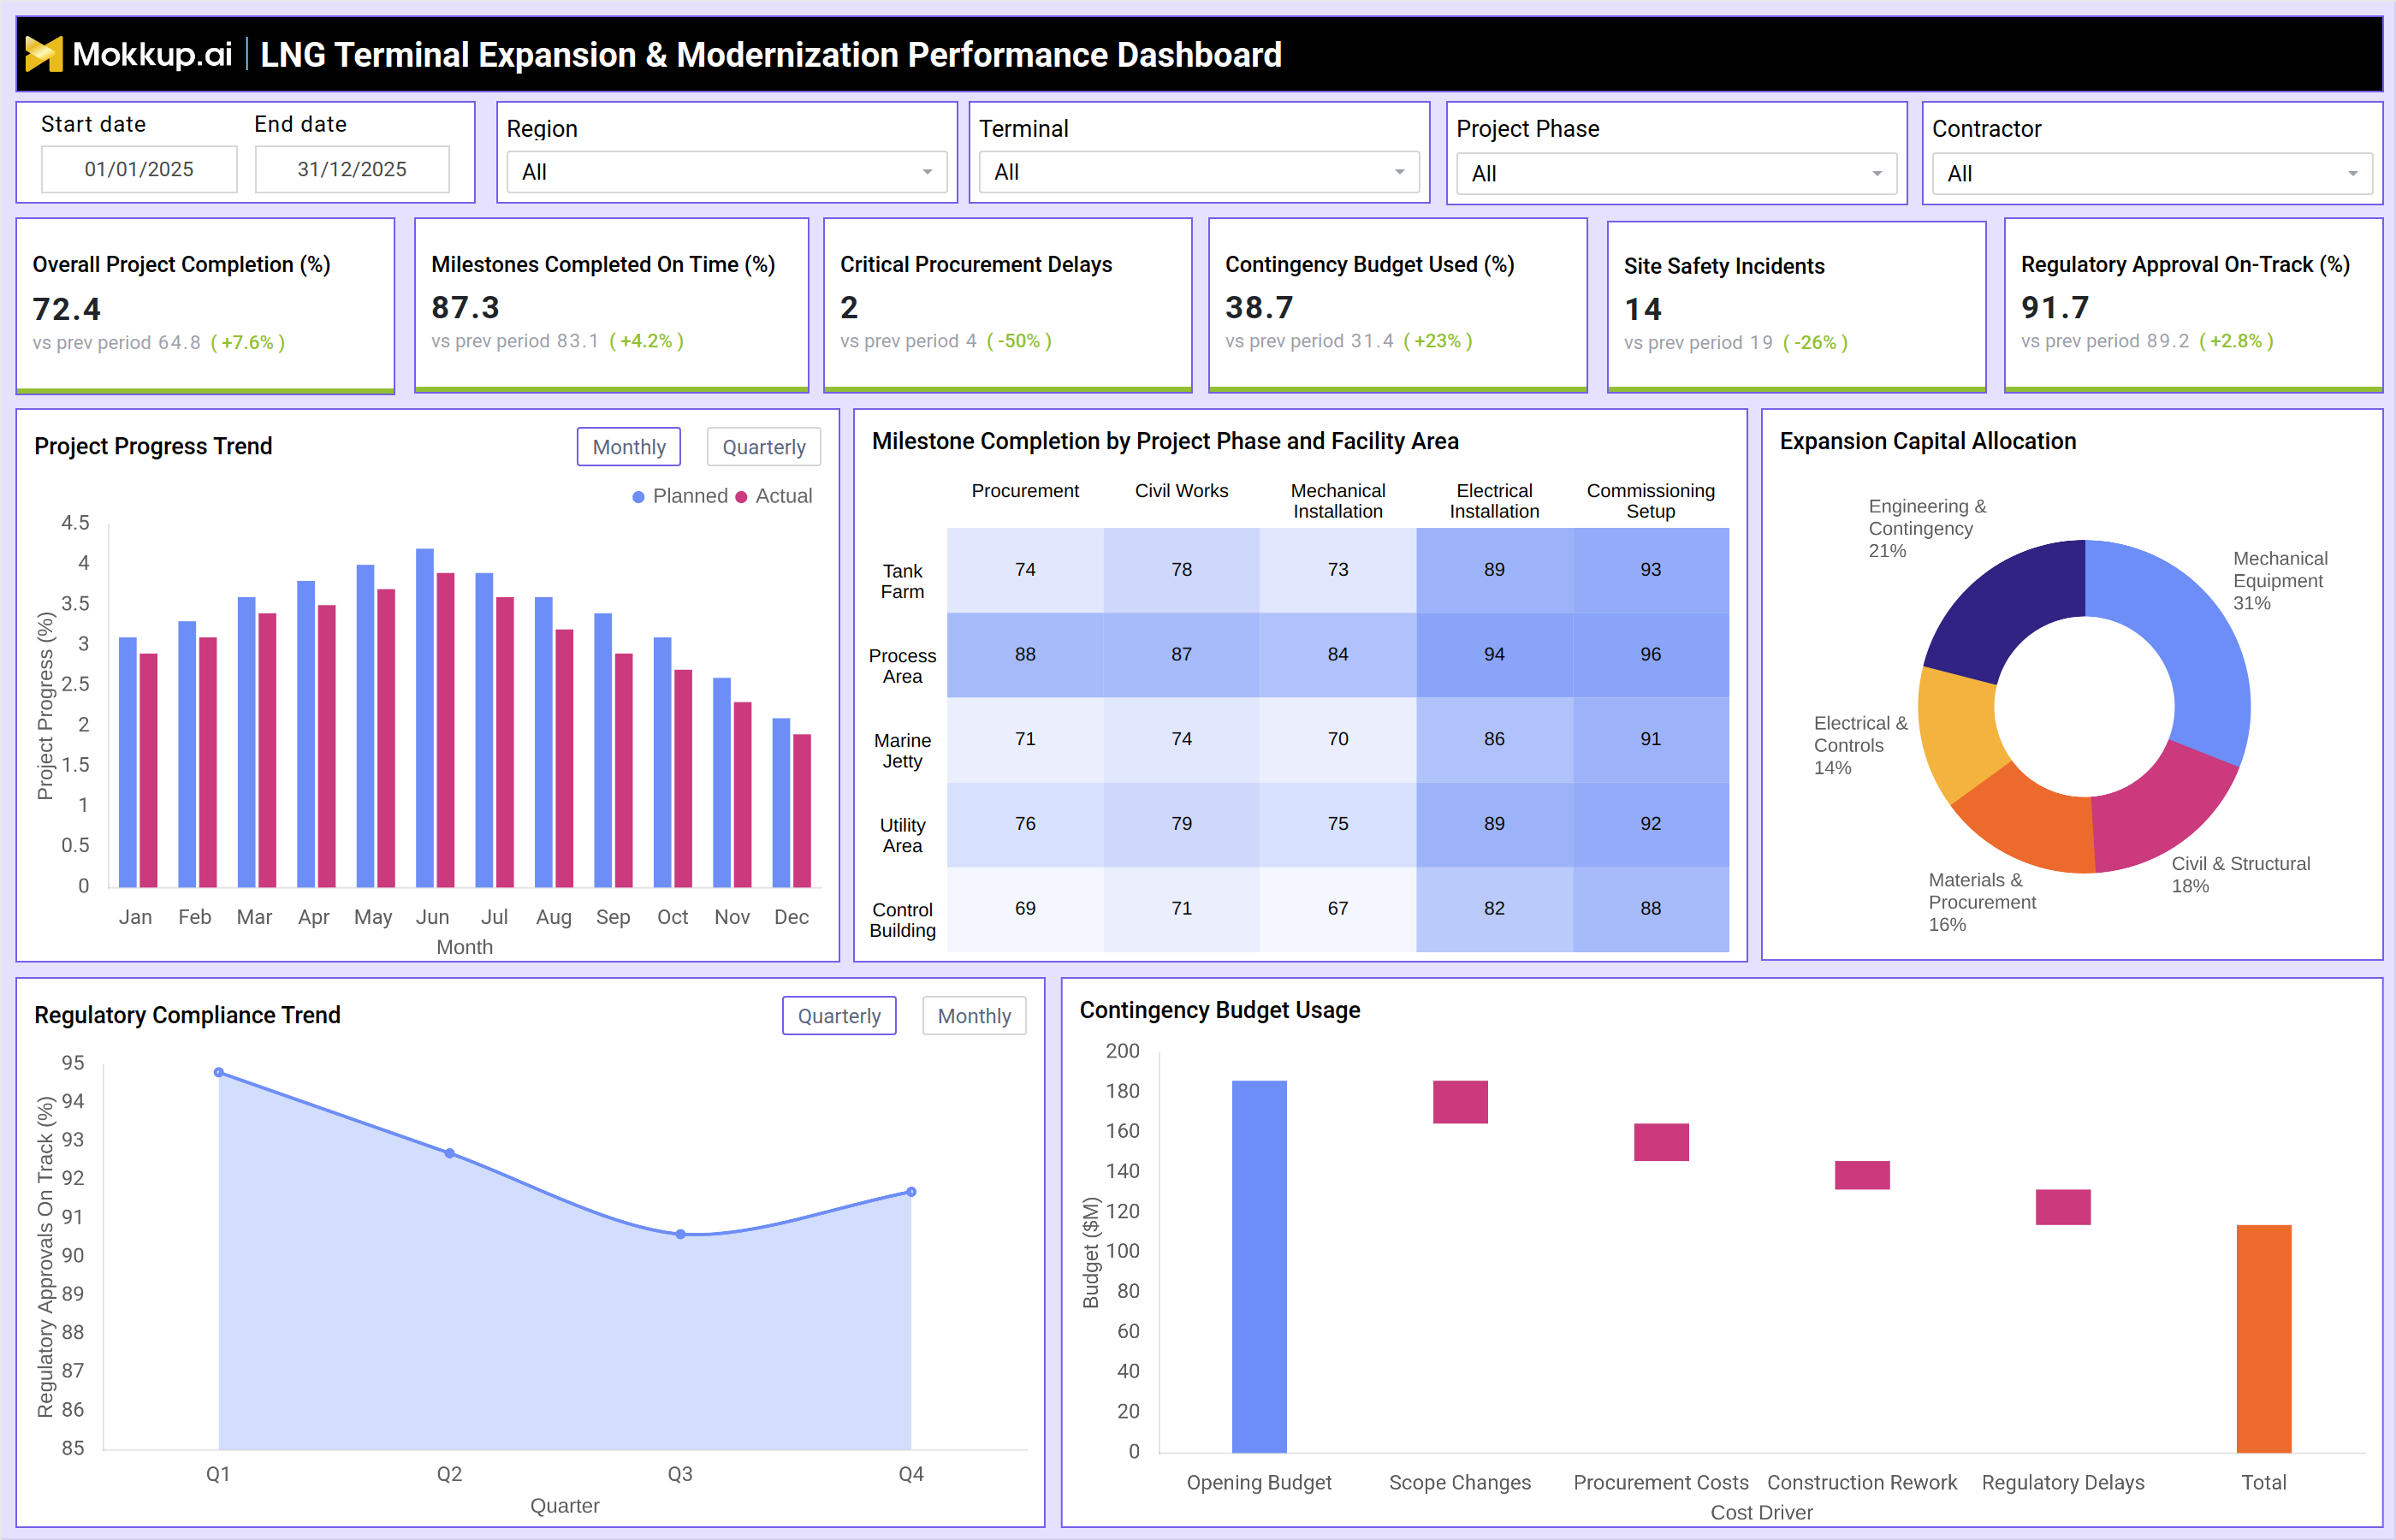
What is an LNG Terminal Expansion & Modernization Performance Dashboard?
An LNG terminal expansion performance monitoring dashboard is a data analytics platform used by natural gas utilities and LNG operators to track terminal expansion and modernization projects. LNG infrastructure projects involve capital investments, engineering activities, procurement operations, and regulatory approvals. Monitoring these projects requires visibility into milestone completion, construction progress, and contractor performance.
An LNG terminal modernization performance analytics dashboard consolidates project data into a centralized view. This helps teams monitor project completion rates, procurement delays, and capital budget usage. The dashboard also functions as an LNG infrastructure expansion project monitoring dashboard for multi-terminal infrastructure programs. Project managers can track safety incidents and regulatory approval progress during construction. This liquefied natural gas terminal expansion analytics dashboard converts project data into measurable performance KPIs.
How to Create an LNG Terminal Expansion & Modernization Performance Dashboard
You don't need to build your report from scratch — just start with a ready-to-use LNG Terminal Expansion & Modernization Performance dashboard template from Mokkup. Add in your data and export it however you like. Here's how to do it:
1. Create or Log in to Your Mokkup Account
Start by signing up on Mokkup.ai using your email. If you already have an account, just log in, and you'll be good to go.
2. Choose and Customize Your Dashboard Template
Find the LNG Terminal Expansion & Modernization Performance Dashboard template in the Templates section. Use the drag-and-drop editor to adjust KPIs, edit filters, or add elements based on your data.
3. Export to Your BI Tool
Once your dashboard wireframe is ready, use the BI Tool Export feature to send it directly to Power BI or Tableau for further analysis and enhancements. You can also download the dashboard as a PDF, PNG, or JPEG, embed it on a platform, or invite your team to collaborate. Note: This is a Pro template. You'll need a Pro subscription on Mokkup to use and customize this dashboard wireframe. Upgrade anytime to unlock full access.
Note: This is a Pro template. You’ll need a Pro subscription on Mokkup to use and customize this dashboard wireframe. Upgrade anytime to unlock full access.
LNG Terminal Expansion & Modernization Performance Dashboard Example
A natural gas utility expanding LNG terminal capacity must manage engineering, construction, procurement, and commissioning phases. Each phase involves contractors, capital budgets, infrastructure milestones, and regulatory approvals. Managing this information across multiple reports makes project oversight difficult. An LNG terminal capacity expansion performance dashboard provides a centralized view of project completion and milestone delivery. Project teams can monitor procurement delays, construction progress, and safety incidents across facilities.
The dashboard highlights milestone completion across areas such as tank farms, marine jetties, and utility systems. Using an LNG terminal modernization and upgrade monitoring system, managers can track regulatory approvals and infrastructure investment. This liquefied natural gas terminal expansion analytics dashboard improves visibility into LNG infrastructure expansion programs.
How to Analyze Data in LNG Terminal Expansion & Modernization Performance Dashboard
Here is how you can analyze data from this dashboard:
- Project Completion Tracking: Review overall project completion to understand progress across LNG terminal expansion initiatives.
- Milestone Performance Analysis: Analyze milestone completion rates to verify if construction activities are on schedule.
- Procurement Risk Monitoring: Monitor critical procurement delays to identify supply chain risks impacting timelines.
- Budget Utilization Control: Track contingency budget usage to detect cost overruns and scope changes.
- Construction Safety Assessment: Evaluate site safety incidents to measure safety performance during expansion.
- Schedule Variance Analysis: Compare planned versus actual progress to identify timeline deviations.
- Facility-Level Progress Insights: Analyze milestone completion across tank farms, marine jetties, and control buildings.
- Capital Allocation Review: Study expansion capital allocation to understand investment distribution across infrastructure.
- Regulatory Approval Tracking: Review regulatory approval trends to ensure compliance across modernization projects.
- Cost Driver Identification: Identify key cost drivers such as procurement costs, rework, or regulatory delays.
Benefits of LNG Terminal Expansion & Modernization Performance Dashboard
The following are the benefits of using this dashboard:
- Centralized Project Visibility: Provides a unified view of LNG infrastructure expansion performance.
- Progress Monitoring: Improves visibility into construction progress and milestone completion.
- Delay Detection: Helps identify procurement and construction delays early.
- Project Governance Support: Strengthens capital project governance for modernization programs.
- Cross-Team Coordination: Enhances collaboration between engineering, procurement, and construction teams.
- Safety Oversight: Improves monitoring of safety performance during infrastructure development.
- Cost Control: Enables better tracking of contingency budget usage and cost drivers.
- Compliance Assurance: Supports regulatory compliance monitoring during upgrades.
- Risk Reduction: Reduces execution risks through data-driven insights.
- Investment Transparency: Improves transparency in LNG terminal modernization investments.
KPIs to Track in LNG Terminal Expansion & Modernization Performance Dashboard
The following key KPIs can be tracked by using this dashboard:
- Overall Project Completion (%): Measures the percentage of total work completed across LNG terminal expansion and modernization projects.
- Milestones Completed On Time (%): Indicates the proportion of infrastructure project milestones delivered within the planned schedule.
- Critical Procurement Delays: Number of procurement activities delaying equipment delivery or construction progress.
- Contingency Budget Used (%): Percentage of contingency funds utilized due to scope changes, procurement issues, or project delays.
- Site Safety Incidents: Total number of safety incidents occurring during construction or infrastructure upgrade activities.
- Regulatory Approval On-Track (%): Measures the percentage of required regulatory approvals progressing according to the project timeline.
- Project Progress (Planned vs Actual): Compares planned construction progress against actual project execution to identify schedule deviations.
- Milestone Completion by Facility Area: Tracks project progress across infrastructure components such as tank farms, marine jetties, process areas, and utilities.
- Expansion Capital Allocation: Shows how project investment is distributed across civil works, mechanical systems, electrical equipment, and engineering activities.
- Regulatory Compliance Trend: Monitors compliance performance during LNG infrastructure expansion and modernization programs.
- Contingency Budget Drivers: Identifies key cost drivers responsible for contingency budget consumption such as procurement delays or construction rework.
Frequently Asked Questions
Q1. What is an LNG terminal expansion performance monitoring dashboard?
It is an analytics tool used to track construction progress, project milestones, procurement status, and capital investments across LNG infrastructure expansion projects.
Q2. Who uses an LNG terminal modernization performance analytics dashboard?
Project managers, infrastructure planners, LNG operations teams, and capital investment leaders use this dashboard.
Q3. Why is monitoring LNG terminal expansion projects important?
LNG infrastructure projects involve large capital investments and complex construction phases that require close monitoring to avoid delays.
Q4. What KPIs does this dashboard track?
Key KPIs include Overall Project Completion (%), Milestones Completed On Time (%), Critical Procurement Delays, Contingency Budget Used (%), Site Safety Incidents, and Regulatory Approval On-Track (%).
Q5. How does the dashboard support regulatory compliance during LNG expansion?
The dashboard tracks Regulatory Approval On-Track (%) and Regulatory Compliance Trend, giving project teams real-time visibility into approval progress and helping ensure all expansion activities meet required standards.