
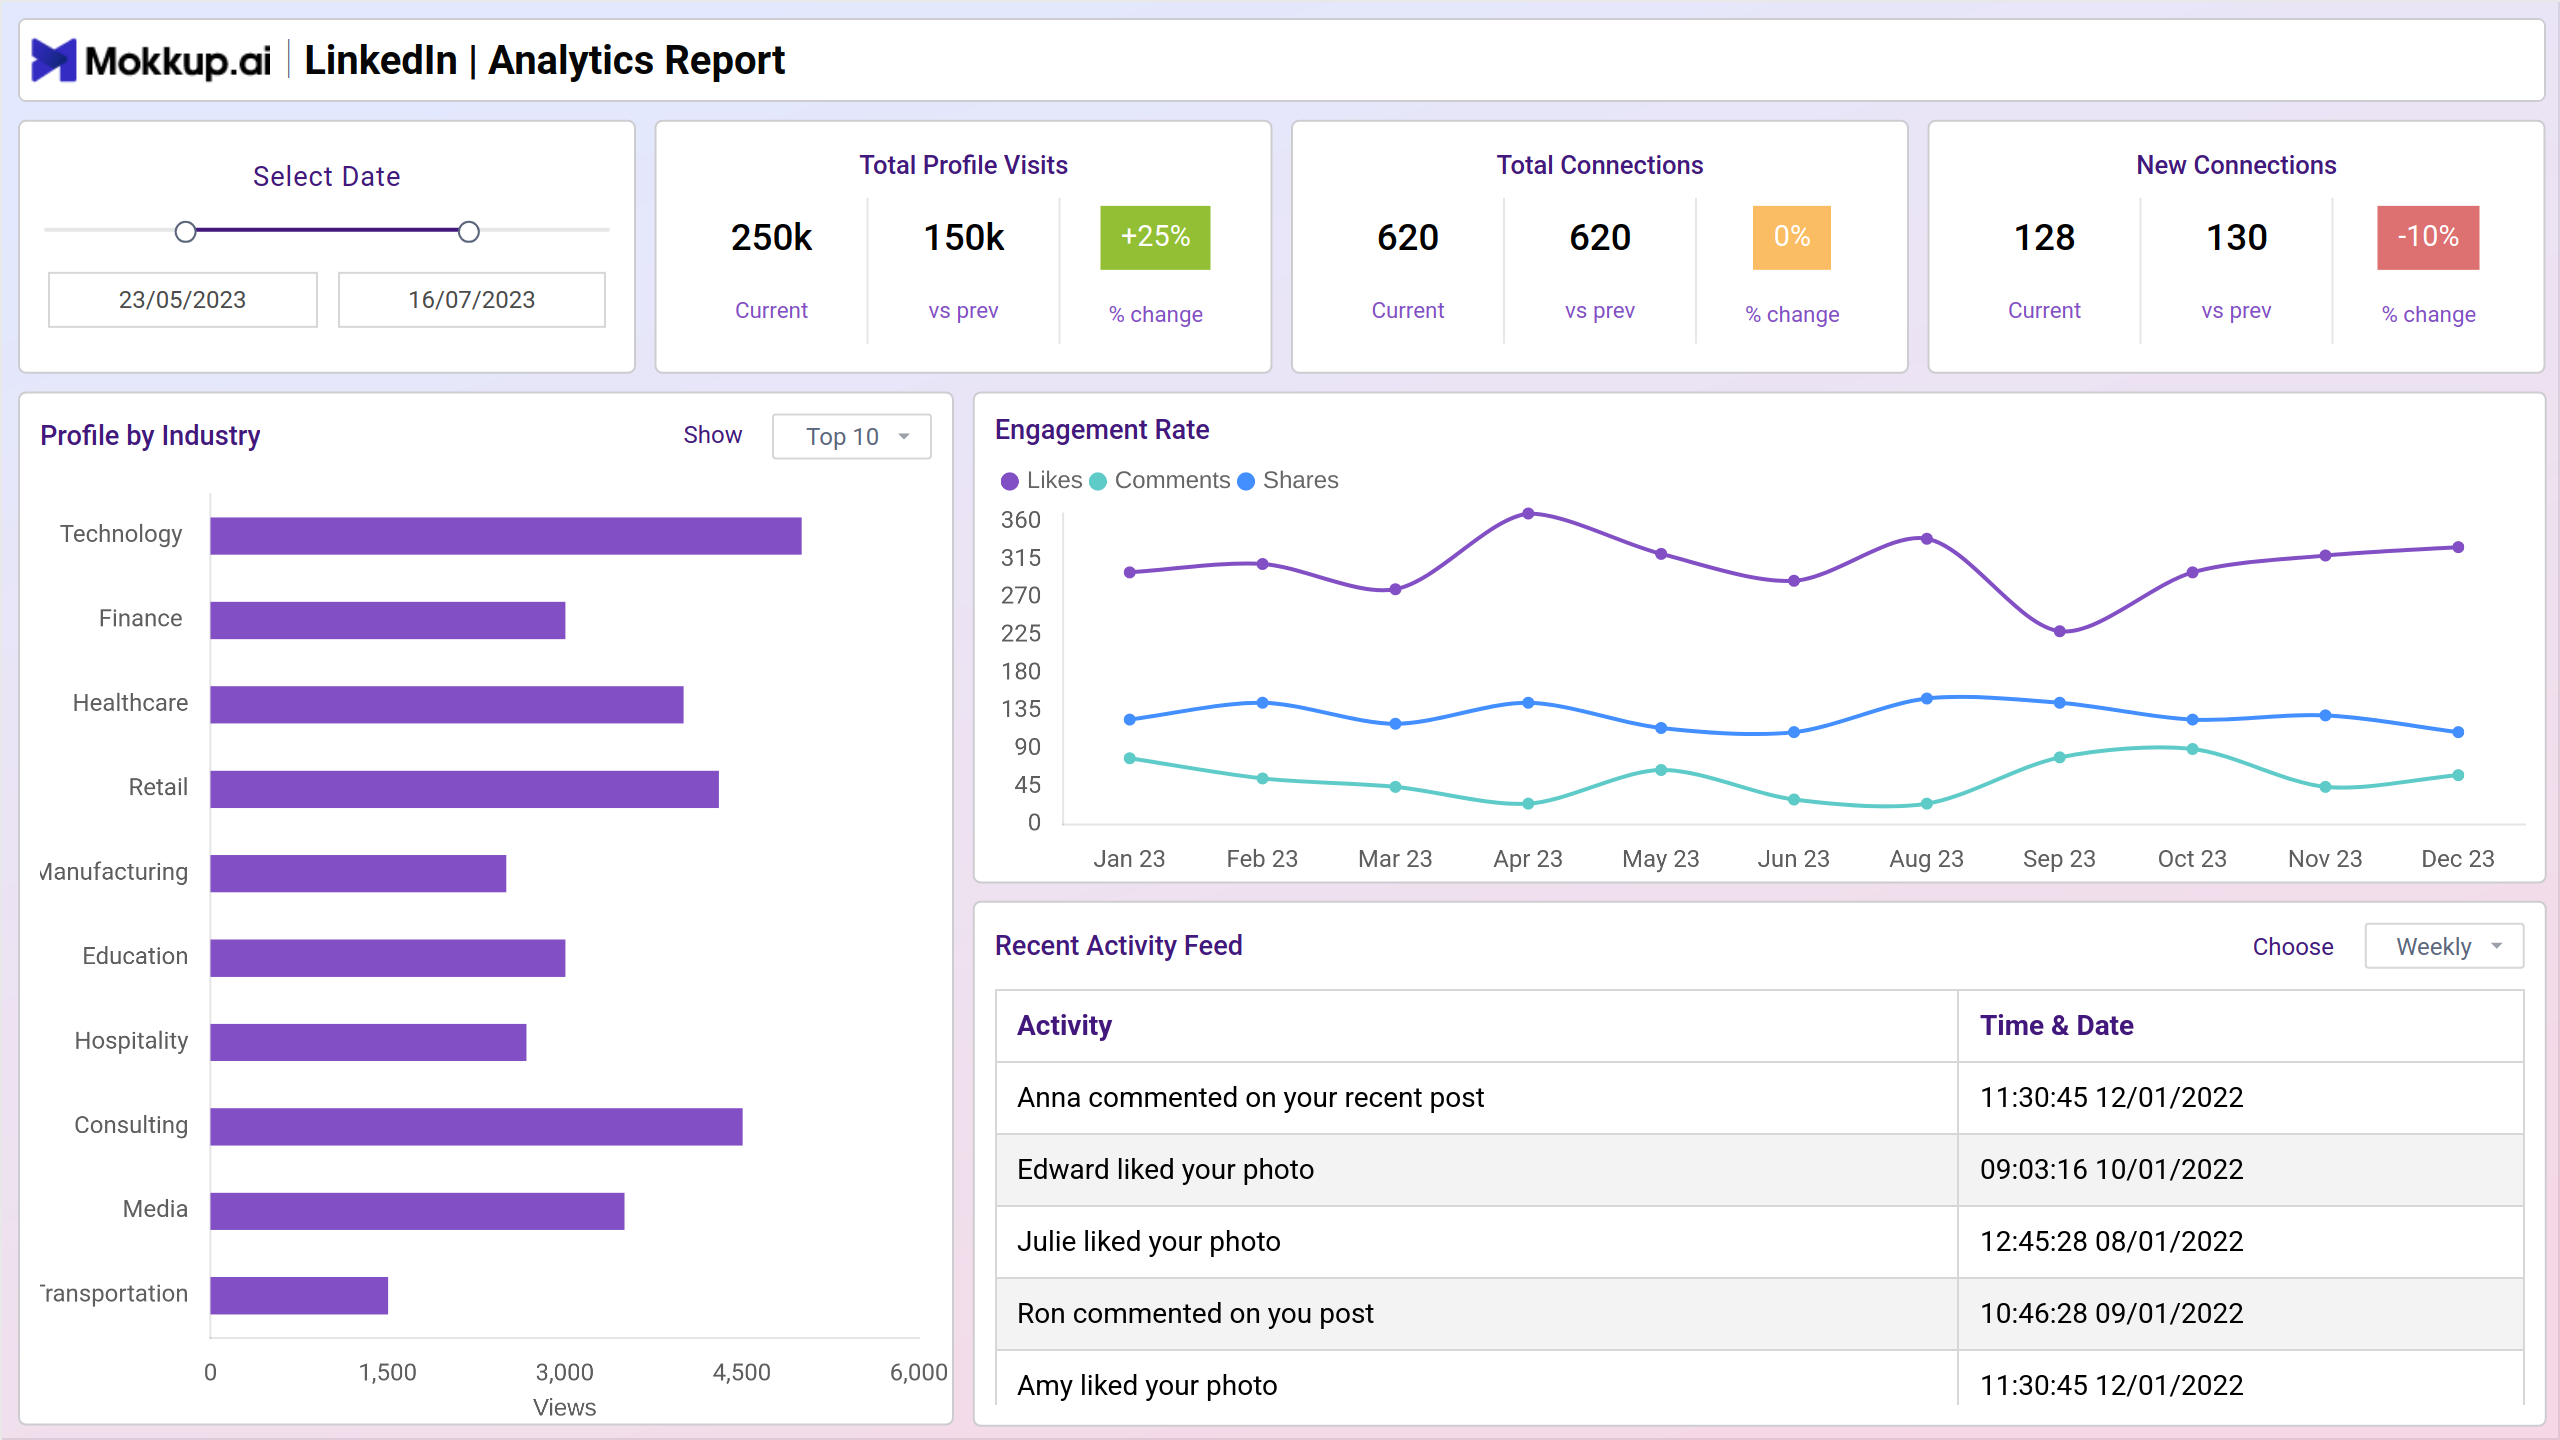
This dashboard offers profiling by industry and tracking post performances. Each screen offers valuable insights to enhance the social media strategy. Explore key terms such as engagement rates, distribution of connections, and impression analysis, empowering to make data-driven decisions about the LinkedIn presence.
Screen 1: Overview
This section of the LinkedIn post dashboard provides a comprehensive overview. It includes profiles categorized by industry, engagement rates, and a recent activity feed displaying actions along with timestamps on a weekly or monthly basis. Additionally, new connections between the previous and current periods are compared, showing the percentage change. Also, see metrics such as total connections, profile visits, and the option to select specific dates for analysis.
Key Terms to consider:
- Select Date Option: Ability to choose specific dates for analyzing data and activities.
- Total Profile Visits: Cumulative count of visits to the profile.
- Total Connections: Sum of all connections linked to the profile.
- New Connections (Previous vs. Current, % Change): Compare and analyze the growth or decline in connections between different time periods, represented as a percentage change.
- Profile by Industry: Segment profiles based on their respective industries.
- Engagement Rate: Measure the level of interaction and involvement with posts.
- Recent Activity Feed: Display actions and timestamps for recent activities on weekly and monthly scales.
Screen 2: Connections and Follower Insights
In the dashboard view, the first thing to notice is a 'Select Date' feature positioned at the top-left corner, followed by insights into top industries of connections, distribution based on seniority levels, trends depicting connections and followers over time, and a breakdown of tags like clients, colleagues, and industry peers. Additionally, there's an overview of location distribution and usage statistics for InMail messages.
Key Terms to consider:
- Select Date: Enables users to specify a timeframe for data analysis.
- Top Industries of Connection: Highlights the predominant industries among connections.
- Seniority Level Distribution: Shows the distribution of connections based on their professional seniority.
- Connection and Followers Over Time: Displays trends in the growth of connections and followers.
- Distribution of Tags: Break down connections into categories such as clients, colleagues, and industry peers.
- Location Distribution: Provides insights into the geographical distribution of connections.
- InMail Message Usage: Tracks the utilization of InMail messages for communication.
Screen 3: Post Performances
In the 'Post Performance' section of the dashboard - find the 'Select Date' option positioned at the top-left corner, followed by insights into the total number of posts made, posts created monthly, total views, average views per post, the most engaging posts, the least engaging post, distribution of impressions, average engagement rate over time (including likes, shares, and comments), and impressions categorized by post type (text, audio, video).
Key Terms to consider:
- Total Posts Made: Indicates the overall number of posts published.
- Posts Made in the Months: Displays the distribution of posts across different months.
- Total Views: This shows the cumulative number of views all posts receive.
- Average Views Per Post: Calculates the mean number of views per post.
- Most Engaging Posts: Highlights the posts that garnered the highest levels of engagement.
- Least Engaging Post: Identifies the post with the lowest engagement metrics.
- Impression Distribution: Provides a breakdown of impressions across different categories or criteria.
- Average Engagement Rate Over Time: Tracks the average engagement rate (likes, shares, comments) over a period.
- Impressions by Post Type: Analyzes impressions based on the type of post content, such as text, audio, or video.
Dashboard Template Insights
This guide explores LinkedIn post dashboard analytics across three screens. The "Overview" section provides insights into audience demographics and engagement. "Connections and Follower Insights" offers network dynamics analysis, while "Post Performances" optimizes content strategy and engagement metrics. Leveraging these insights can enhance the LinkedIn presence and professional impact.
Conclusion
In conclusion, understanding and utilizing the insights provided by the LinkedIn post dashboard can significantly enhance the social media strategy on the platform. Analyzing audience demographics, engagement rates, and post performances can refine the content strategy to better resonate with the target audience and achieve professional goals. Continuously monitoring and adapting approaches based on these analytics will ensure that one can stay ahead in leveraging LinkedIn as a powerful tool for networking, branding, and professional growth.