What is a Lead Generation Report Dashboard?
The lead generation report meticulously tracks multiple lead sources, conversion rates, and the effectiveness of the marketing method used. This lead tracking dashboard template mirrors campaign performance and makes lead tracking seamless. Marketing agencies that track quality leads can bridge the gap between marketing efforts and sales made in reality.
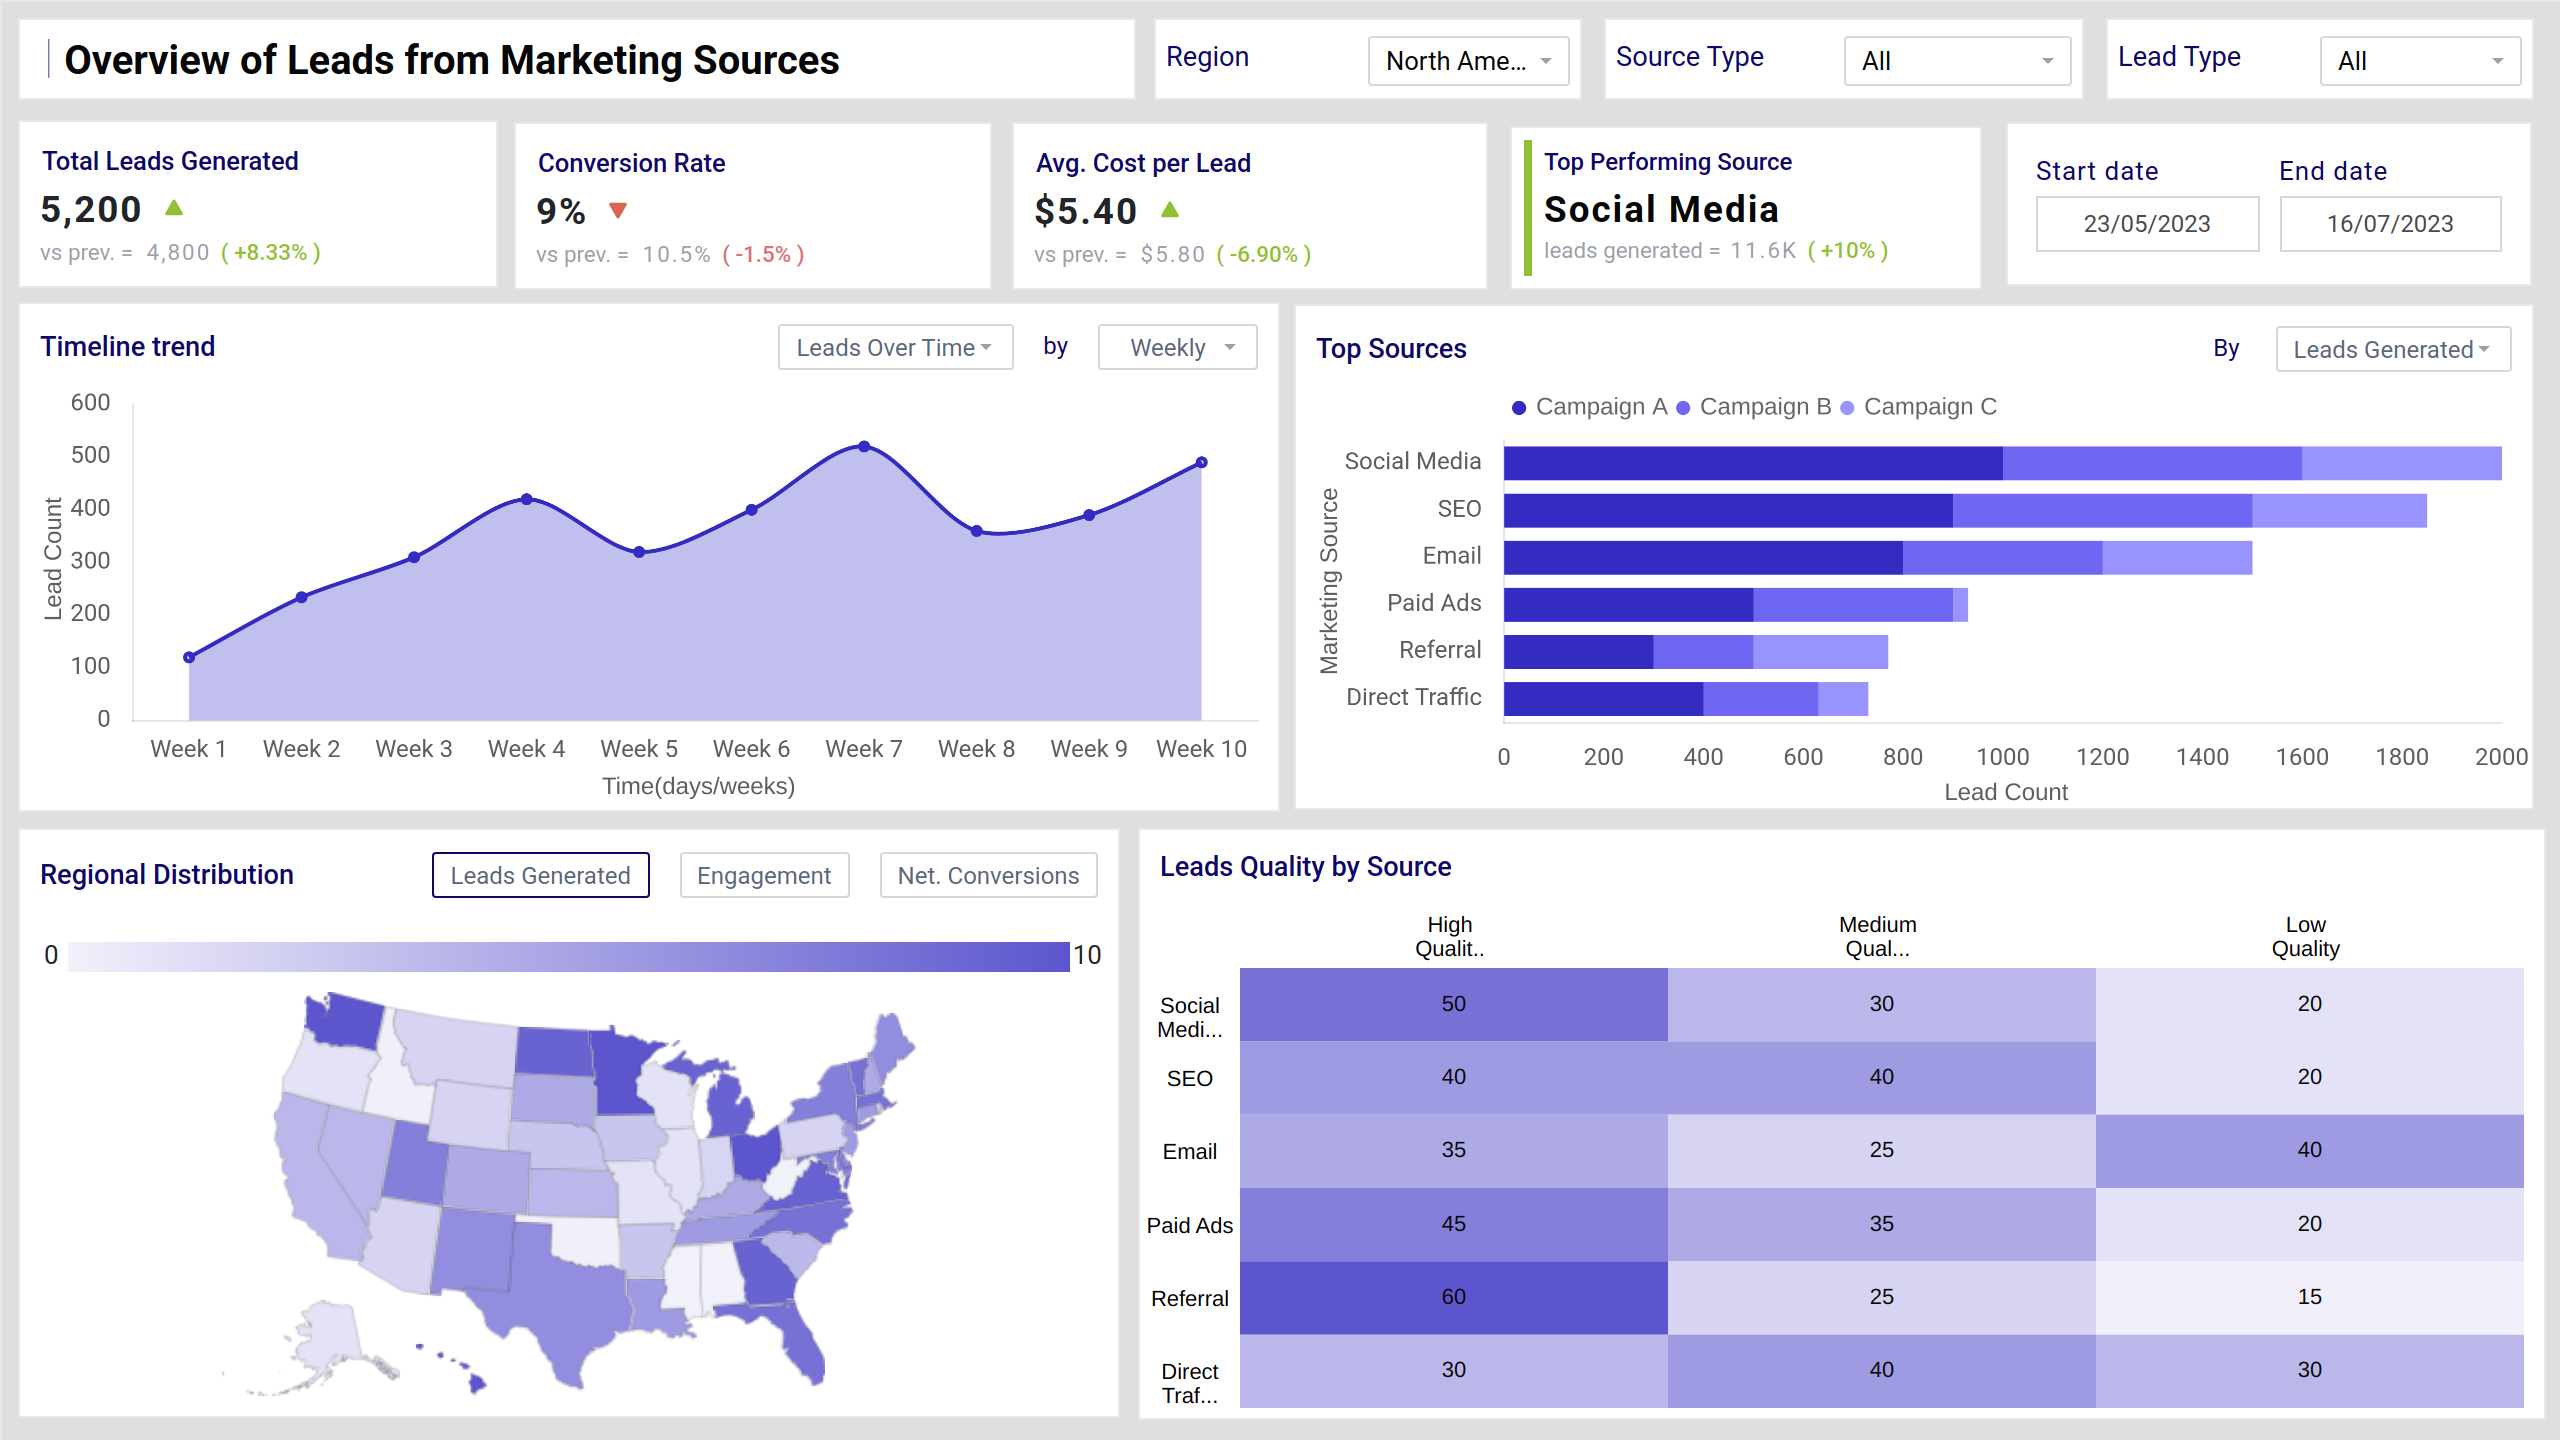
Lead Generation Dashboard Example
This lead analytics dashboard is dynamically structured regarding lead sources, conversion rates, campaign performance, and lead quality metrics, clearly visualizing how leads are acquired and nurtured. Interactive filters—such as time range, lead source, region, or campaign—enable deeper exploration and comparative analysis. Using intuitive visuals like funnel charts, heat maps, and trend lines makes this report a top choice to optimize marketing spend and effectively refine lead qualification strategies.
If you are looking for more SaaS lead dashboards, then you must check out SaaS lead scoring dashboard template. Click Here
Benefits of Lead Generation Dashboards
Lead generation dashboards offer a ton of value for sales and marketing teams by turning raw lead data into actionable insights. Here are some key benefits:
- Real-time visibility into funnel performance
- Better targeting with channel & campaign insights
- Improved sales & marketing alignment
- Smarter decision-making with trend analysis
- Offer a high-level overview for leadership while allowing drill-downs for deeper analysis.
- Eliminate the need for manual reporting and reduce the risk of data silos.
KPIs to Track in Lead Generation Dashboards
Our best lead generation dashboard consists of important SaaS-related metrics such as:
- Total Leads Generated: These are the total number of users who became aware of the offering within the specific span of time.
- Conversion rate: The percentage of users who have undertaken the desired action on the app or website.
- Cost Per lead: This is the cost associated with the acquisition of a new lead or a potential customer.
- Top Performing source: It is the marketing channel that generates the highest revenue in relation to cost employed on that source.
- ROI on Leads: It is a metric that evaluates how profitable is the marketer’s efforts for lead generation.
- Total marketing spend: The total of all the expenses spent on marketing activities such as campaigns, advertising, promotions, etc.
- Efficiency Rate: This KPI measures how effectively your lead generation efforts are turning inputs into meaningful outputs (like qualified leads or conversions).
- % Distribution by Lead Quality: shows the proportion of leads categorized by their quality tiers relative to the total leads generated within a specific period.
How to Create a Lead Generation Dashboard
To create this dashboard, you just need to plug in your data into the ready-to-use sample lead generation dashboard. Follow the 3-step process and you are good to go:
- Create or log in to your Mokkup Account using your email.
- Head to the Templates section and select the dashboard you want to build.
- Download the template as a PDF, PNG, or JPEG, or export directly to the Power BI tools.
Note: This is a Pro template. You’ll need a Pro subscription on Mokkup to use and customize this dashboard wireframe. Upgrade anytime to unlock full access.
How to Analyze Data in Lead Generation Dashboards
Analyzing data in lead generation dashboards helps you go beyond vanity metrics and actually improve your marketing and sales outcomes. This can be similar to a SaaS lead generation dashboard template, which automates leads and does funnel analysis.
Here, you can start by tracking total leads over time to spot trends. Break down data by source and campaign to see what’s driving results, and assess lead quality to ensure you're attracting the right prospects. Analyze funnel conversion rates to find drop-offs, and monitor key metrics like cost per lead and time to conversion.
Frequently Asked Questions
Q1. How to create an effective lead generation report?
Combine lead source data, track conversions, and highlight ROI with clear visuals.
Q2. What metrics should be tracked in lead generation dashboards?
Track leads generated, conversion rate, cost per lead, ROI, lead quality, and top sources.
Q3. Best practices for measuring lead conversion rates?
Measure across funnel stages, segment by source, and compare against benchmarks.
Q4. How to optimize lead generation campaign performance?
Focus on high-ROI channels, A/B test campaigns, and refine targeting.
Q5. What are the key components of sales lead tracking?
Lead source, scoring, funnel stages, time to conversion, and sales alignment.