
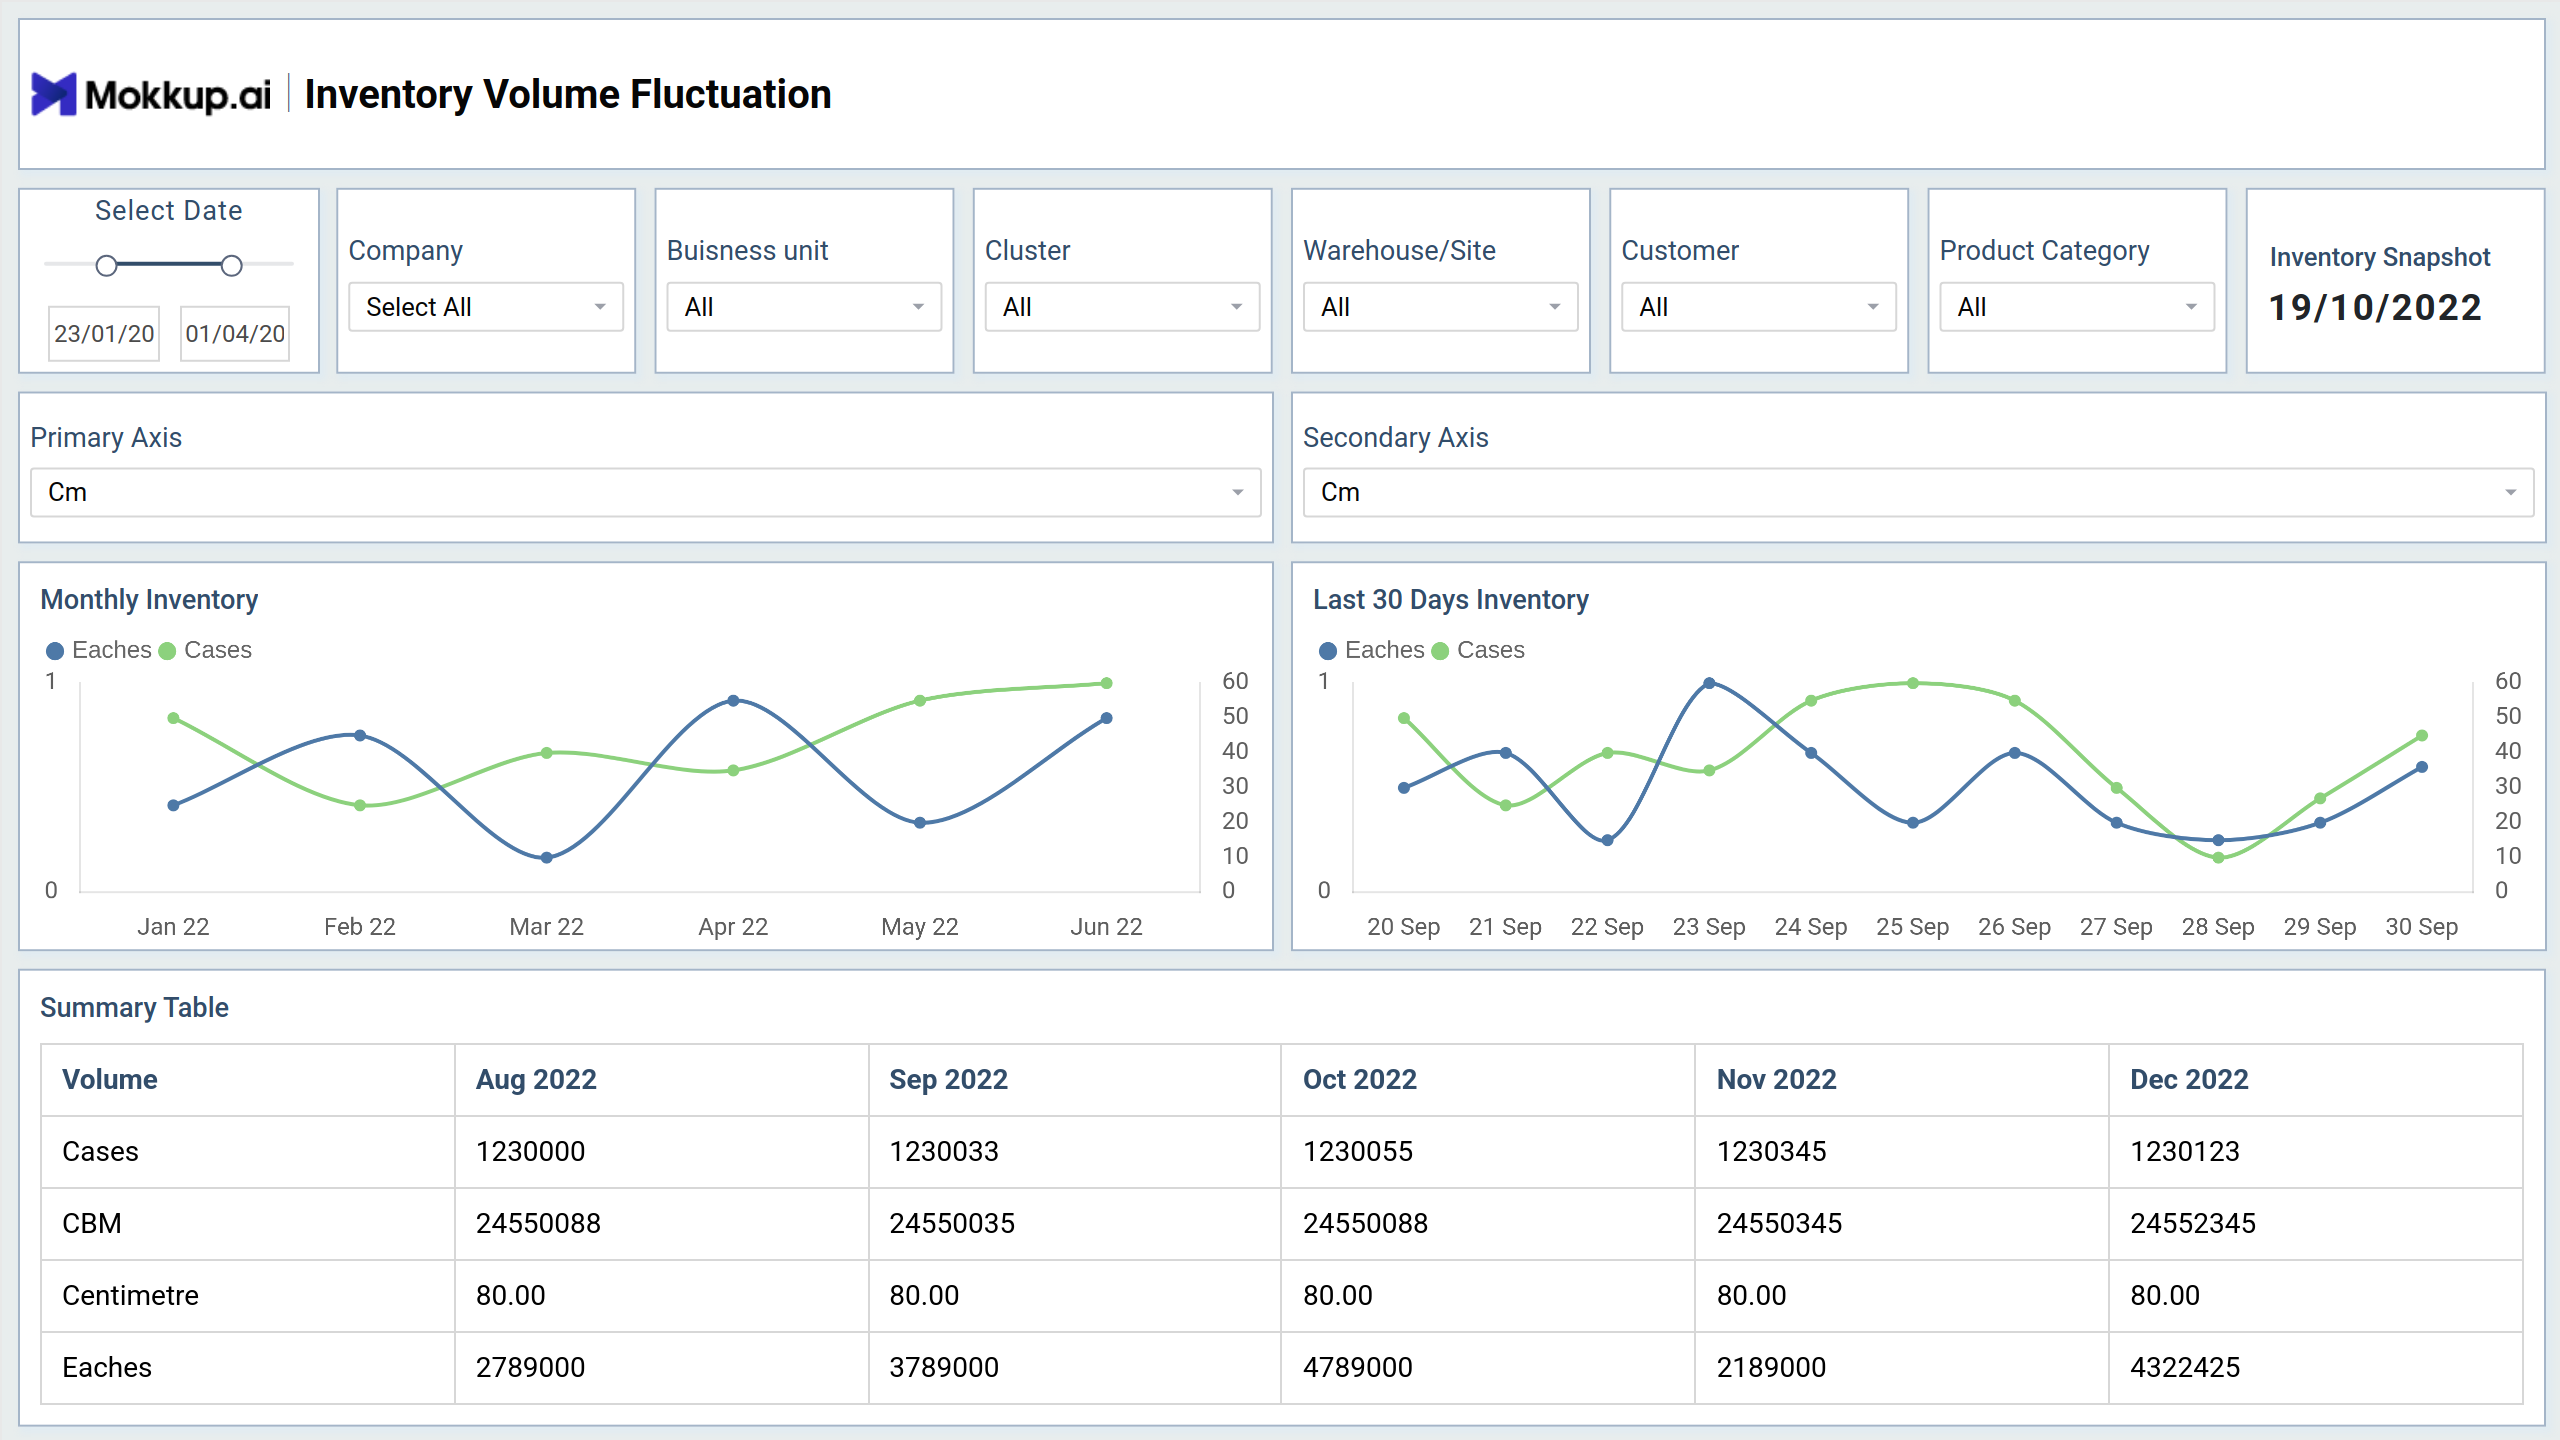
The Inventory Volume Fluctuation Dashboard template offers a comprehensive overview of fluctuations in inventory volume within a specified timeframe. It provides insights into changes in inventory levels over time, allowing stakeholders to monitor stock movements, identify trends, and make informed decisions regarding inventory management.
Inventory Volume Fluctuation
Screen 1 of the Inventory Volume Fluctuation Dashboard wireframe offers a detailed breakdown of monthly and last 30 days inventory levels, providing valuable insights into stock movements and trends over time.
Key Terms to Know
- Monthly Inventory: Presents the inventory levels for each month, measured in terms of both eaches and cases, allowing stakeholders to track inventory fluctuations over time and identify seasonal trends or patterns.
- Last 30 Days Inventory: Provides insights into inventory levels over the last 30 days, enabling real-time monitoring of recent stock movements and identifying short-term fluctuations that may require immediate attention.
- Summary Table: Offers a consolidated summary of inventory volume data across months, facilitating easy comparison and analysis of inventory trends and patterns.
These metrics help to make informed decisions regarding inventory management, supply chain optimization, and overall operational efficiency.
Inbound & Outbound Volume Fluctuation
The Inbound and Outbound Fluctuation Screen provides insights into the fluctuations in inbound and outbound activities within a specified timeframe. It offers valuable information on the variations in incoming and outgoing shipments, helping in monitoring and optimizing supply chain operations.
Key Terms to Know
- Monthly and Daily CBM: Provides insights into the cubic meter (CBM) measurements for both monthly and daily inbound and outbound activities, including issuing, receiving, and throughput. This data helps in monitoring the volume of goods flowing in and out of the warehouse.
- Last 30 Days Inventory: Offers information on inventory levels over the last 30 days, enabling real-time tracking of recent stock movements and fluctuations in inbound and outbound activities.
- Summary Table for CBM: Presents a summarized view of CBM data, allowing stakeholders to easily compare and analyze inbound and outbound volume metrics across different timeframes and locations.
- Monthly Volume Fluctuation: Provides an overview of monthly volume fluctuations, highlighting changes in inbound and outbound activities over time and aiding in trend analysis and forecasting.
Together, these metrics offer insights into the fluctuations in inbound and outbound activities, enabling stakeholders to optimize supply chain operations and improve overall efficiency.
Volume Vs Headcount Fluctuation
The Volume Vs Headcount Fluctuation Screen offers insights into the relationship between operational volume and workforce headcount within a specified timeframe. It provides valuable information on monthly headcounts, productivity metrics, and workforce utilization, helping in workforce planning and operational optimization.
Key Terms to Know
- Monthly Headcounts: Displays the number of employees present in the workforce for each month, allowing stakeholders to track staffing levels over time and identify trends in workforce size.
- Monthly Cases per Actual Man Hour: Provides insights into productivity by measuring the number of cases handled per actual man hour worked, aiding in workforce efficiency analysis and performance evaluation.
- Monthly Cases and Overtime Hours: Offers information on the volume of cases processed and the corresponding overtime hours worked by employees each month, enabling stakeholders to assess workload distribution and overtime utilization.
- Monthly Headcounts Summary: Presents a summarized view of monthly headcount data, facilitating easy comparison and analysis of workforce size across different timeframes.
- Monthly Budgeted vs Actual Labor Cost: Compares the budgeted labor costs with the actual labor costs incurred each month, helping stakeholders to evaluate cost management and budget adherence.
- Monthly Budgeted vs Actual Headcounts: Compares the budgeted headcount with the actual headcount for each month, enabling stakeholders to assess workforce planning and resource allocation effectiveness.
The insights into relationship between operational volume and workforce headcount, helps in workforce management, productivity optimization, and cost control efforts.
Volume Vs Headcount Fluctuation
Screen 4 - The Volume Vs Headcount Fluctuation Screen provides insights into the correlation between operational volume, workforce staffing, and productivity metrics, including contribution per handling, storage volume, and staff details.
Key Terms to Know
- Contribution per Handling with Storage Volume for ADV Staff: Indicates the contribution generated per unit of handling combined with storage volume specifically for ADV staff members.
- Contribution per Handling with Storage Volume for MP Staff: Represents the contribution generated per unit of handling combined with storage volume specifically for MP staff members.
- Contribution per Handling with Storage Volume for ADV + MP Staff: Reflects the contribution generated per unit of handling combined with storage volume for both ADV and MP staff collectively.
- Individual Contribution Metrics for ADV and MP Staff: Provides insights into the contribution generated individually by ADV and MP staff members, allowing for performance evaluation and comparison.
- Contribution per Handling + Storage Volume: Offers an overall measure of contribution generated per unit of handling combined with storage volume, providing a comprehensive view of operational efficiency and productivity.
Dashboard Template Insights
The dashboard wireframe offers timely insights into inventory fluctuations, enabling stakeholders to track stock movements and trends over time.
- With data on monthly and daily inventory levels, along with last 30 days inventory summaries, stakeholders can monitor inventory changes in real-time and make informed decisions.
- Analysis of monthly volume fluctuations allows for a deeper understanding of inventory dynamics, facilitating performance evaluation and optimization strategies.
Conclusion
The Inventory Volume Fluctuation Dashboard template provides essential data visualizations for effective inventory management. By offering insights into inventory levels, fluctuations, and trends, it enables stakeholders to optimize inventory levels, streamline operations, and enhance overall efficiency.