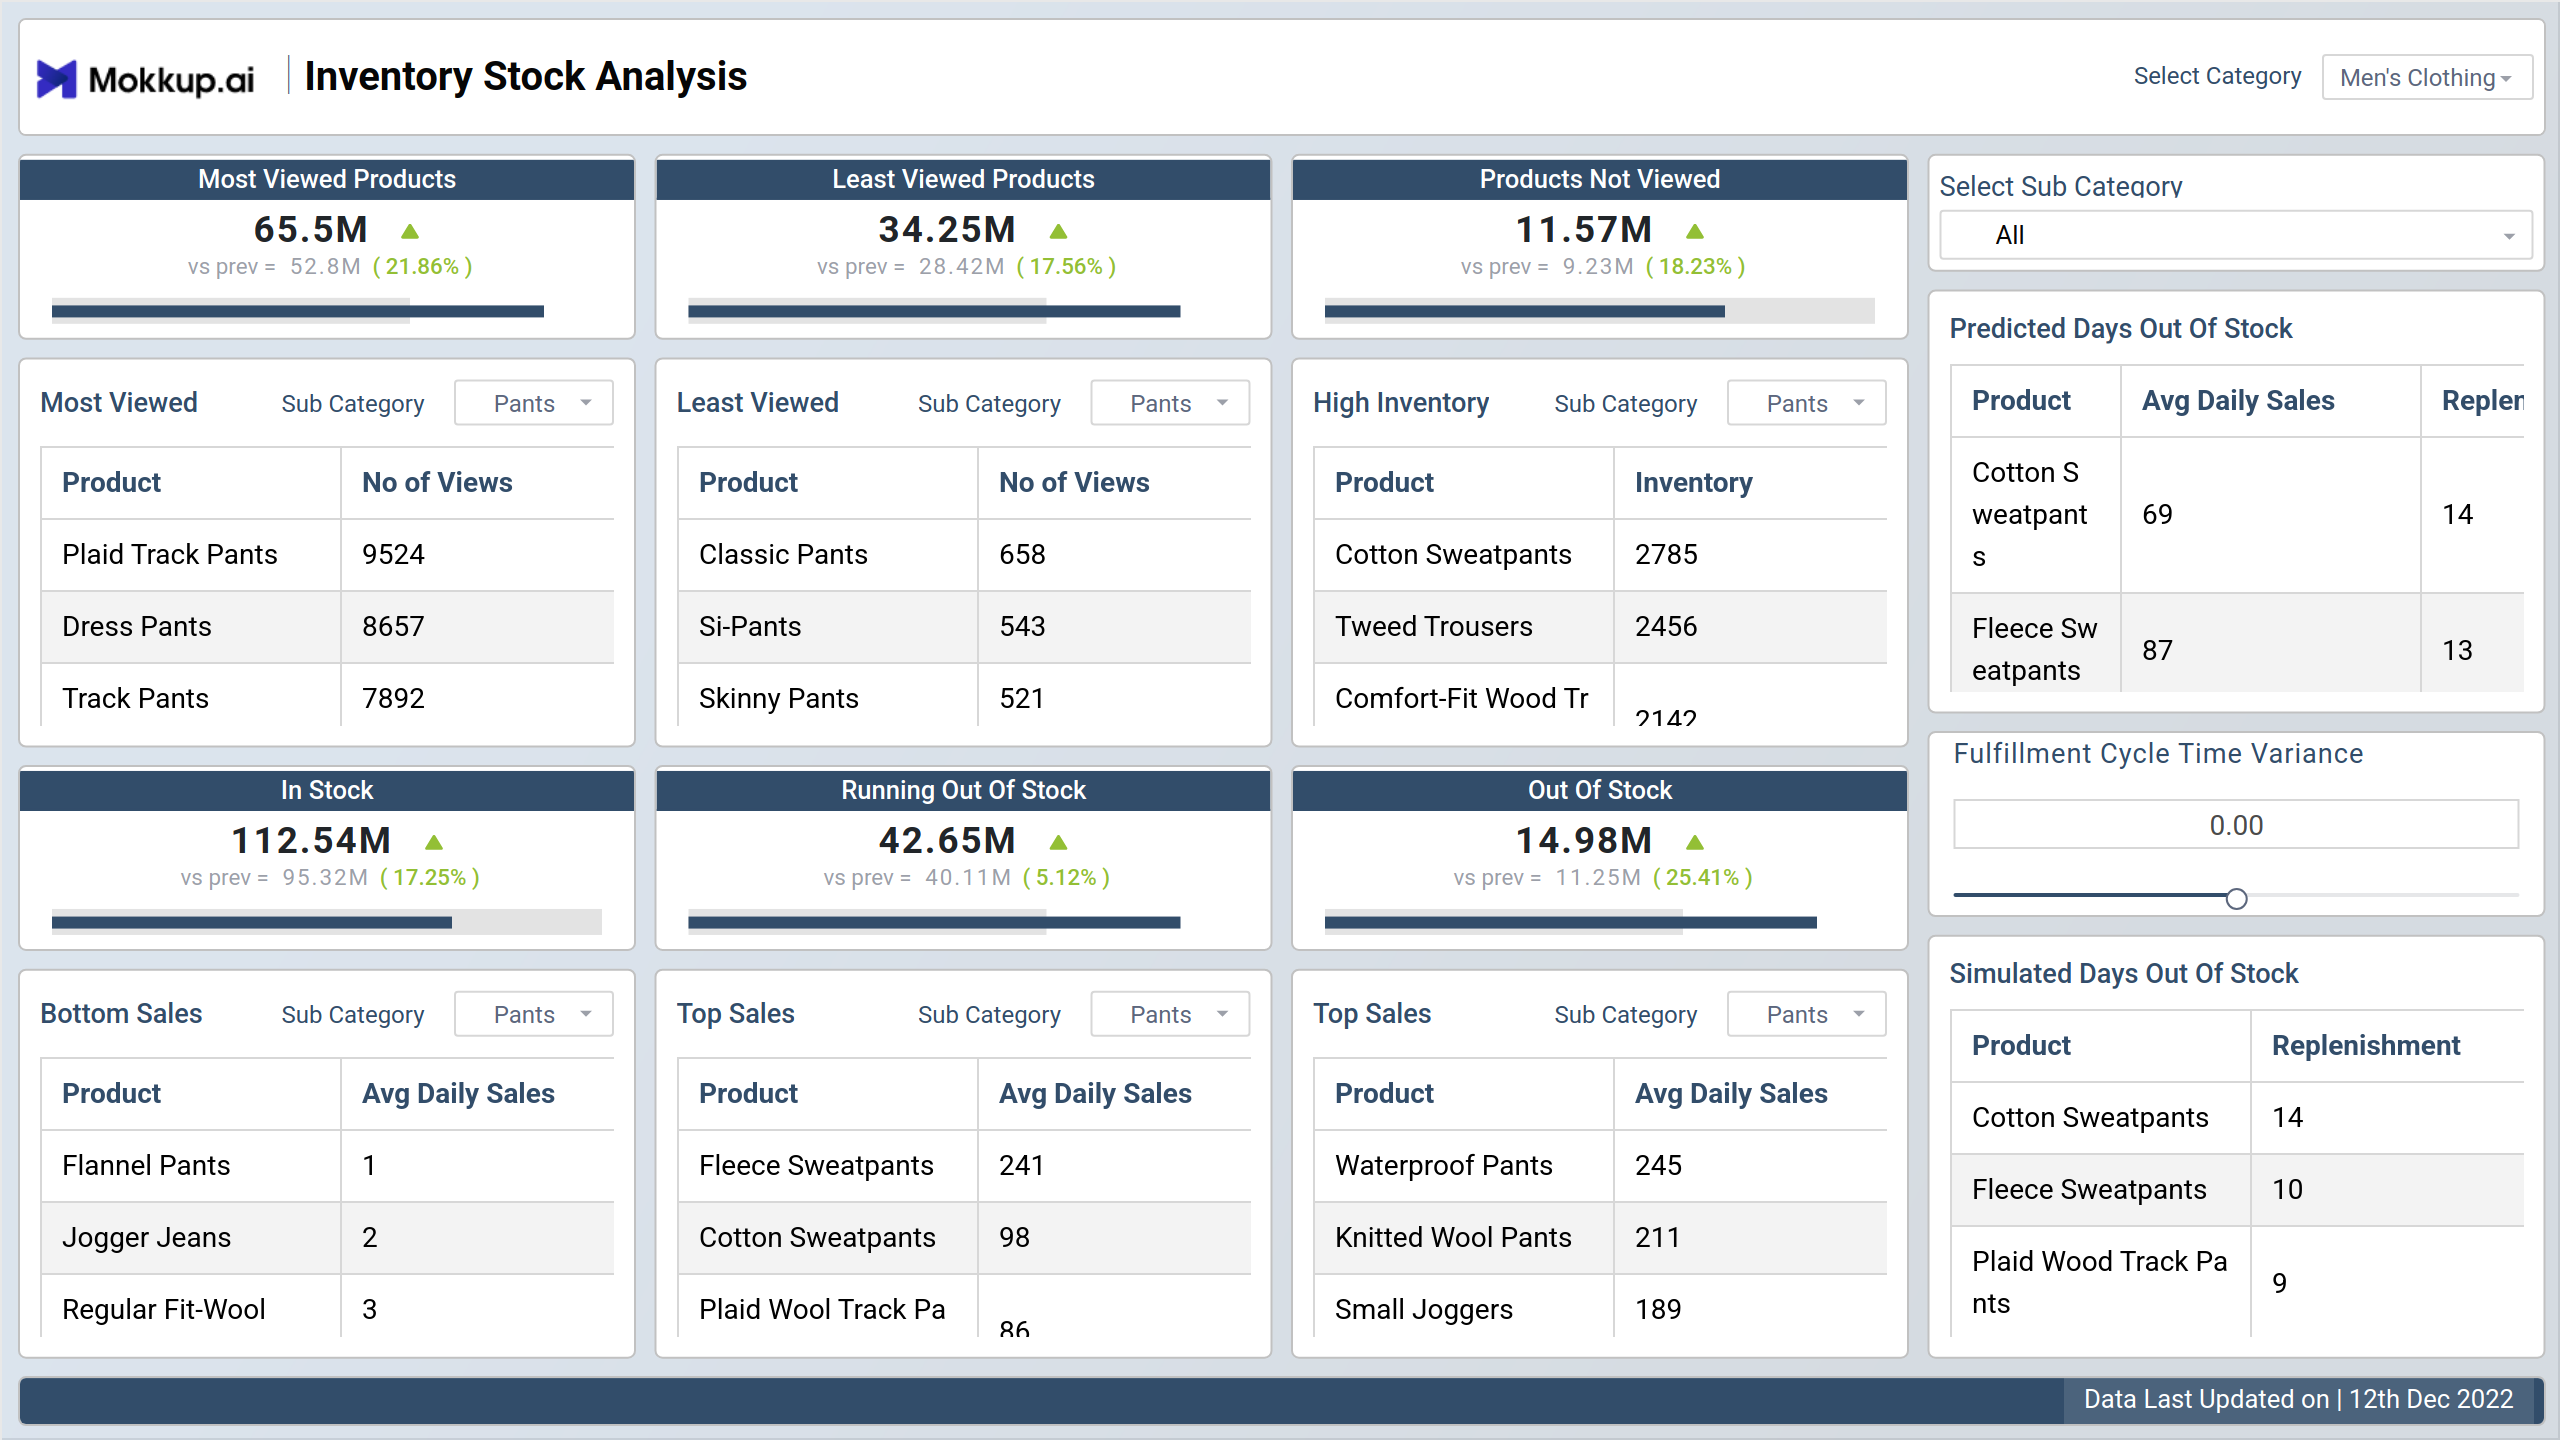
An Inventory Stock Analysis dashboard is a template used to track and analyze inventory levels of a business. The dashboard provides a visual representation of the key metrics related to inventory. Such as stock levels, stock movements, and stock value. The dashboard provides a level of a business's inventory and helps them make informed decisions about inventory management. The dashboard wireframe can include the following information:
- The quantity of products in stock
- Value of the inventory
- The value at which the products are being sold
- The value at which the products are being replenished
- It may also include information on stock movements, such as the number of products received, the number of products shipped, and the number of products returned.
Key Terms to know:
- Most Viewed Products in Stock: Identify popular products that are available to purchase.
- Running Out of Stock: Identify products that are becoming low in stock and may need to be replenished soon.
- Least Viewed Products: Identify products that are not being viewed by customers.
- Out of Stock: Identify products that are not available to purchase.
- Products Not Viewed: Identify products that have never been viewed by customers.
Dashboard Template Insights
The wireframe offers the following insights:
- The Inventory Stock Analysis dashboard wireframe facilitates strategic inventory management by tracking key metrics like stock levels and movements.
- It enables businesses to tailor inventory and marketing strategies based on customer behavior, enhancing satisfaction and sales.
- By preventing stockouts, optimizing supply chains, and making data-driven decisions, businesses can improve operational efficiency and maintain competitiveness.
Conclusion
An Inventory Stock Analysis dashboard template can help businesses monitor and manage their inventory. Businesses can make informed decisions about inventory management, supply chain management, and marketing efforts by providing information about product sales, inventory levels, customer demand, and other relevant metrics.
Businesses can improve operational efficiency, reduce the risk of stockouts, and increase customer satisfaction by analyzing this data and answering important questions about their inventory. Overall, the inventory stock analysis dashboard is an important tool for businesses to use in order to stay ahead of the competition and maintain their success.