
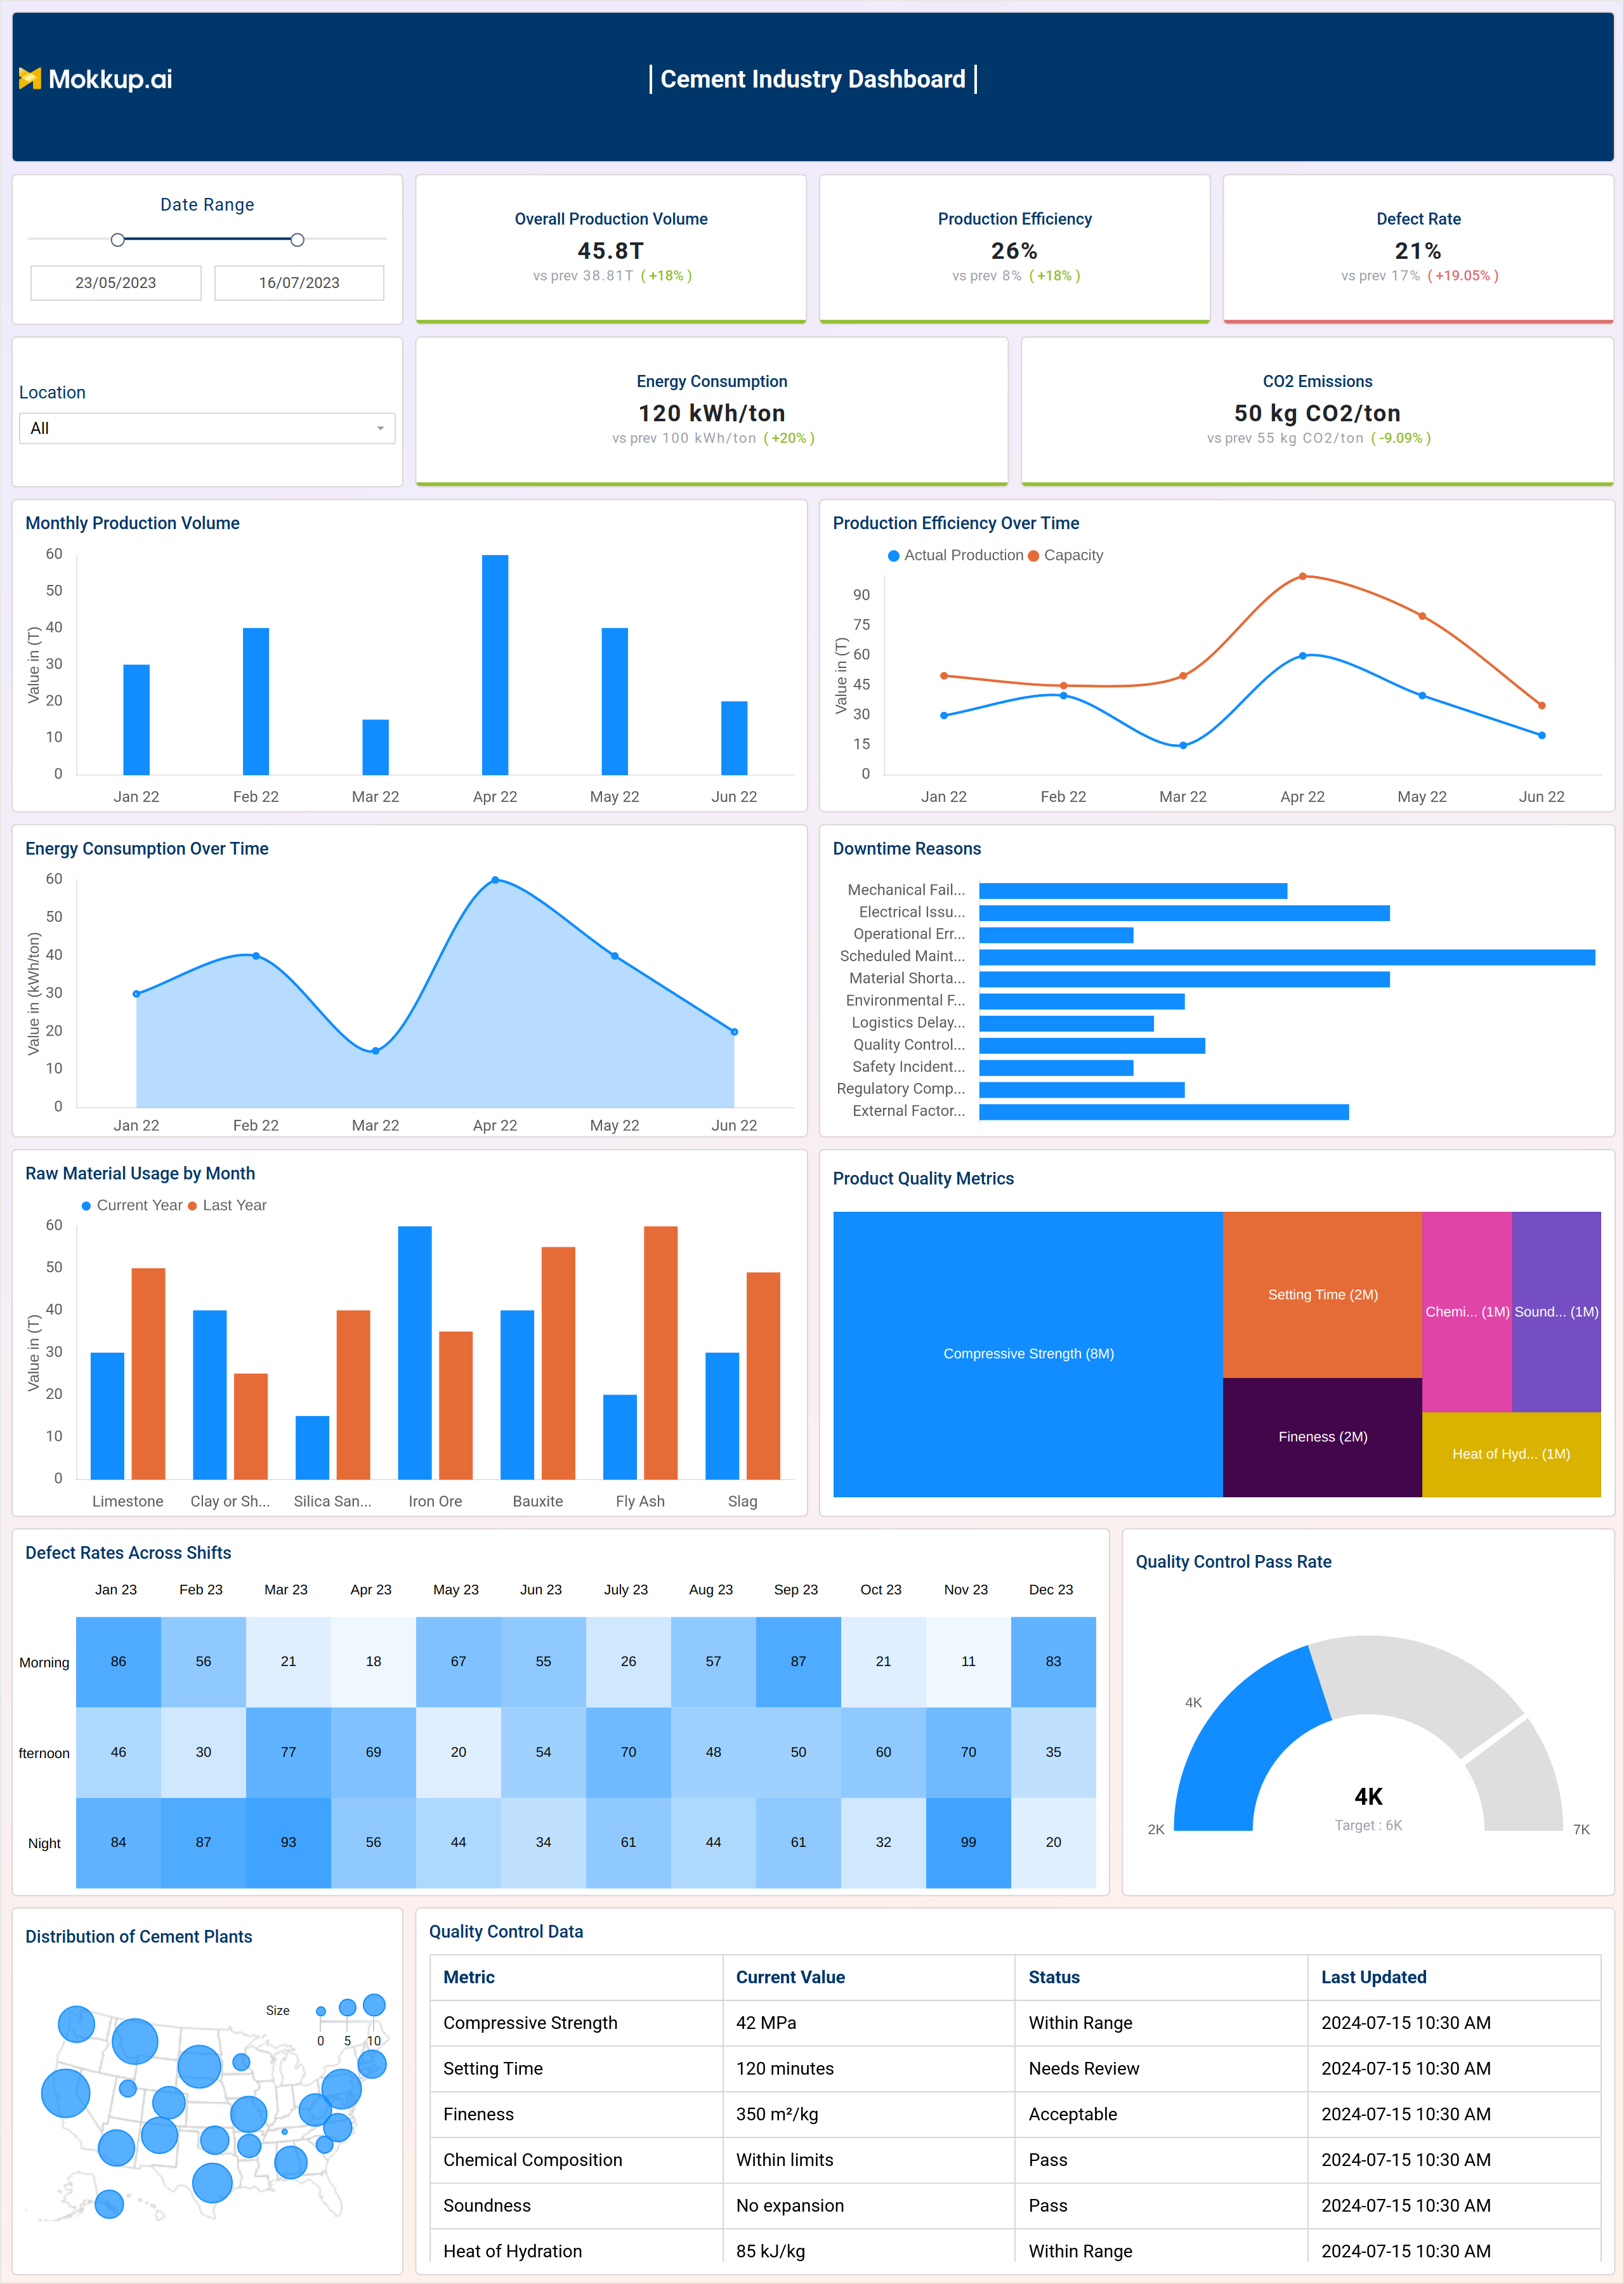
The industrial cement analytics dashboard template offers a comprehensive view of key metrics related to production, sales, and distribution within the cement industry. By consolidating data on manufacturing processes, sales performance, and market trends, this dashboard provides valuable insights to support strategic decision-making. It is designed to help industry stakeholders effectively manage resources, monitor performance, and drive growth in a competitive market.
The dashboard wireframe comprises two screens: Production & Quality Control, and Financial & Operational Efficiency; each is explained briefly below.
Production & Quality Control
Thia screen provides a comprehensive overview of the production and quality control processes. It includes key metrics such as total production output, average output per employee, and defect rate. It also visualizes trends in these metrics over time and compares them to industry benchmarks.
Key Terms to Know
- Overall Production Volume: Displays the total amount of cement produced within a specific period.
- Production Efficiency: Measures the efficiency of the production process.
- Defect Rate: Indicates the percentage of defective products in the overall production.
- Energy Consumption: Shows the total energy used during the production process.
- CO2 Emission: Reflects the amount of CO2 emitted as a result of cement production.
- Monthly Production Volume: Displays the production volume on a month-by-month basis.
- Production Efficiency Over Time: Tracks changes in production efficiency over a specified period.
- Energy Consumption Over Time: Shows trends in energy usage throughout different periods.
- Downtime Reasons: Lists the causes for any production downtimes.
- Raw Material Usage by Month: Indicates the amount of raw materials consumed each month.
- Product Quality Metrics: Provides data on various aspects of product quality.
- Defect Rates Across Shifts: Breaks down defect rates by different production shifts.
- Quality Control Pass Rates: Shows the percentage of products that pass quality control checks.
- Distribution of Cement Plants: Displays the geographical distribution of cement manufacturing plants.
- Quality Control Data: Provides detailed information on the outcomes of quality control processes.
Financial & Operational Efficiency
This view includes key metrics such as monthly revenue, cost per ton of cement, profit margin, and supplier delivery performance. It also visualizes trends in these metrics over time and compares them to industry benchmarks. By providing detailed data on financial and operational performance, this section enables stakeholders to identify areas for improvement, optimize cost structures, and enhance overall business efficiency.
Key Terms to Know
- Monthly Revenue: Displays the total revenue generated each month.
- Cost per Ton of Cement: Indicates the production cost associated with each ton of cement produced.
- Profit Margin: Shows the percentage of profit earned relative to revenue.
- Supplier Delivery Performance: Measures the reliability and timeliness of supplier deliveries.
- Employee Productivity: Reflects the overall productivity levels of employees.
- Distribution of Revenue: Breaks down revenue across different segments or regions.
- Revenue vs. Production Cost: Compares revenue generated against the costs incurred in production.
- Sales Pipeline: Provides an overview of upcoming sales opportunities and deals.
- Cost Breakdown: Details the various costs associated with cement production.
- Employee Productivity by Department: Shows productivity levels for employees within specific departments.
- Financial Performance Data: Offers a summary of the company's overall financial health and performance.
Dashboard Template Insights
Here are four key achievements of this dashboard wireframe:
- Provides a clear view of monthly revenue, profit margins, and cost breakdown, aiding in financial planning.
- Highlights key metrics like production efficiency and employee productivity, helping to enhance overall operations.
- Offers valuable insights into supplier delivery performance and revenue distribution across different regions.
- Compares revenue against production costs and analyzes the cost per ton of cement, supporting effective cost management strategies.
Conclusion
In conclusion, this dashboard wireframe provides a holistic view of the key metrics essential for driving success in the industry. From financial insights to operational efficiency and supplier performance, this dashboard consolidates critical data that supports informed decision-making. It is designed to help businesses enhance production processes, manage costs effectively, and achieve sustained growth.