The Immunization Coverage Dashboard template is essential for monitoring and managing immunization services across different regions. It provides a comprehensive overview of the availability and coverage of routine immunization services, offering valuable insights to healthcare providers, policymakers, and public health officials.
Key Terms to Know
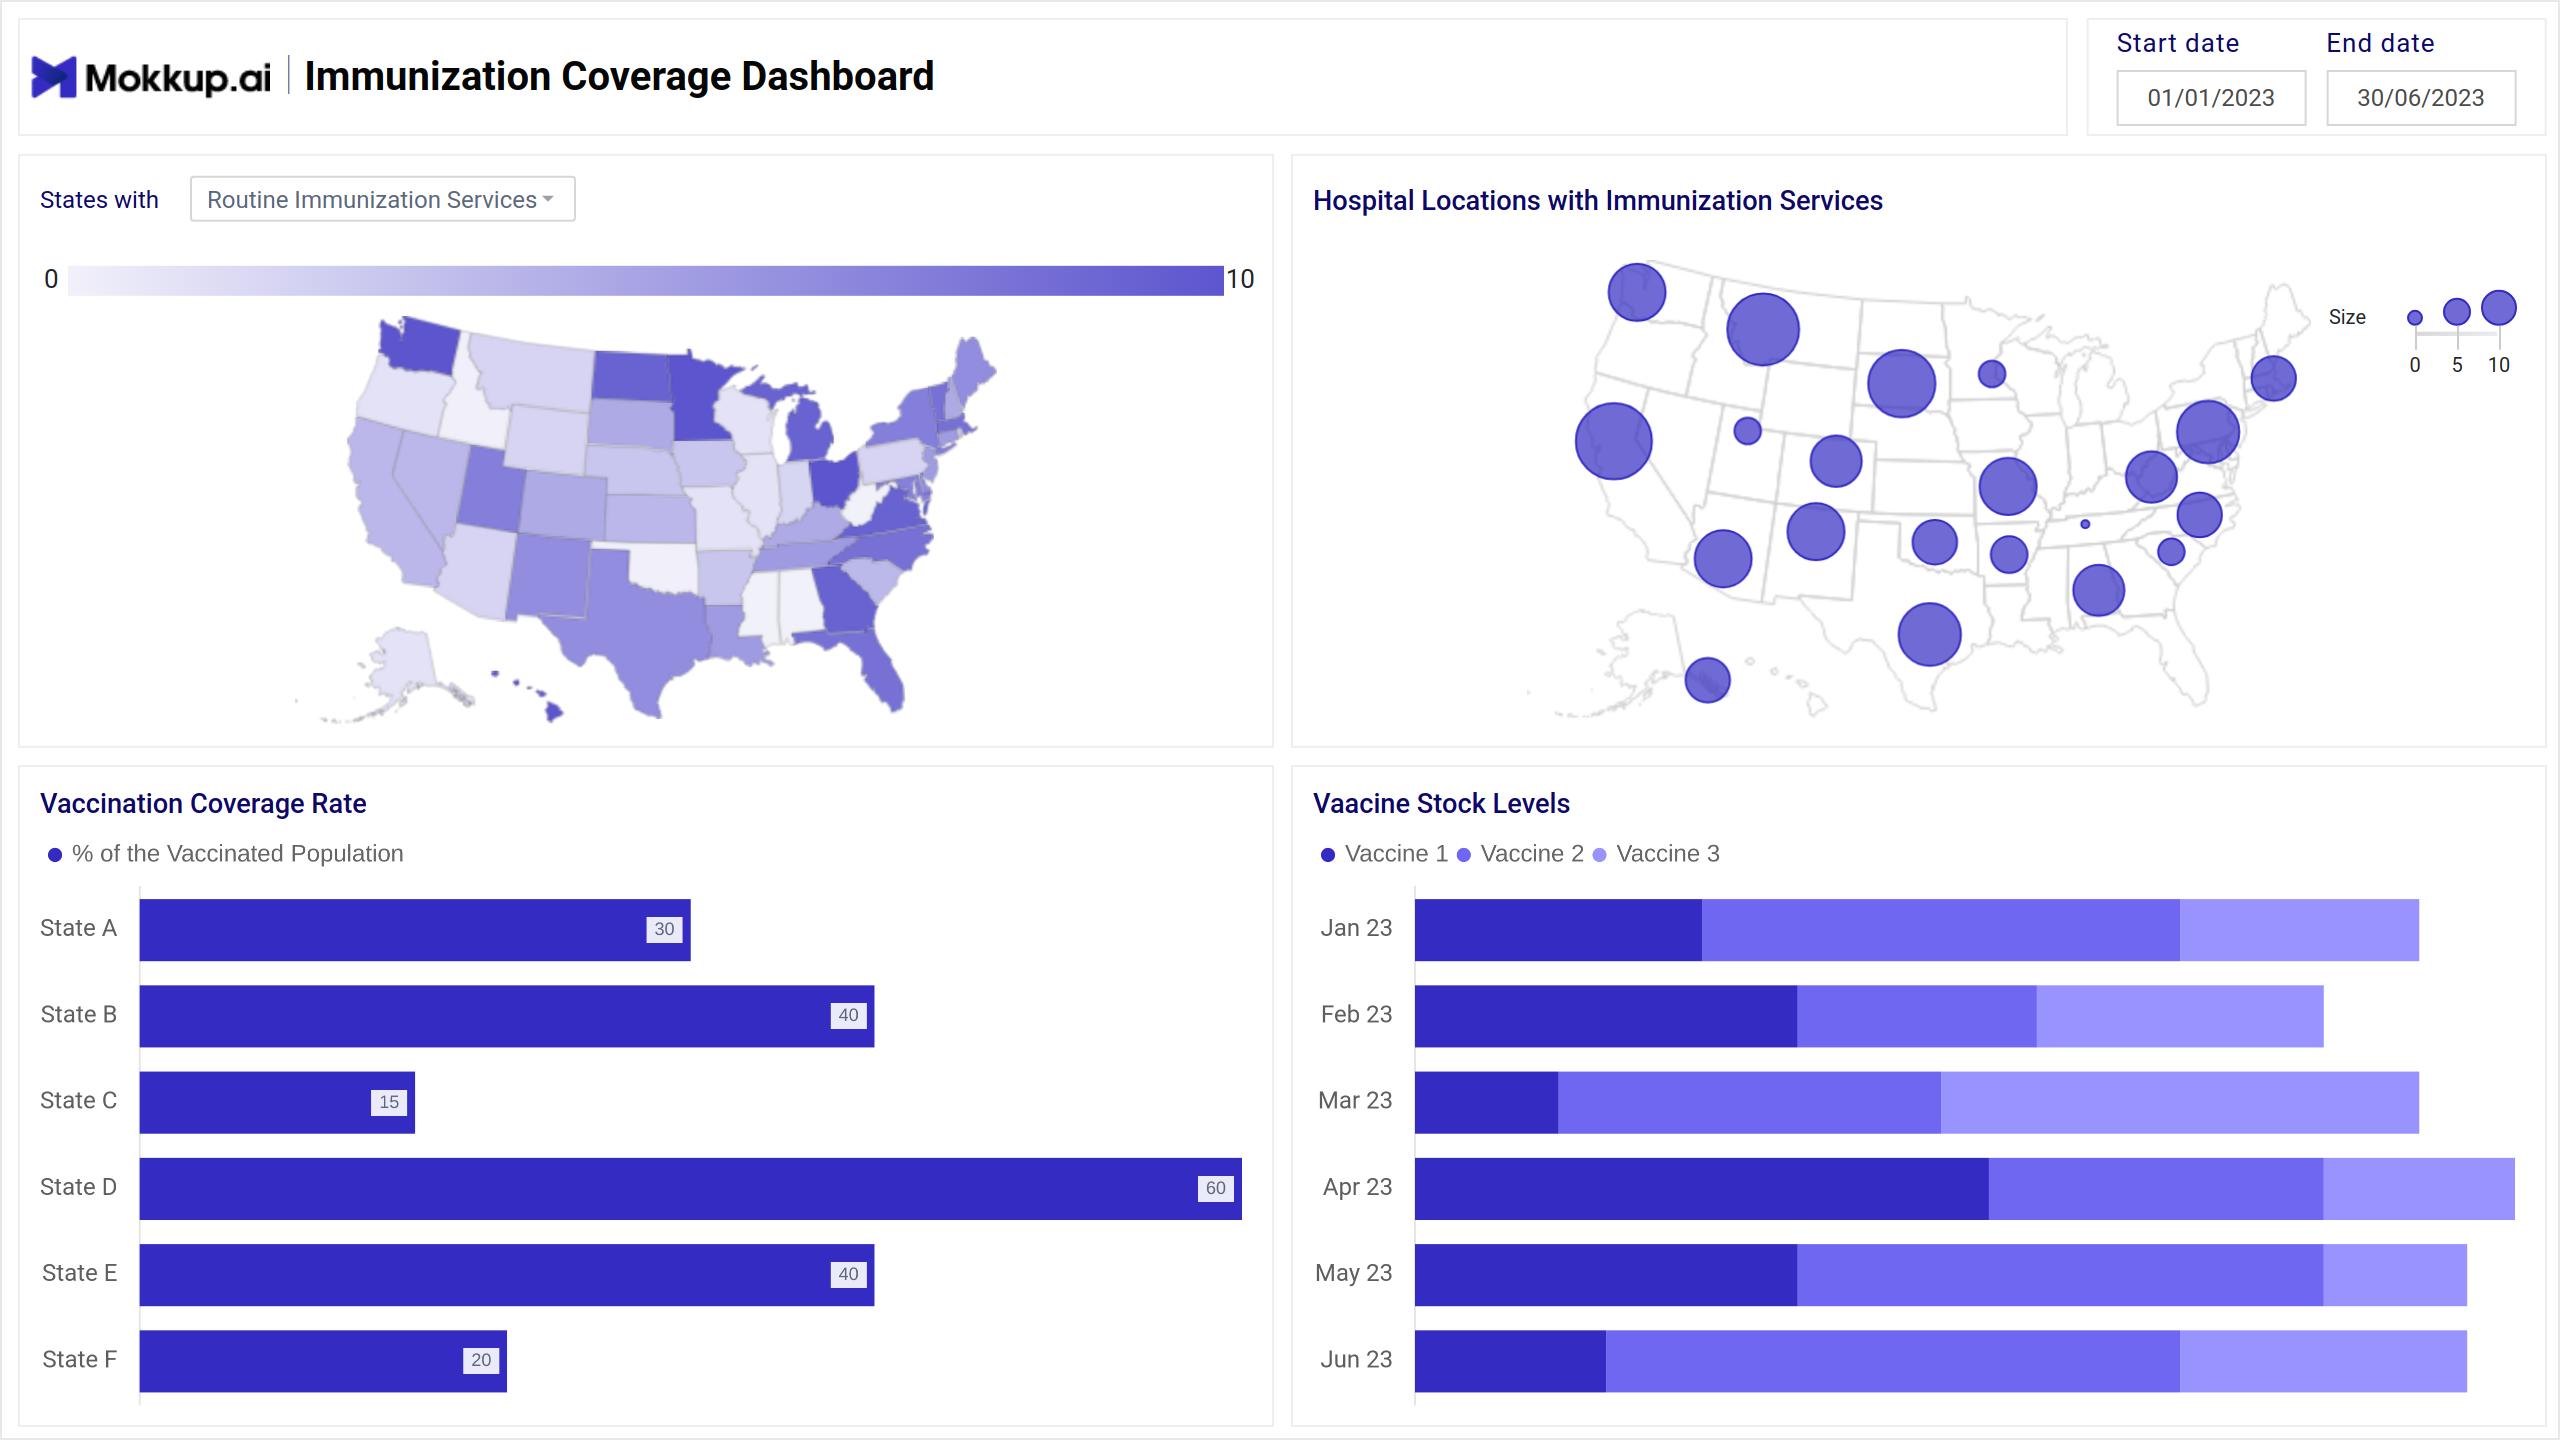
- States with Routine Immunization Services: A polymap illustrating the states where routine immunization services are available. It helps identify geographic coverage and gaps in immunization services across different states.
- Hospital Locations with Immunization Services: A clustermap showing the locations of hospitals that provide immunization services. Visualizes the concentration and distribution of healthcare facilities offering immunizations, helping in resource allocation and accessibility analysis.
- Vaccination Coverage Rate: A bar graph depicting the vaccination coverage rate across various regions or demographics. It highlights areas with high or low vaccination rates, enabling targeted interventions to improve coverage.
- Vaccine Stock Levels: A stacked bar chart displaying the levels of different vaccine stocks. It monitors the availability and sufficiency of vaccine supplies, ensuring timely replenishment and preventing stockouts.
Dashboard Template Insights
The dashboard wireframe offers crucial insights that can help in quick decision making:
- The map provides a clear view of states offering routine immunization services, highlighting areas of comprehensive coverage and identifying regions requiring additional support.
- The distribution of hospitals providing immunization services, helps stakeholders understand the density and accessibility of immunization centers.
- The vaccination coverage rate enables targeted efforts to improve vaccination rates where necessary.
- The vaccine stock levels ensure that supply chains are maintained, and potential shortages are preemptively addressed.
Conclusion
The Immunization Coverage Dashboard template is essential for public health management, providing detailed insights into the distribution and effectiveness of immunization services. By offering a visual representation of service availability, vaccination coverage, and stock levels, the dashboard wireframe helps healthcare providers and policymakers make informed decisions to enhance immunization efforts. This comprehensive monitoring aids in identifying coverage gaps, ensuring vaccine availability, and ultimately improving public health outcomes.